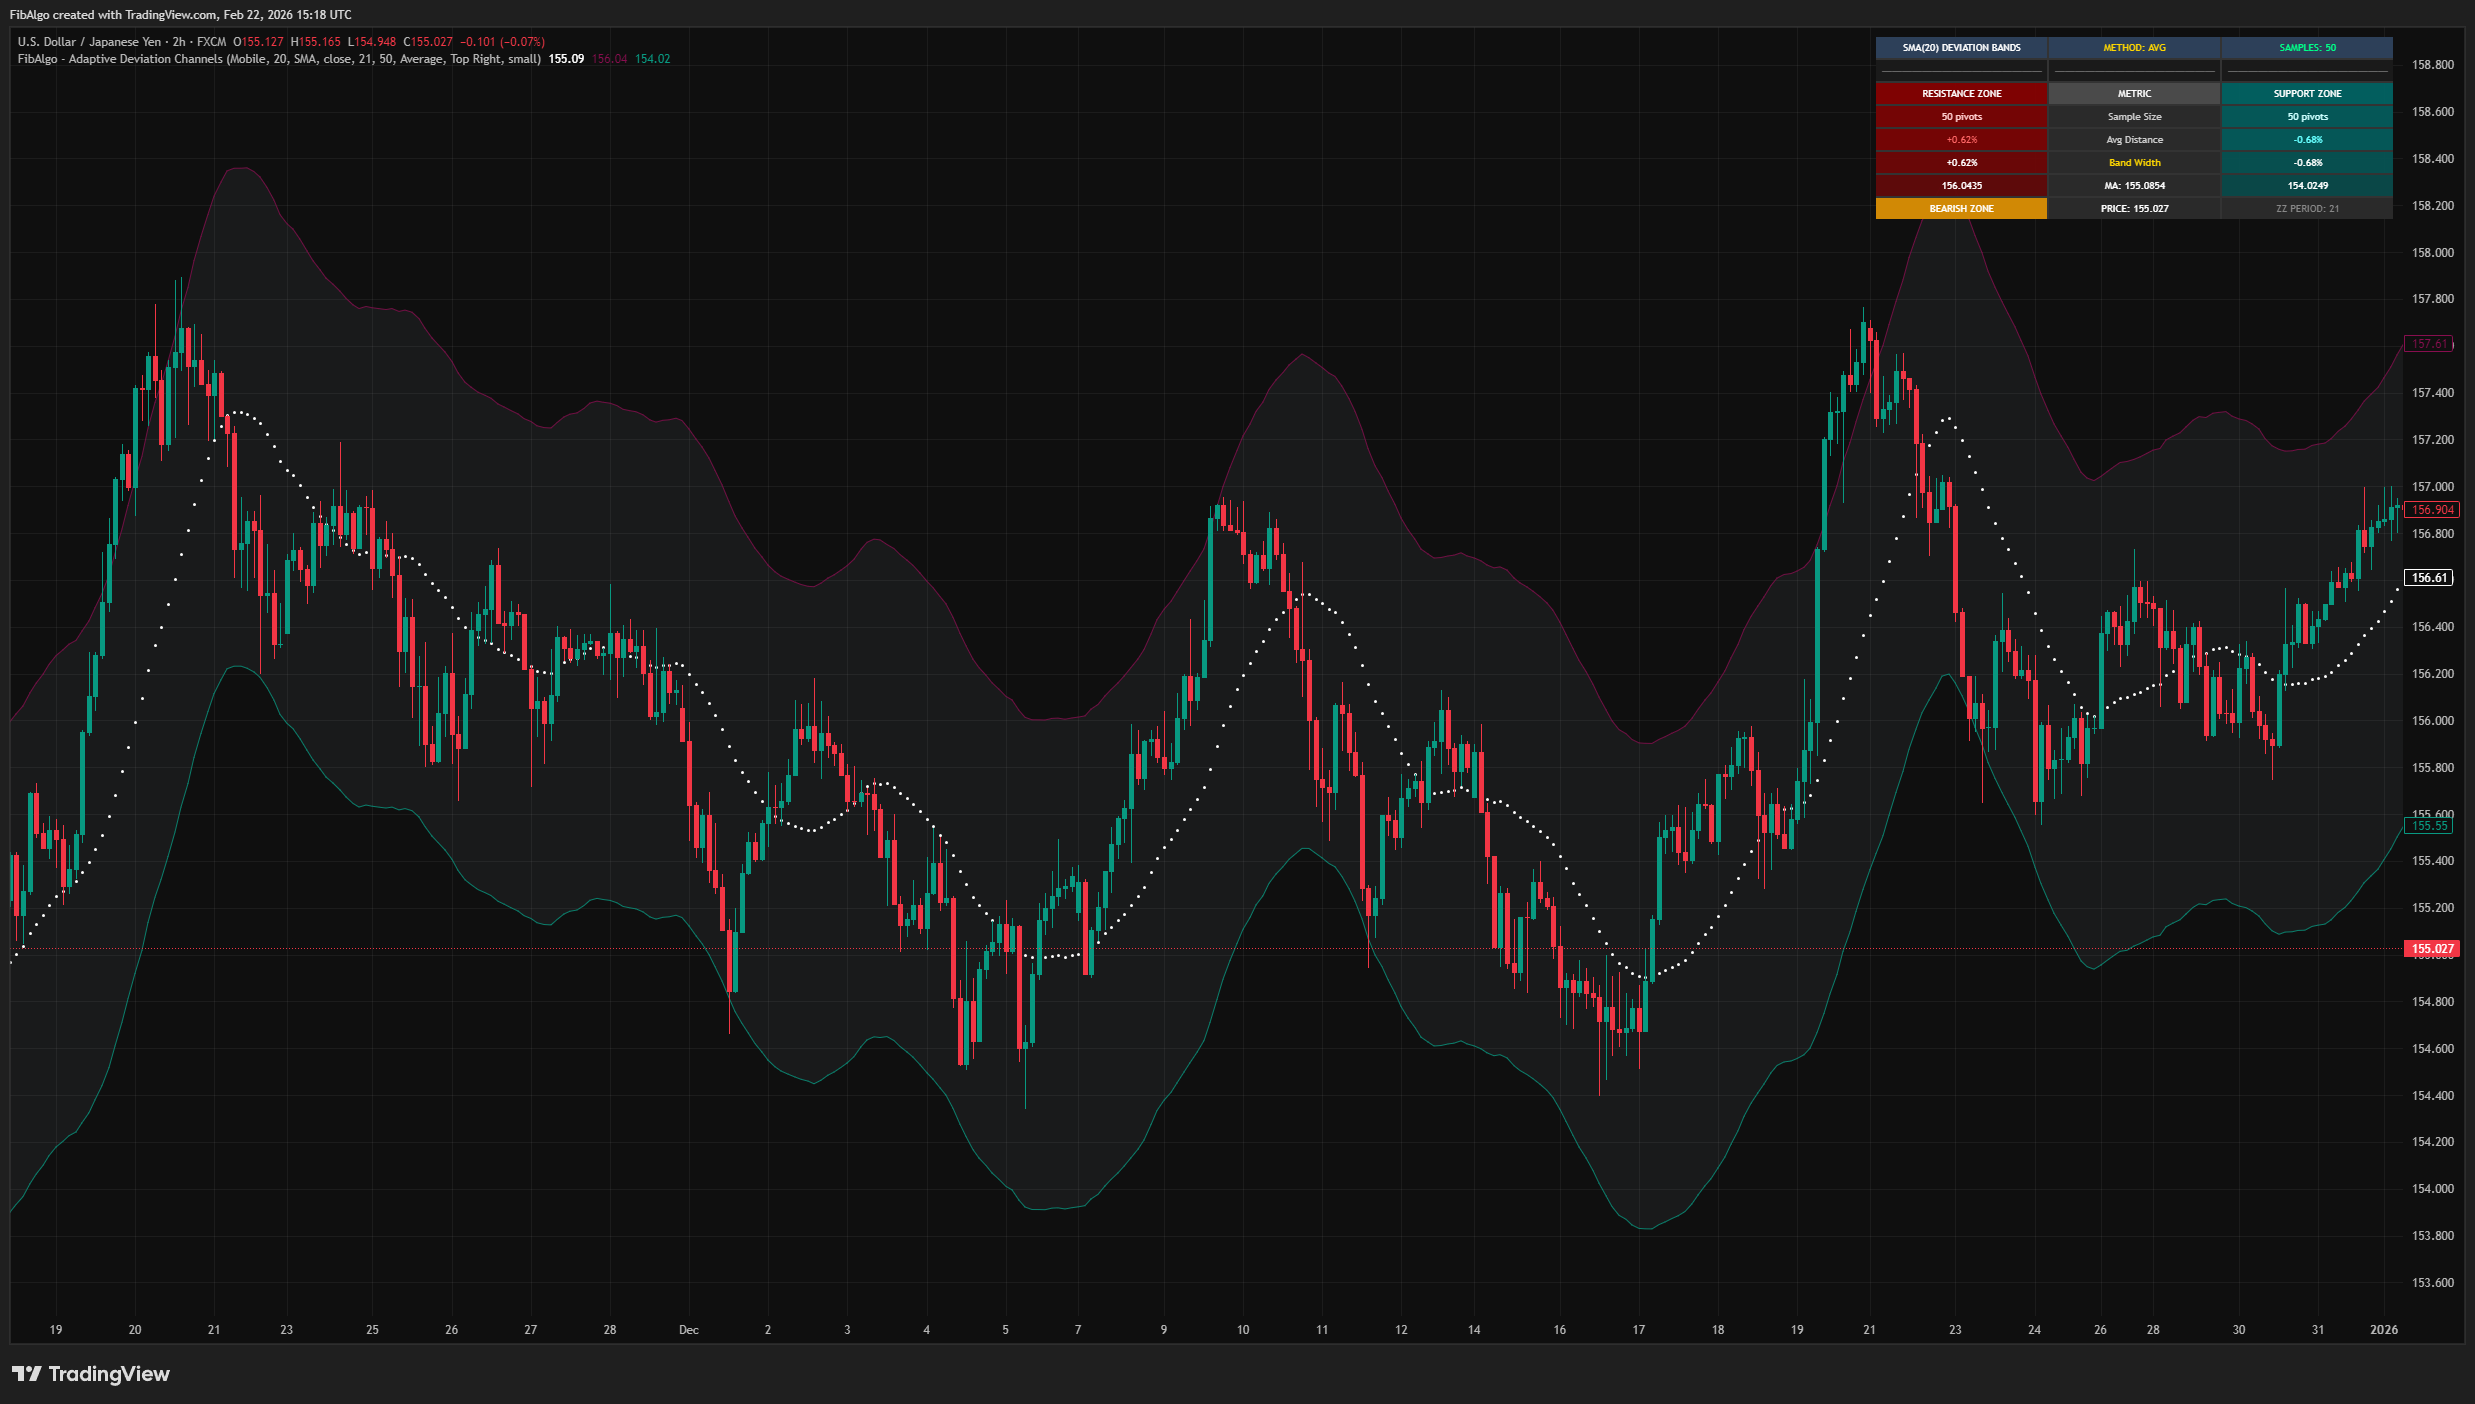
Adaptive Deviation Channels
See Details
Explore our complete collection of TradingView indicators. From Fibonacci-based tools to ICT concepts and Wyckoff methods — find the perfect indicator for your trading strategy.
Explore our complete collection of TradingView indicators. From Fibonacci-based tools to ICT concepts and Wyckoff methods — find the perfect indicator for your trading strategy.
 Free
FreeTradingView indicator that creates dynamic support and resistance zones by analyzing historical pivot point deviations from a central moving average.
 Exclusive
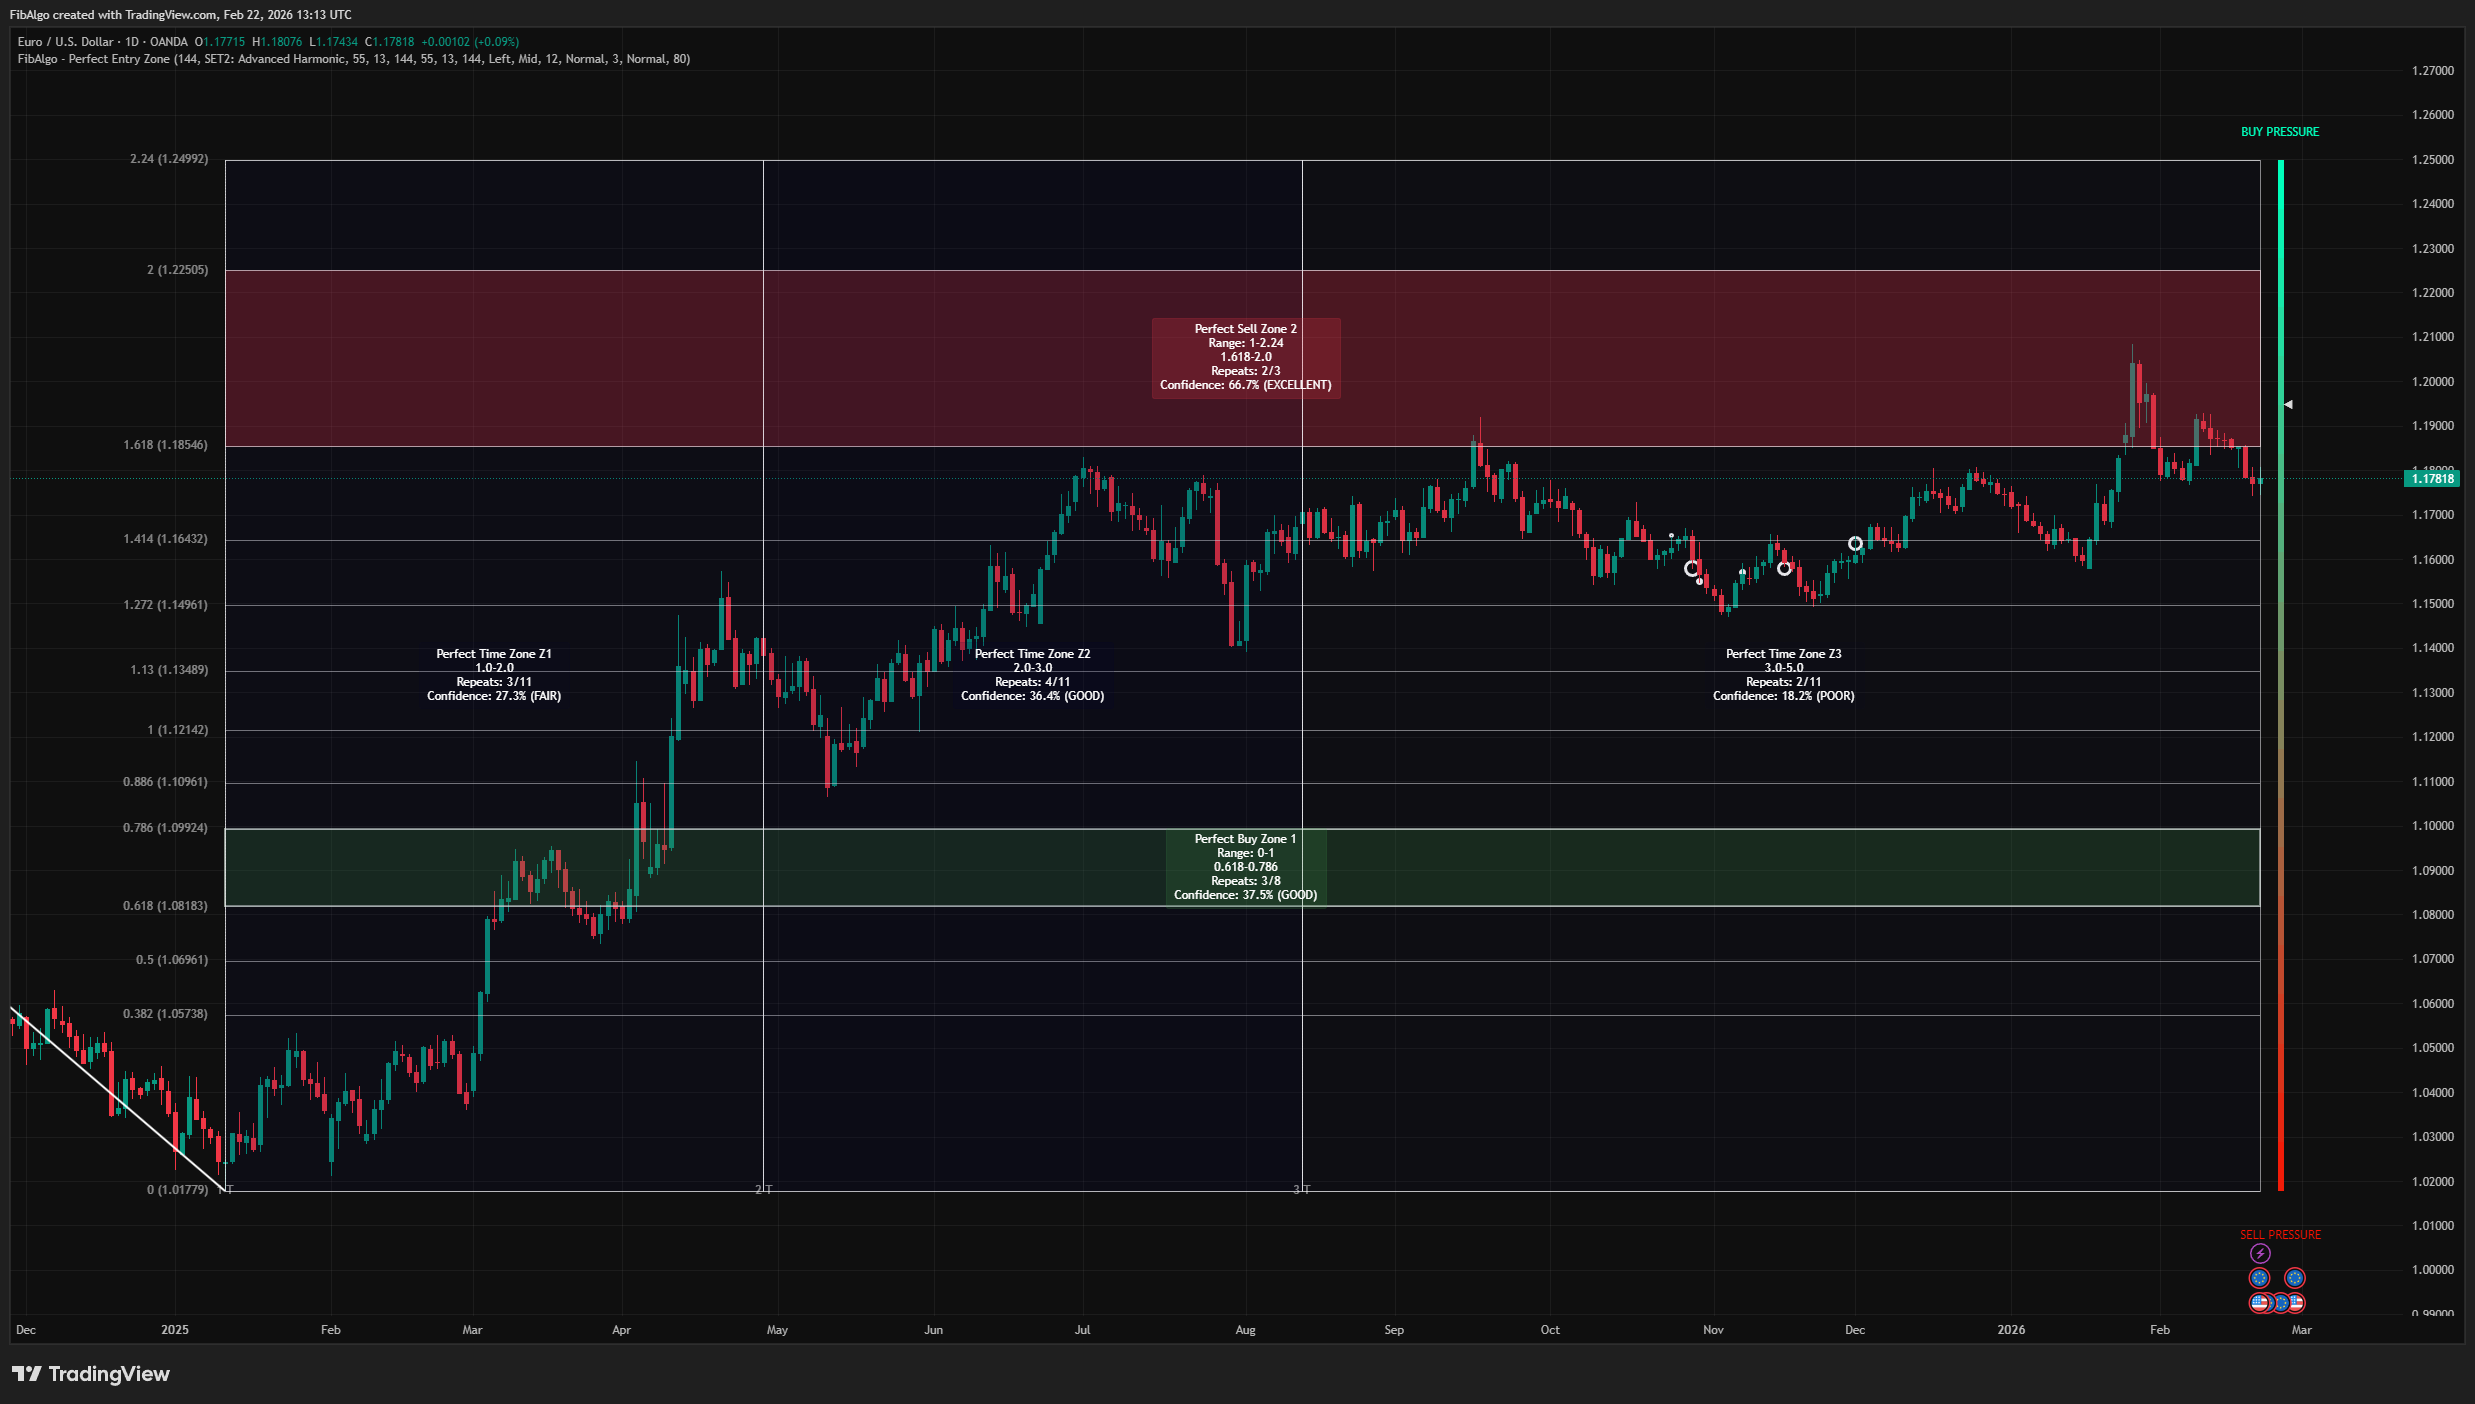
Adaptive Fibonacci-based support and resistance indicator for TradingView that identifies recurring retracement zones and projects Fibonacci time zones.
 Exclusive
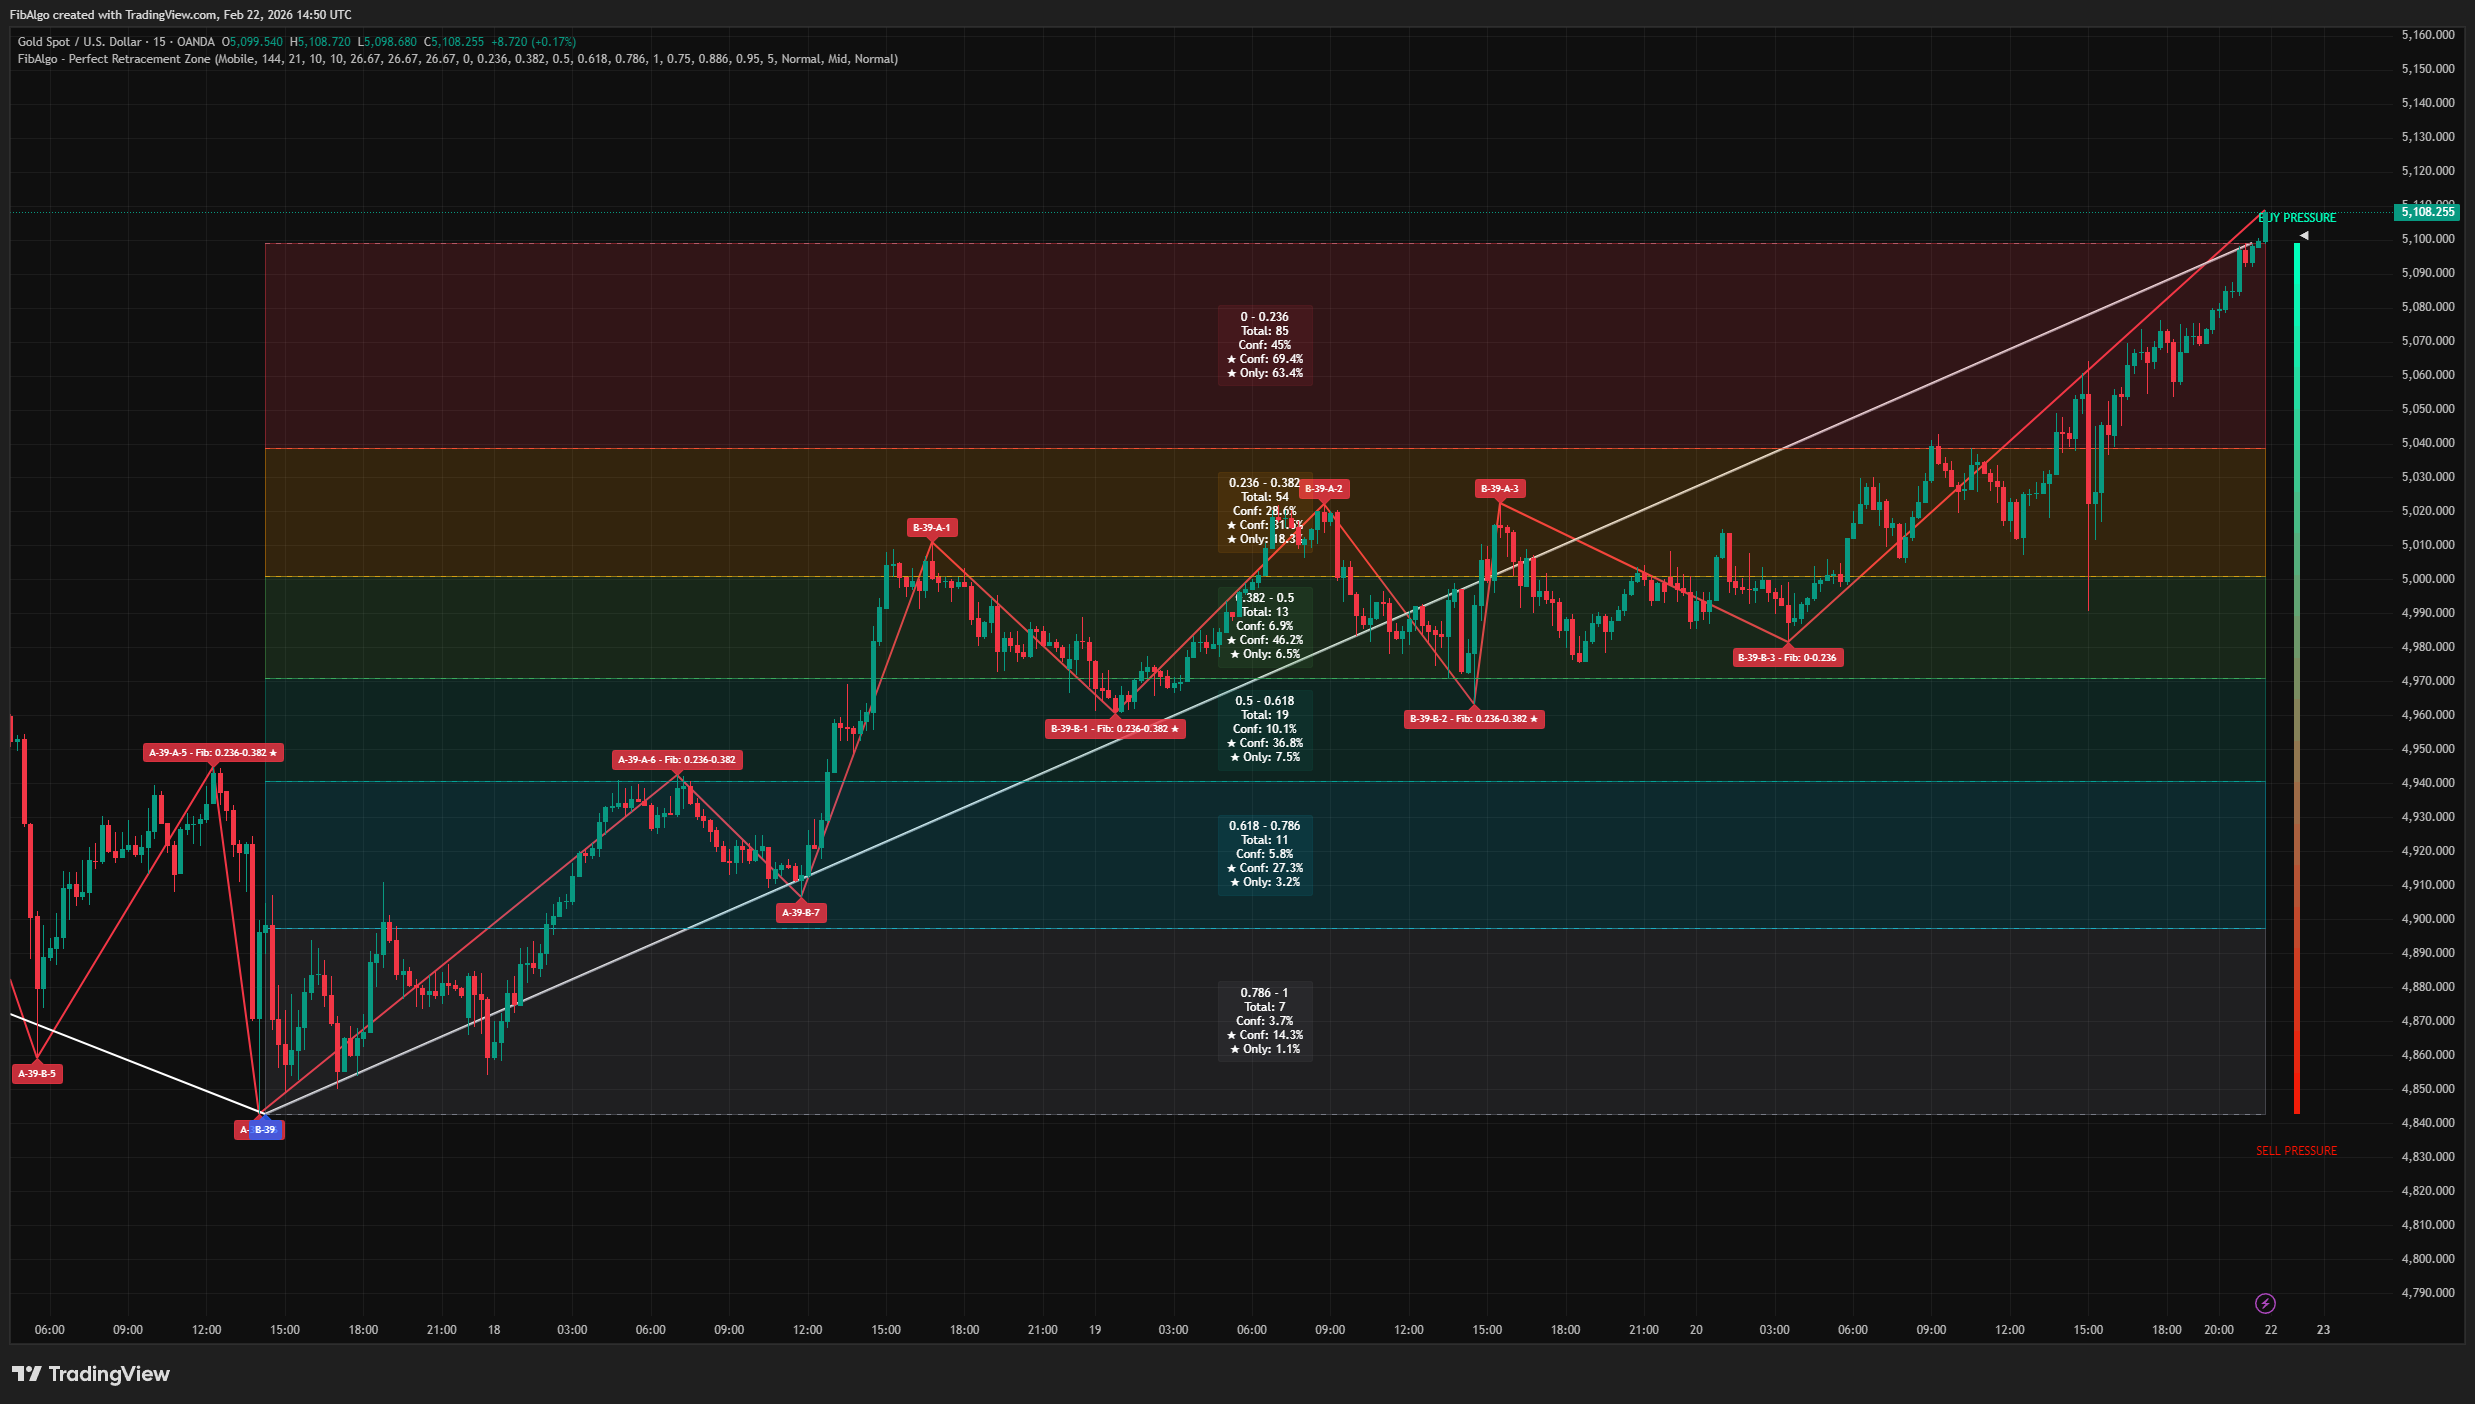
Dynamic Fibonacci retracement indicator for TradingView that identifies statistically significant support and resistance zones using pivot frequency analysis.
 Exclusive
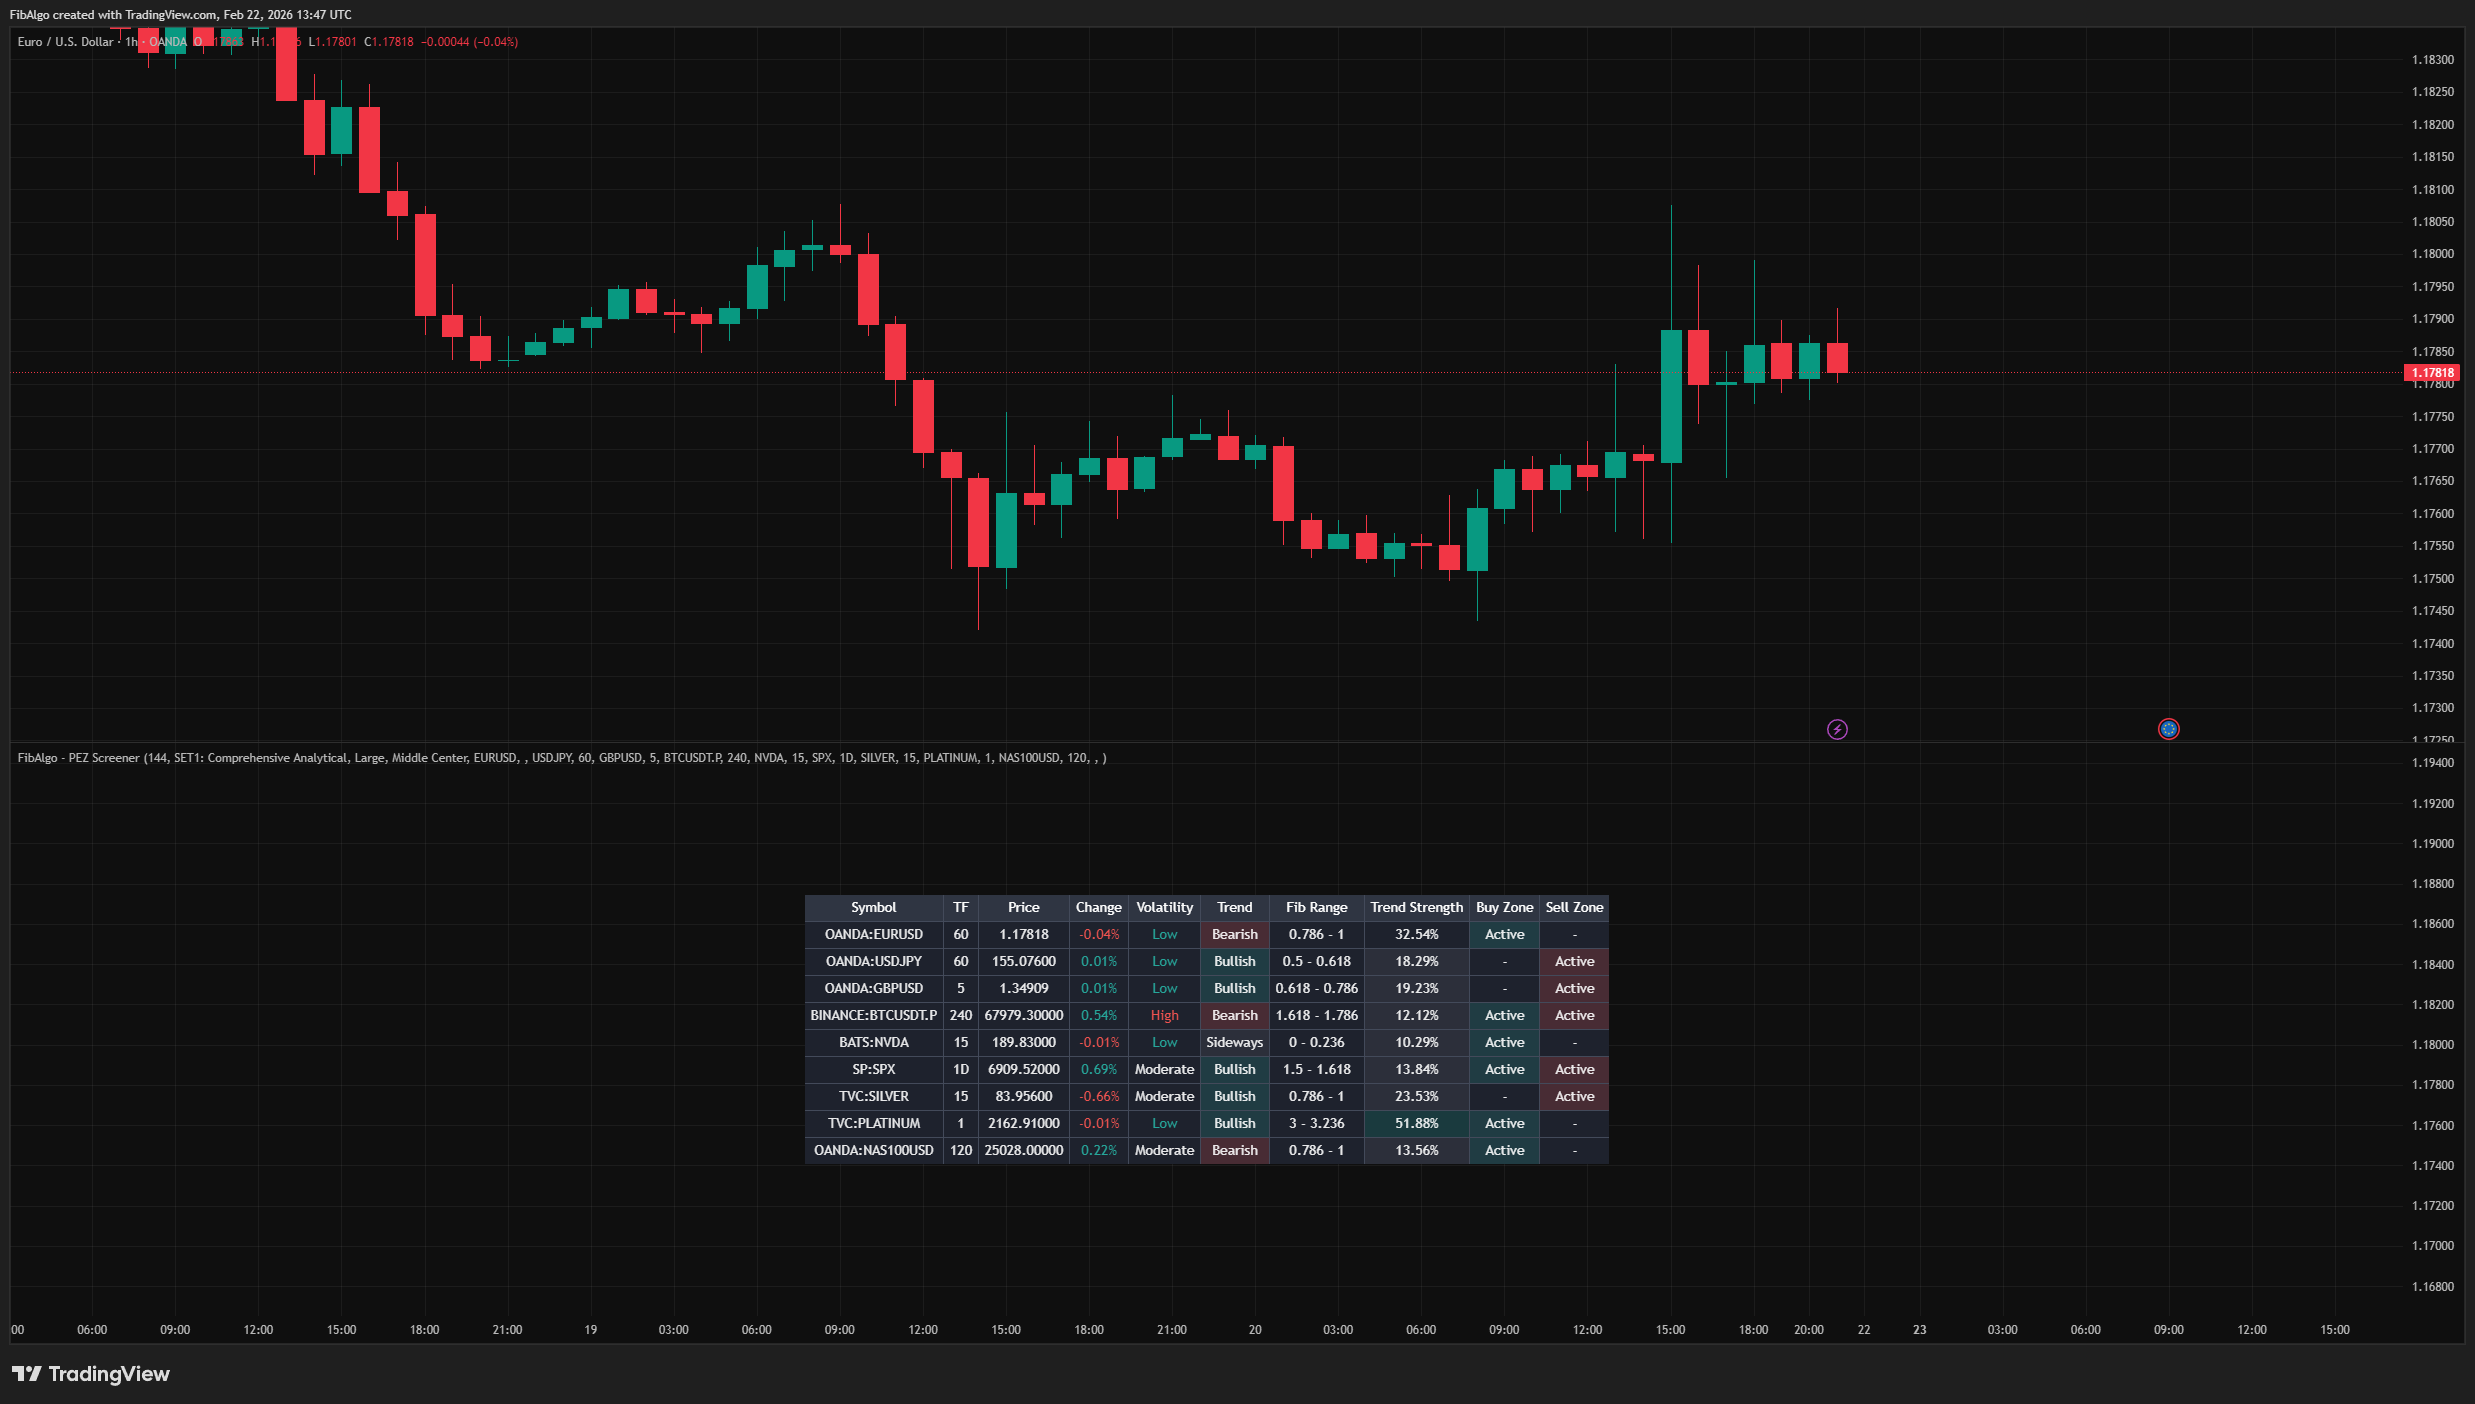
Multi-symbol TradingView screener that monitors up to 10 symbols simultaneously with Fibonacci range positions, trend direction, and zone status.
 Exclusive
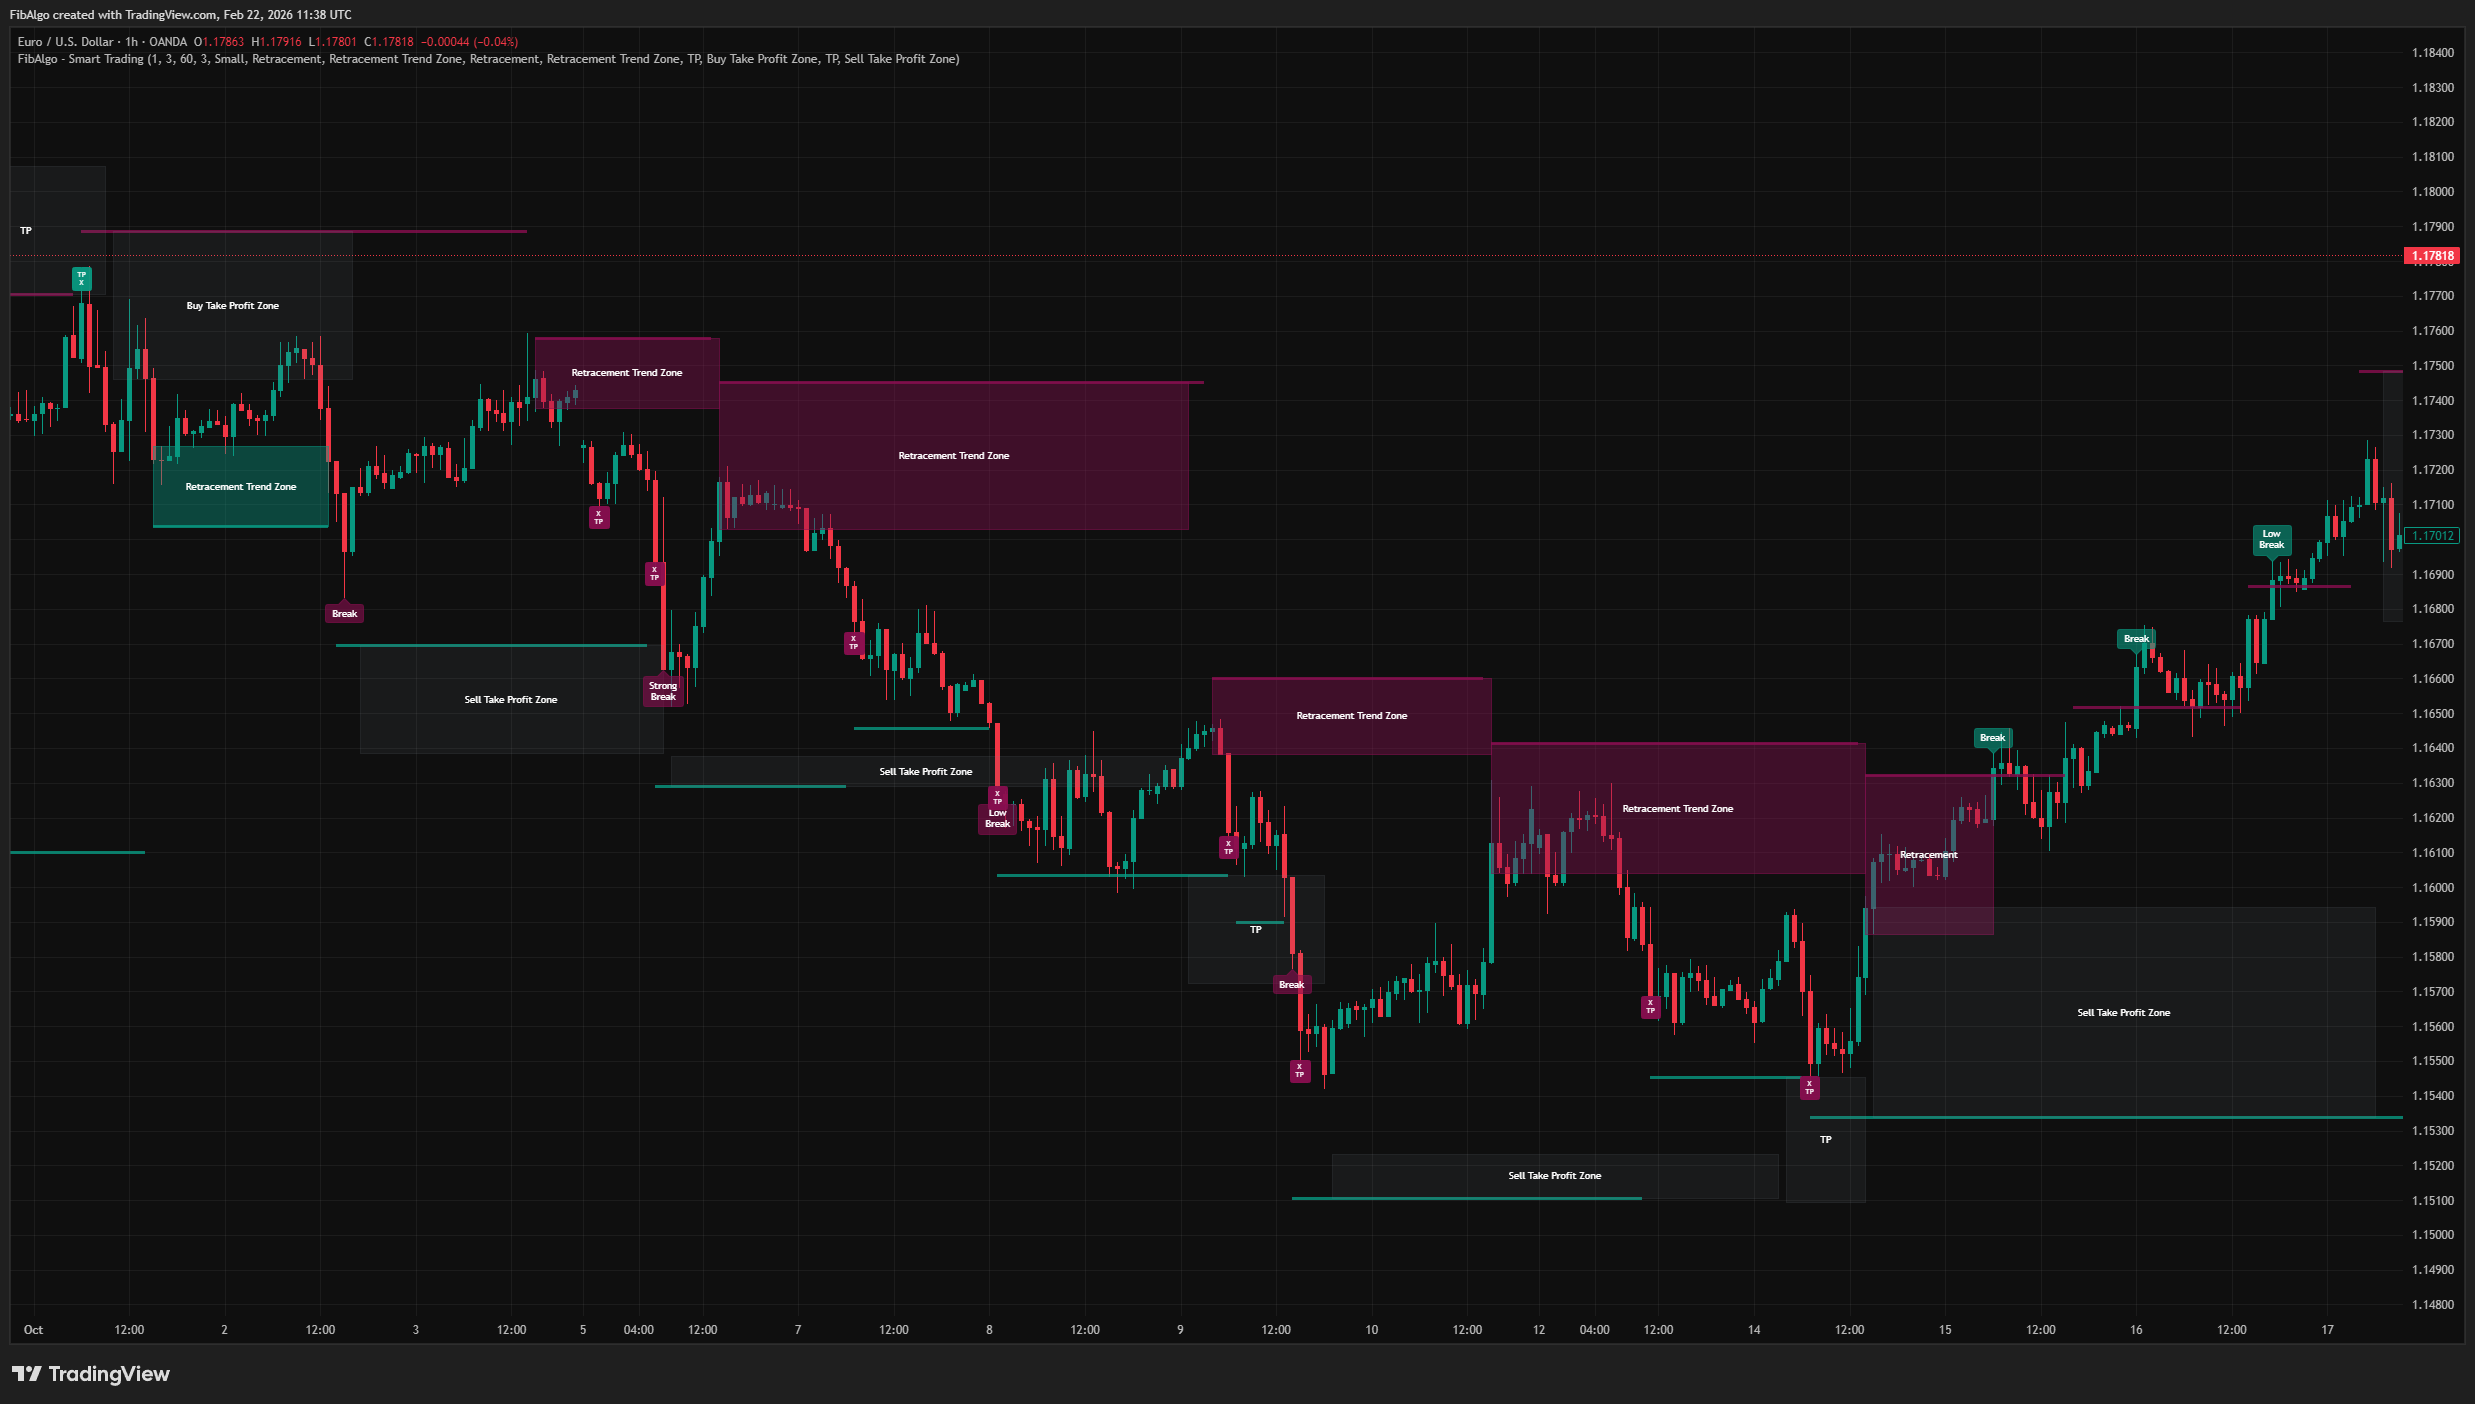
Volatility-adaptive trend analysis indicator for TradingView that identifies dynamic support and resistance levels with breakout classification and take-profit zones.
 Exclusive
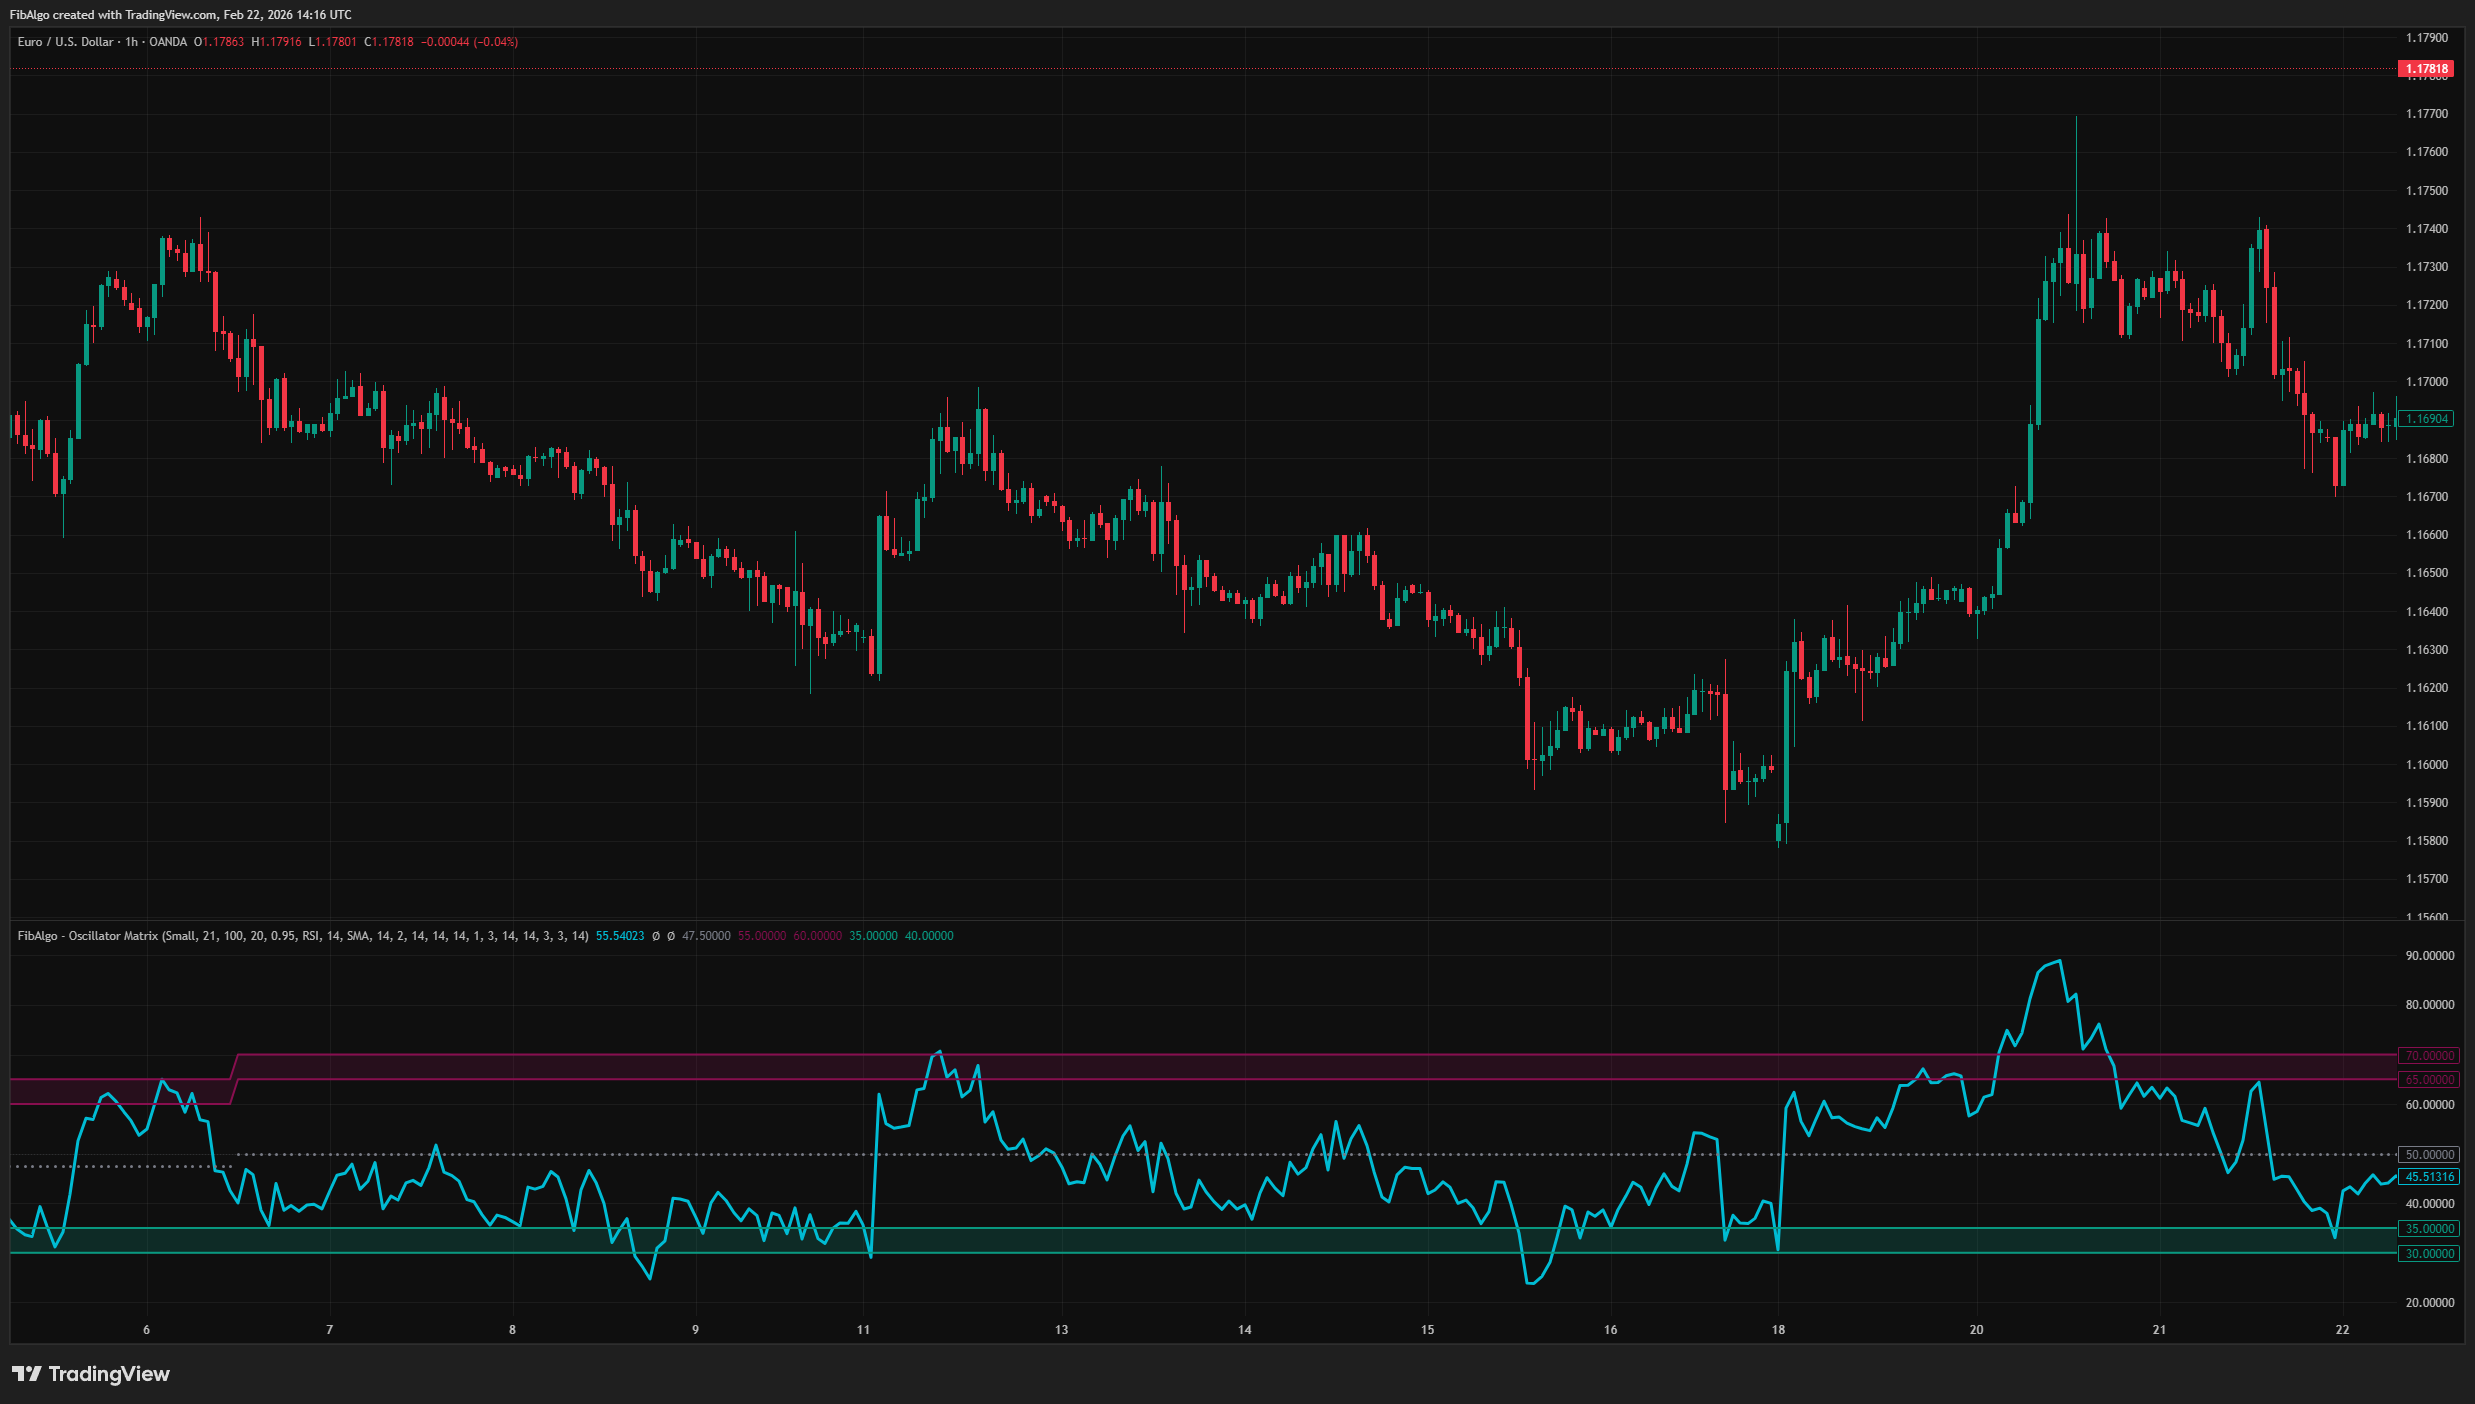
Statistical oscillator indicator for TradingView that identifies dynamic overbought and oversold zones based on actual pivot frequency distributions.
 Exclusive
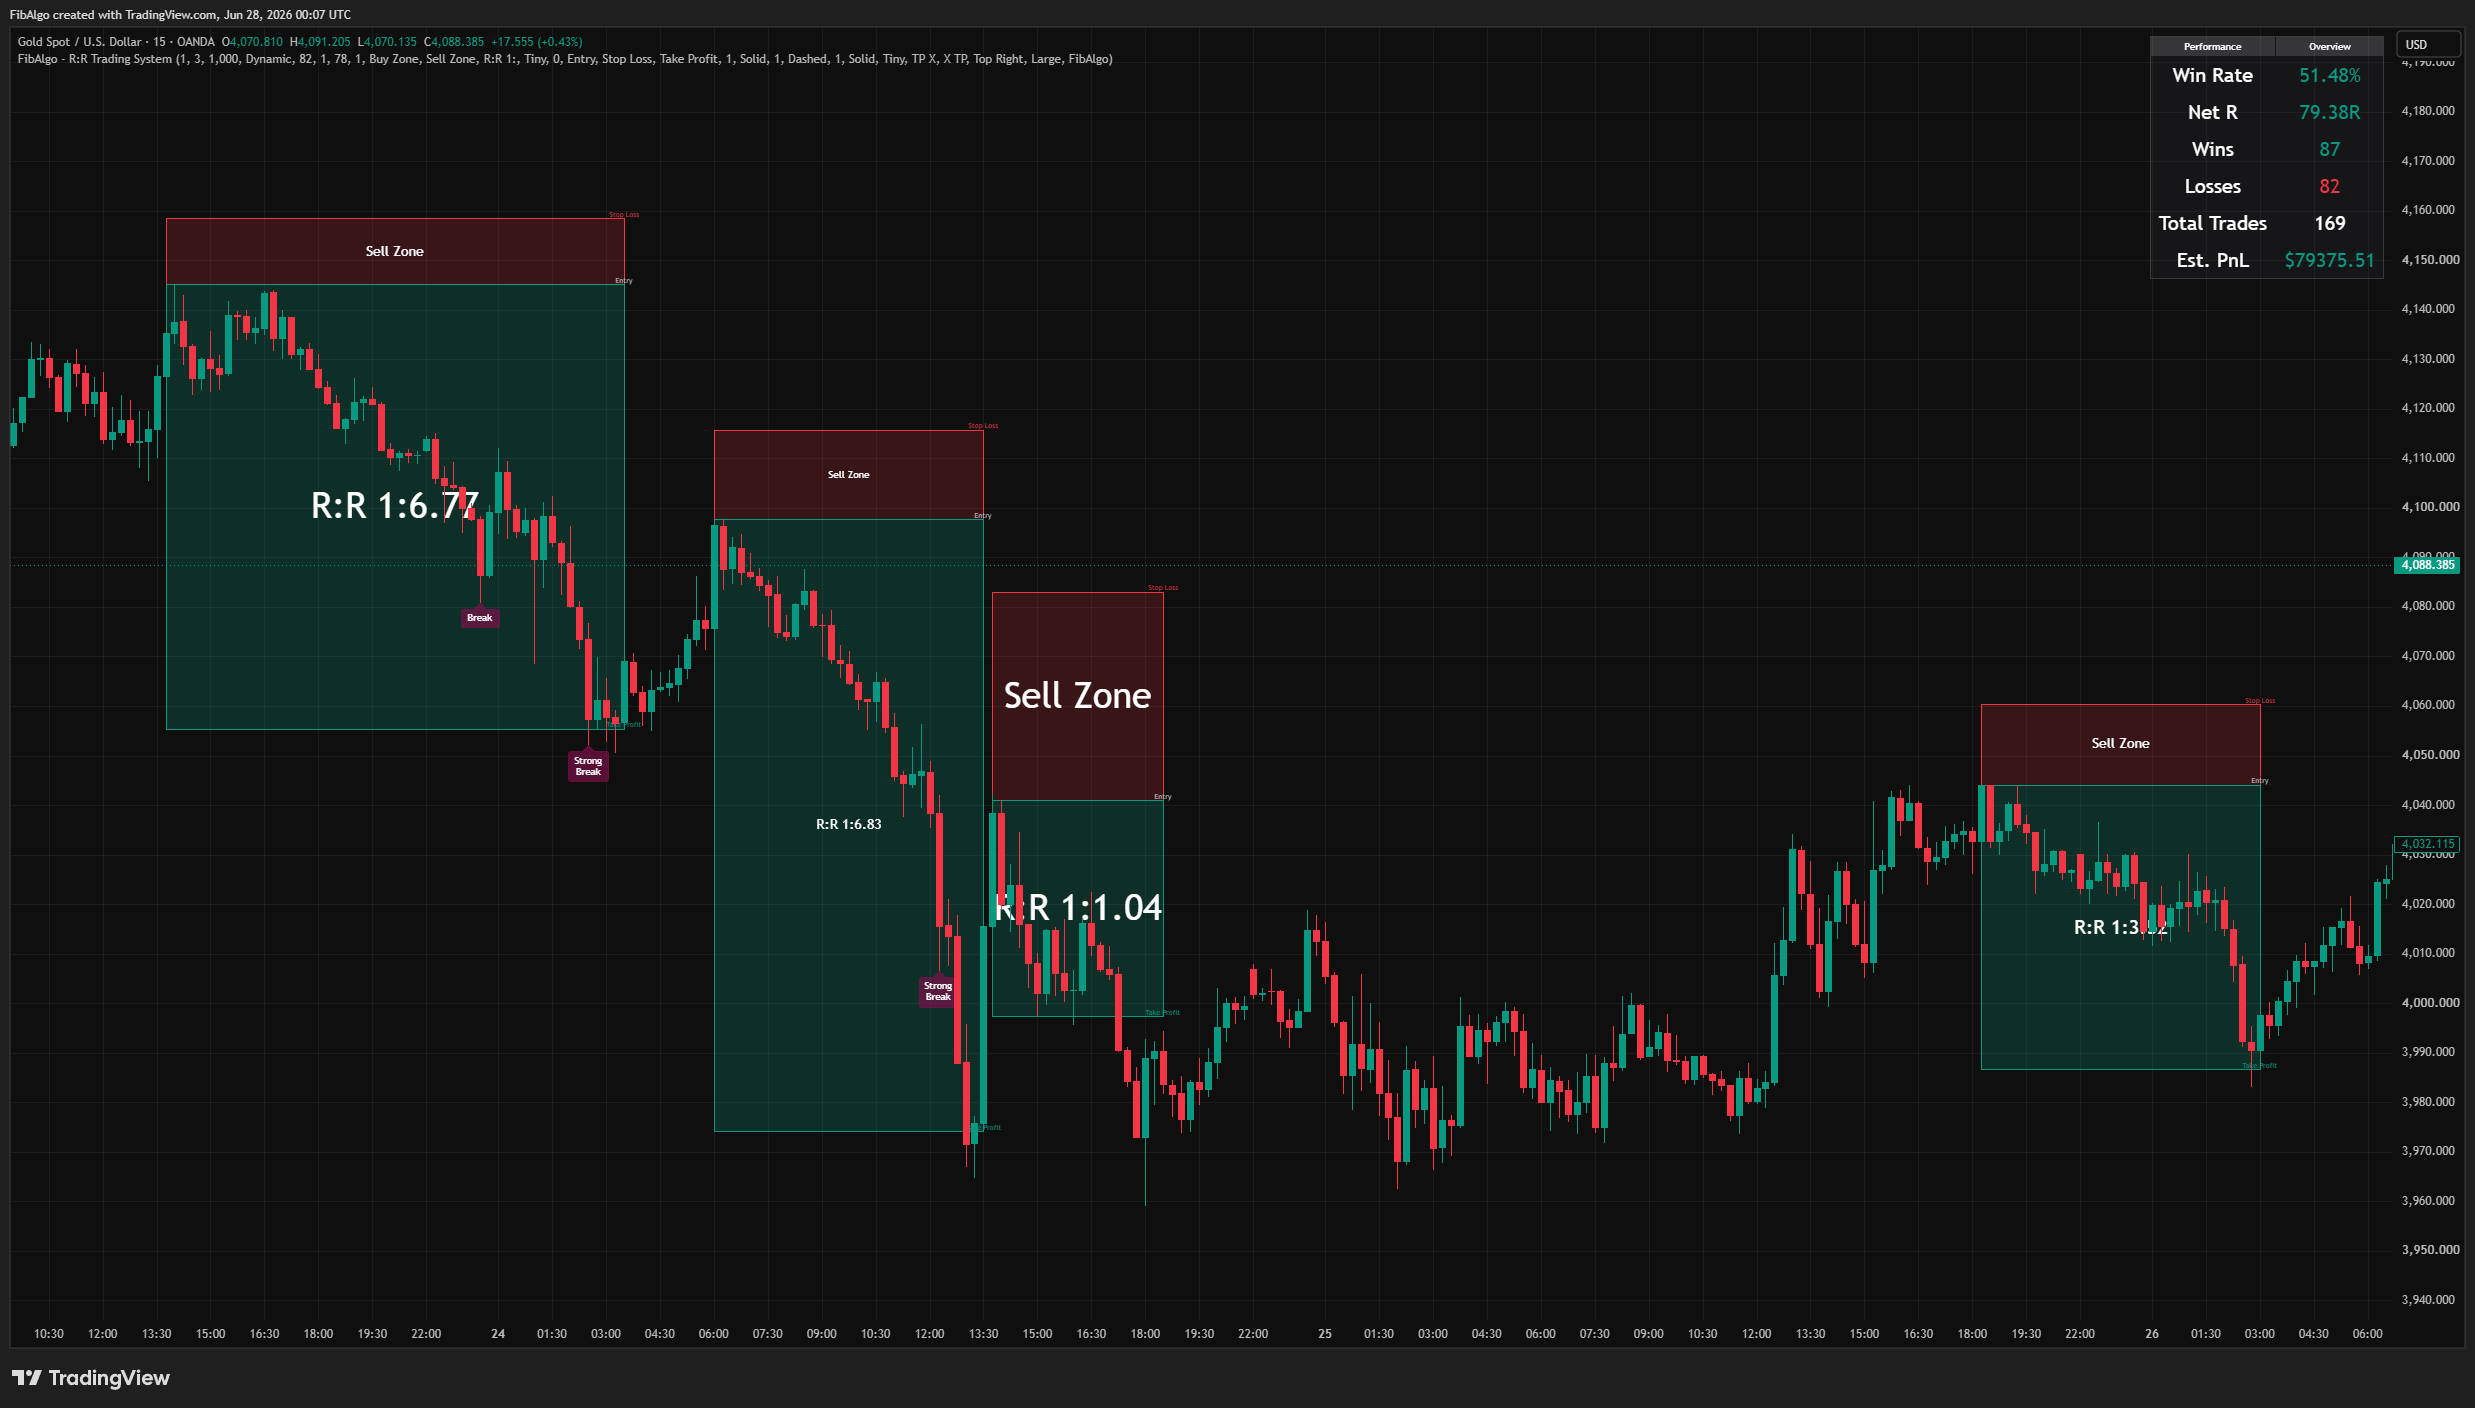
Volatility-adaptive support and resistance indicator for TradingView that classifies breakout strength, draws retracement entry zones, and auto-frames a complete risk-to-reward setup with live performance tracking.
 Free
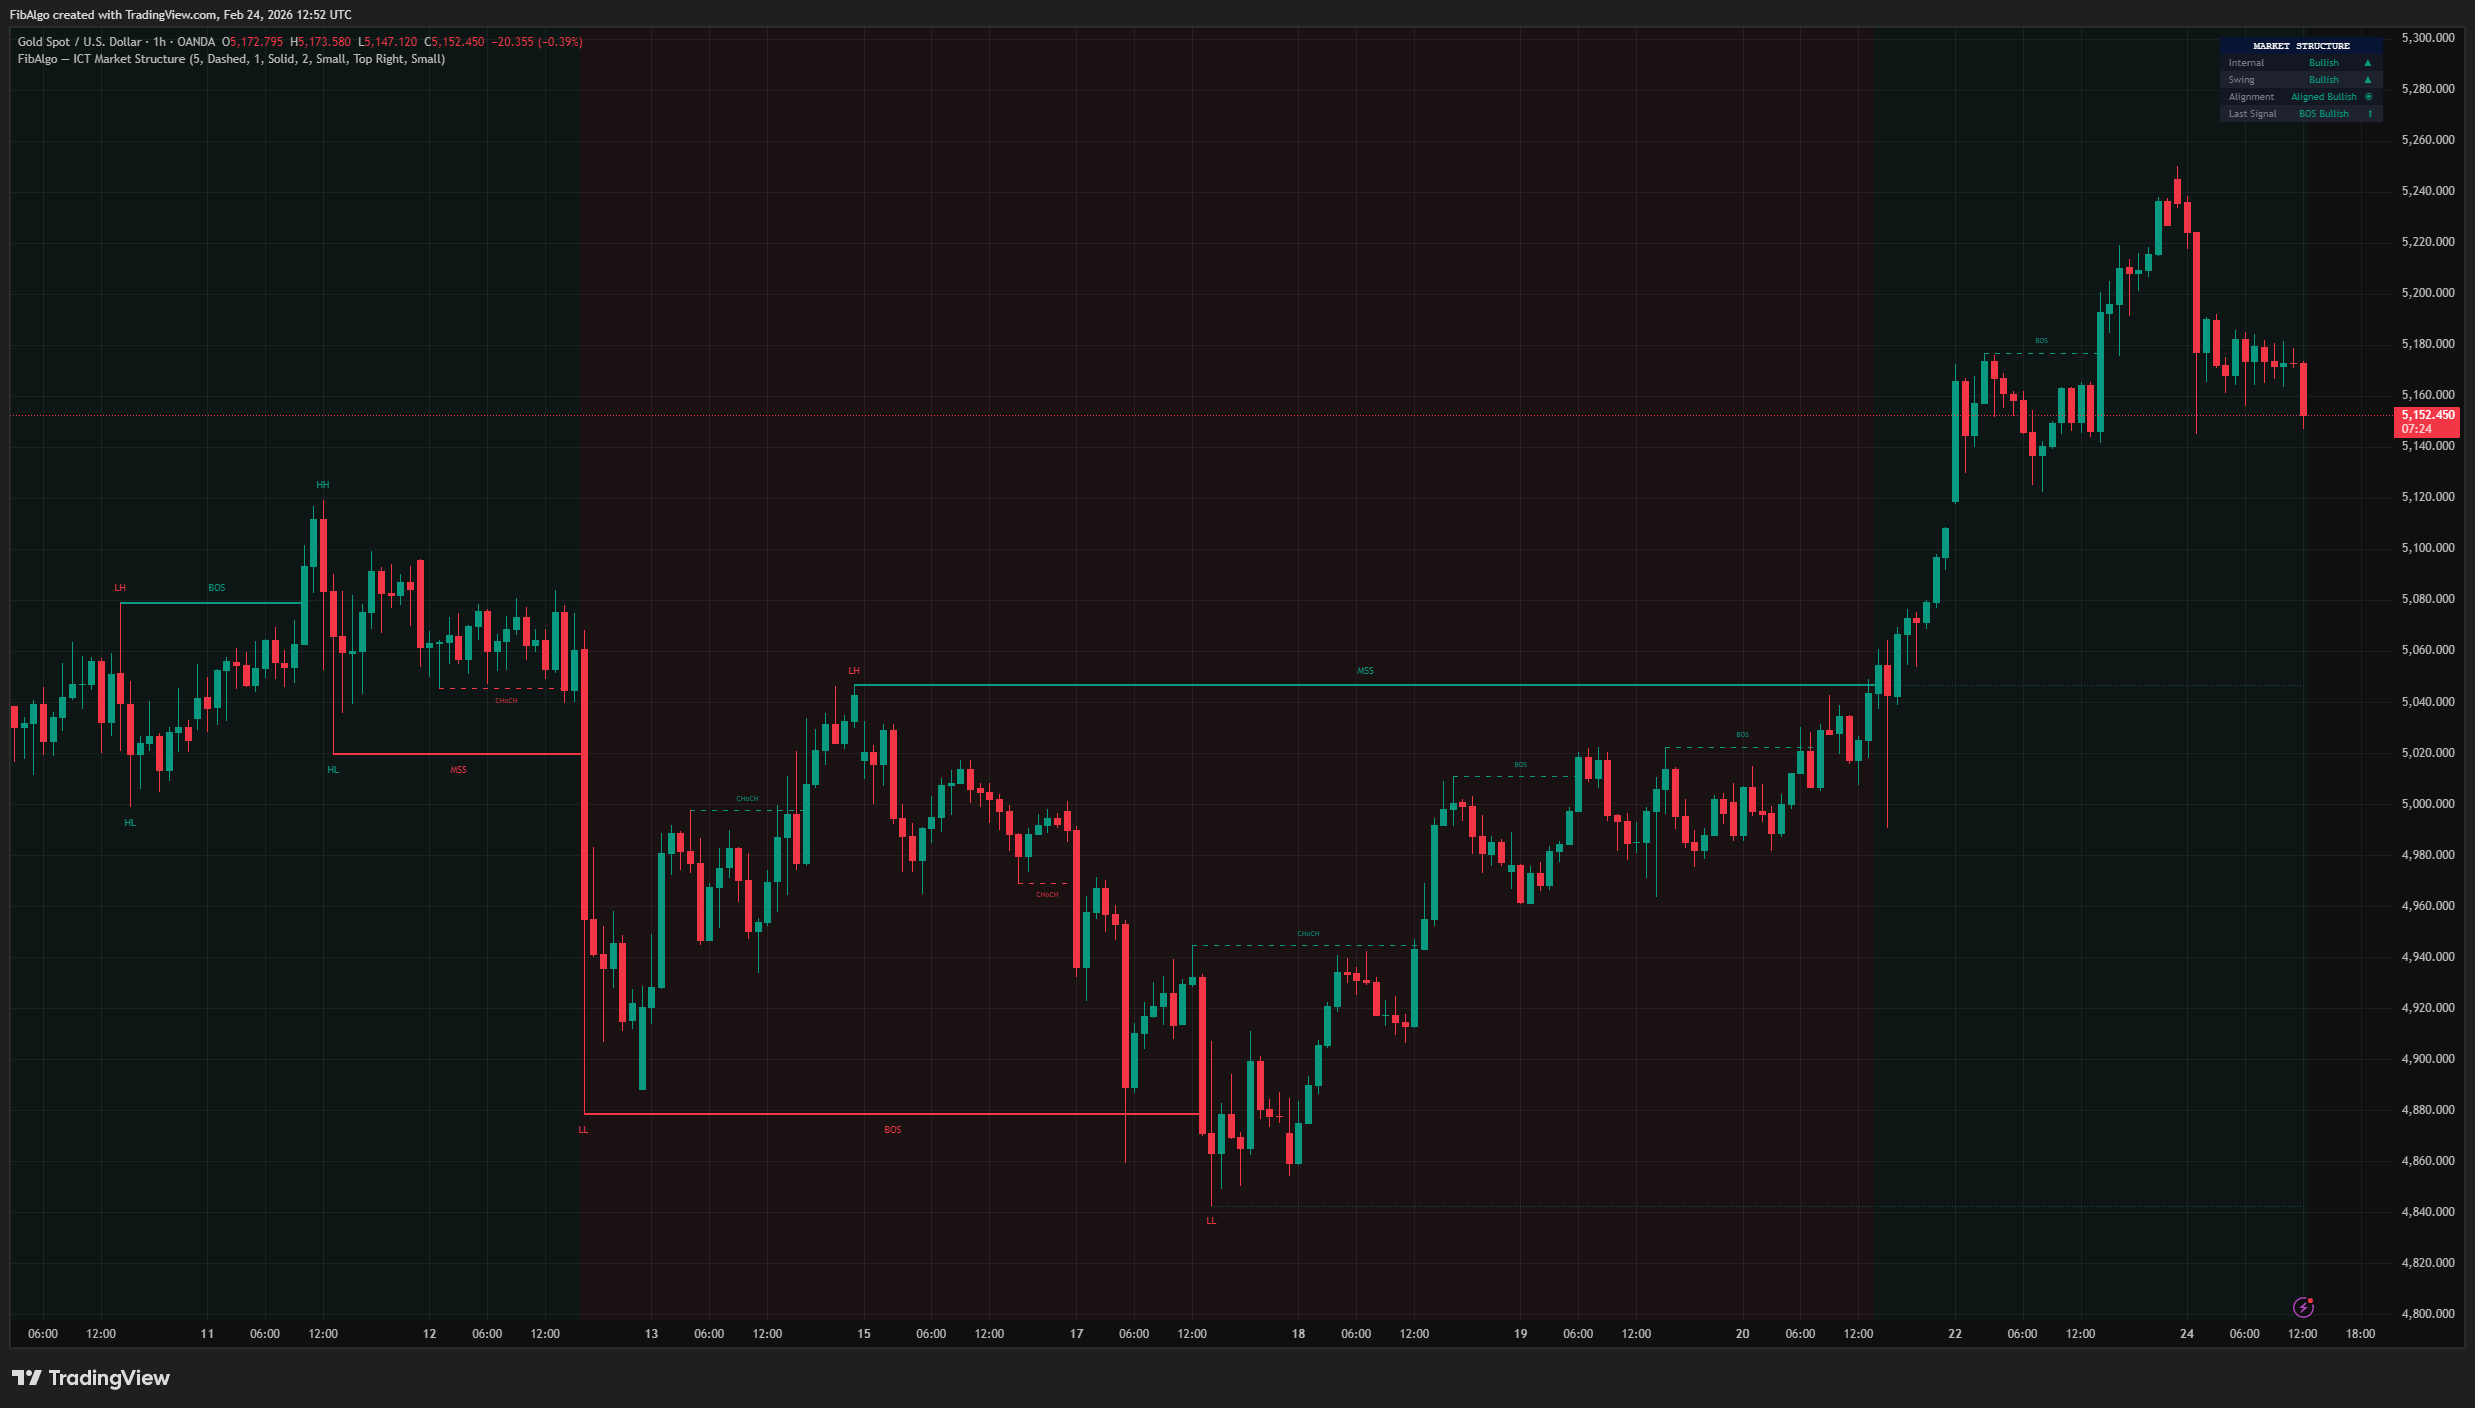
FreeTradingView indicator for ICT Market Structure — identifies Break of Structure (BOS), Change of Character (CHoCH), and Market Structure Shift (MSS).
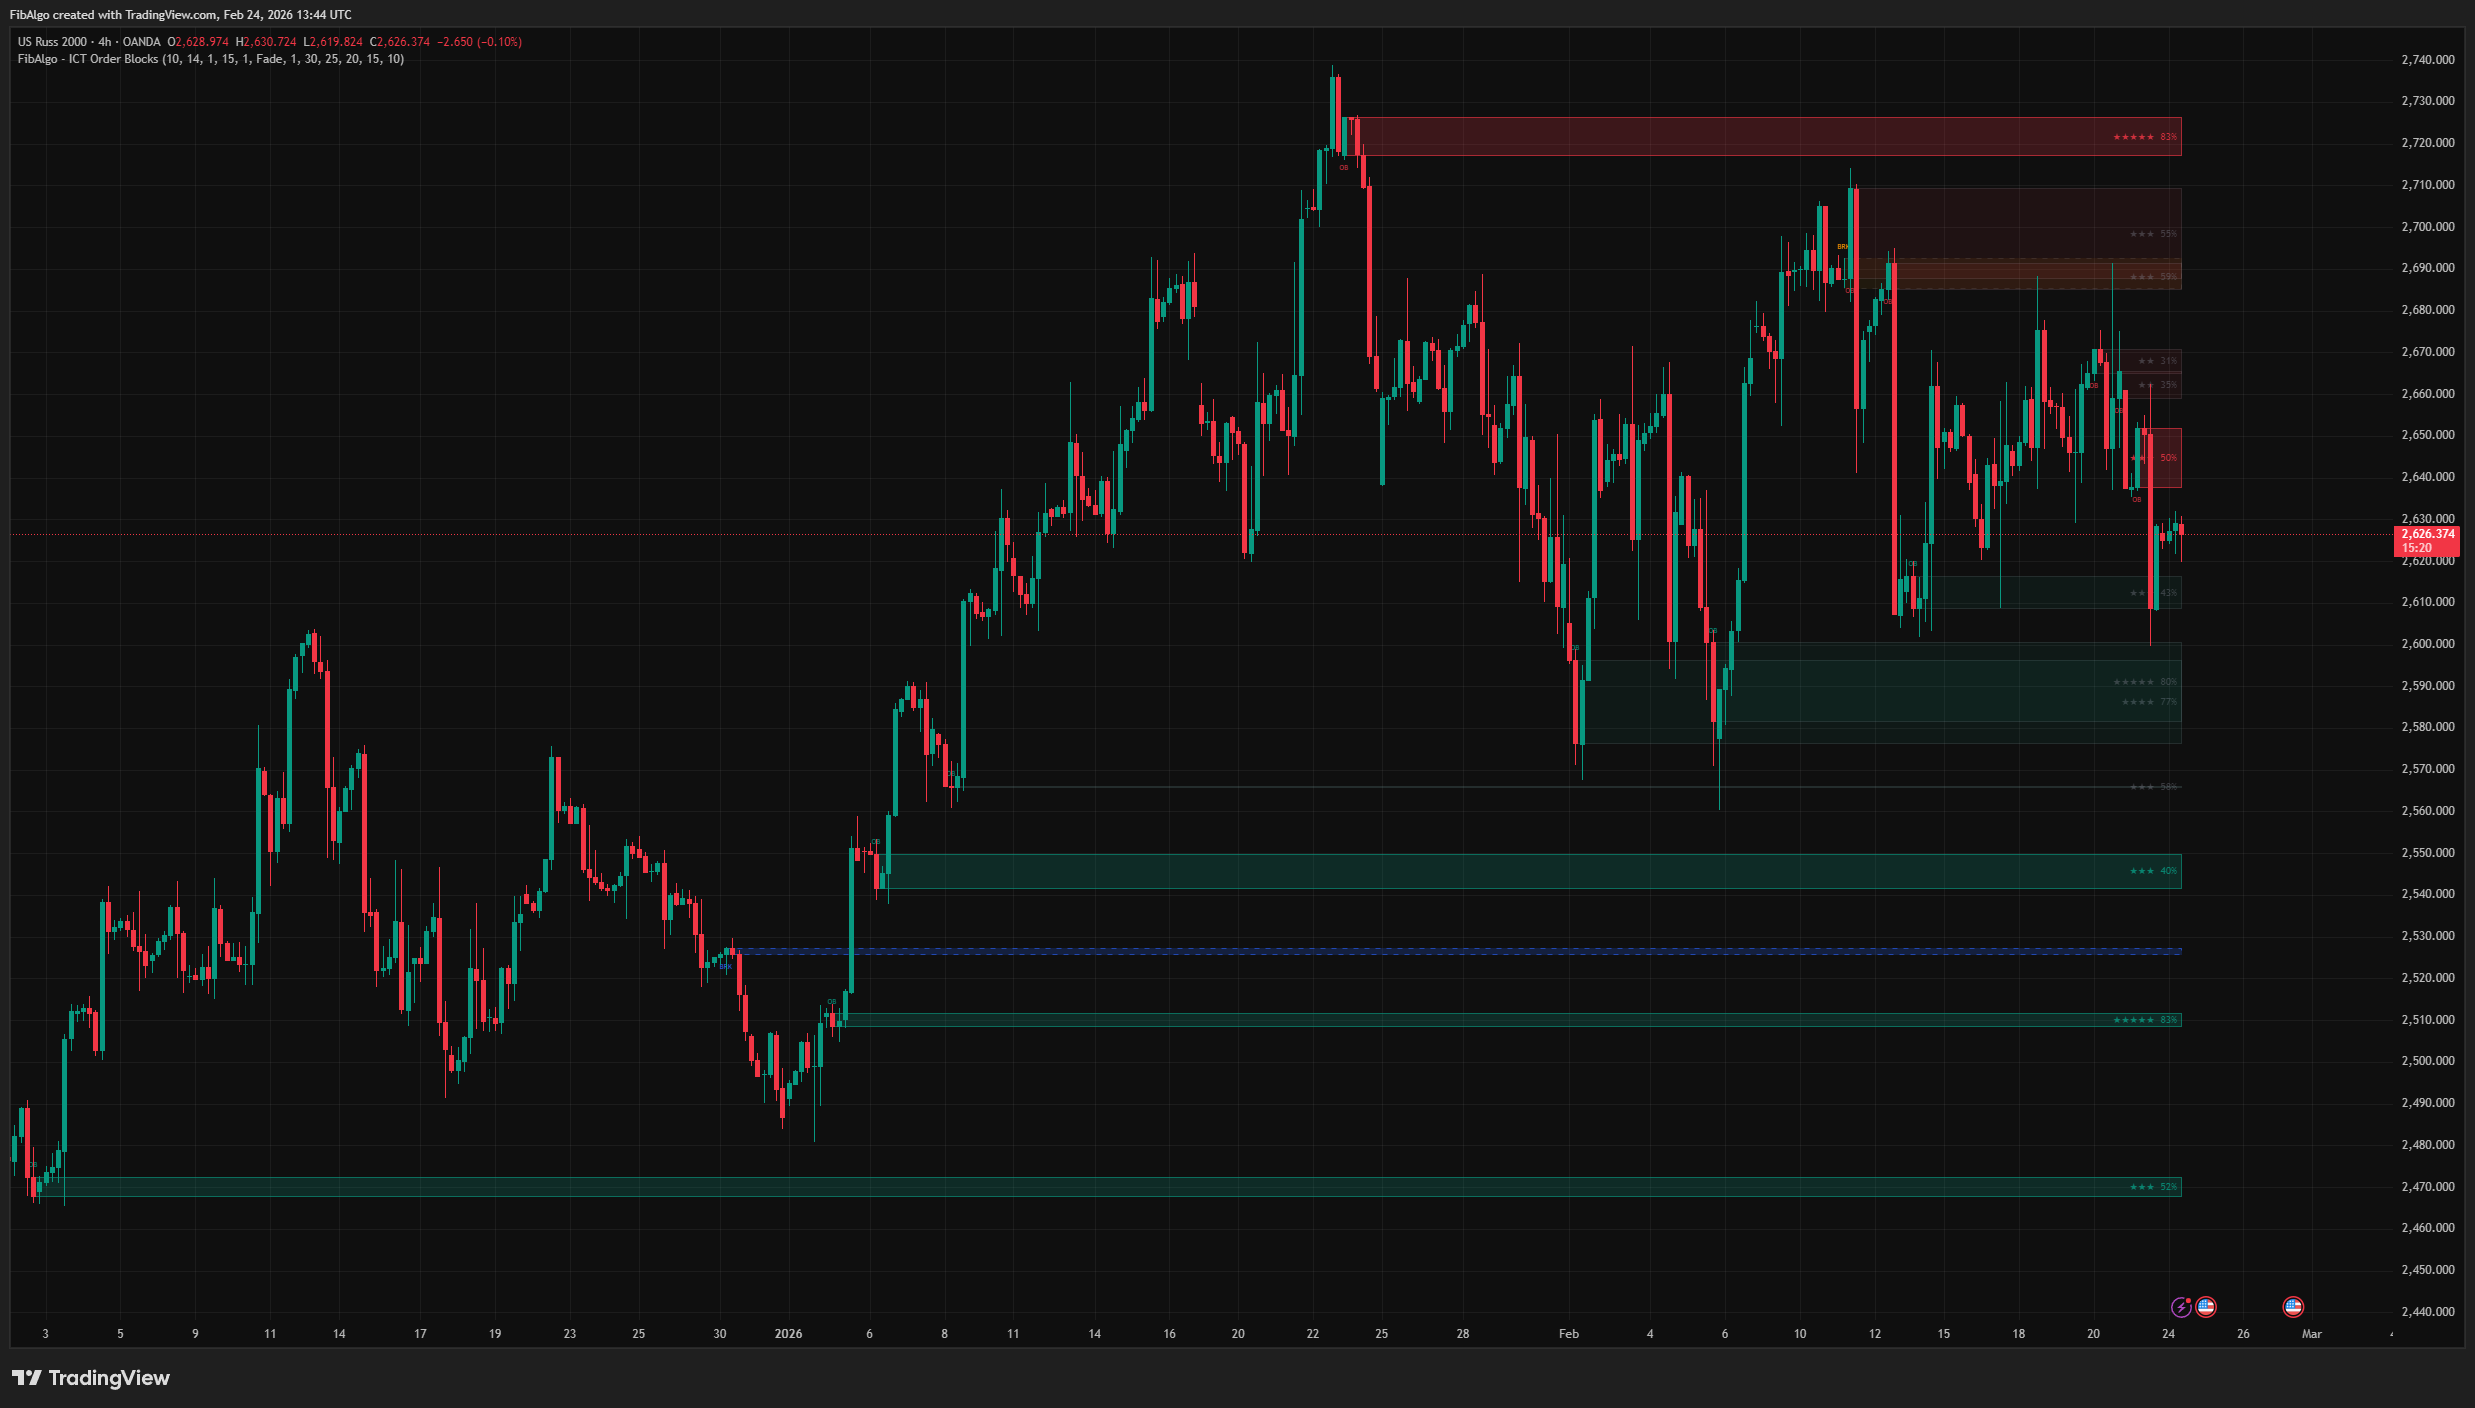 Free
FreeTradingView indicator that detects ICT Order Blocks, converts invalidated zones into Breaker Blocks, and provides institutional Strength Rating analysis.
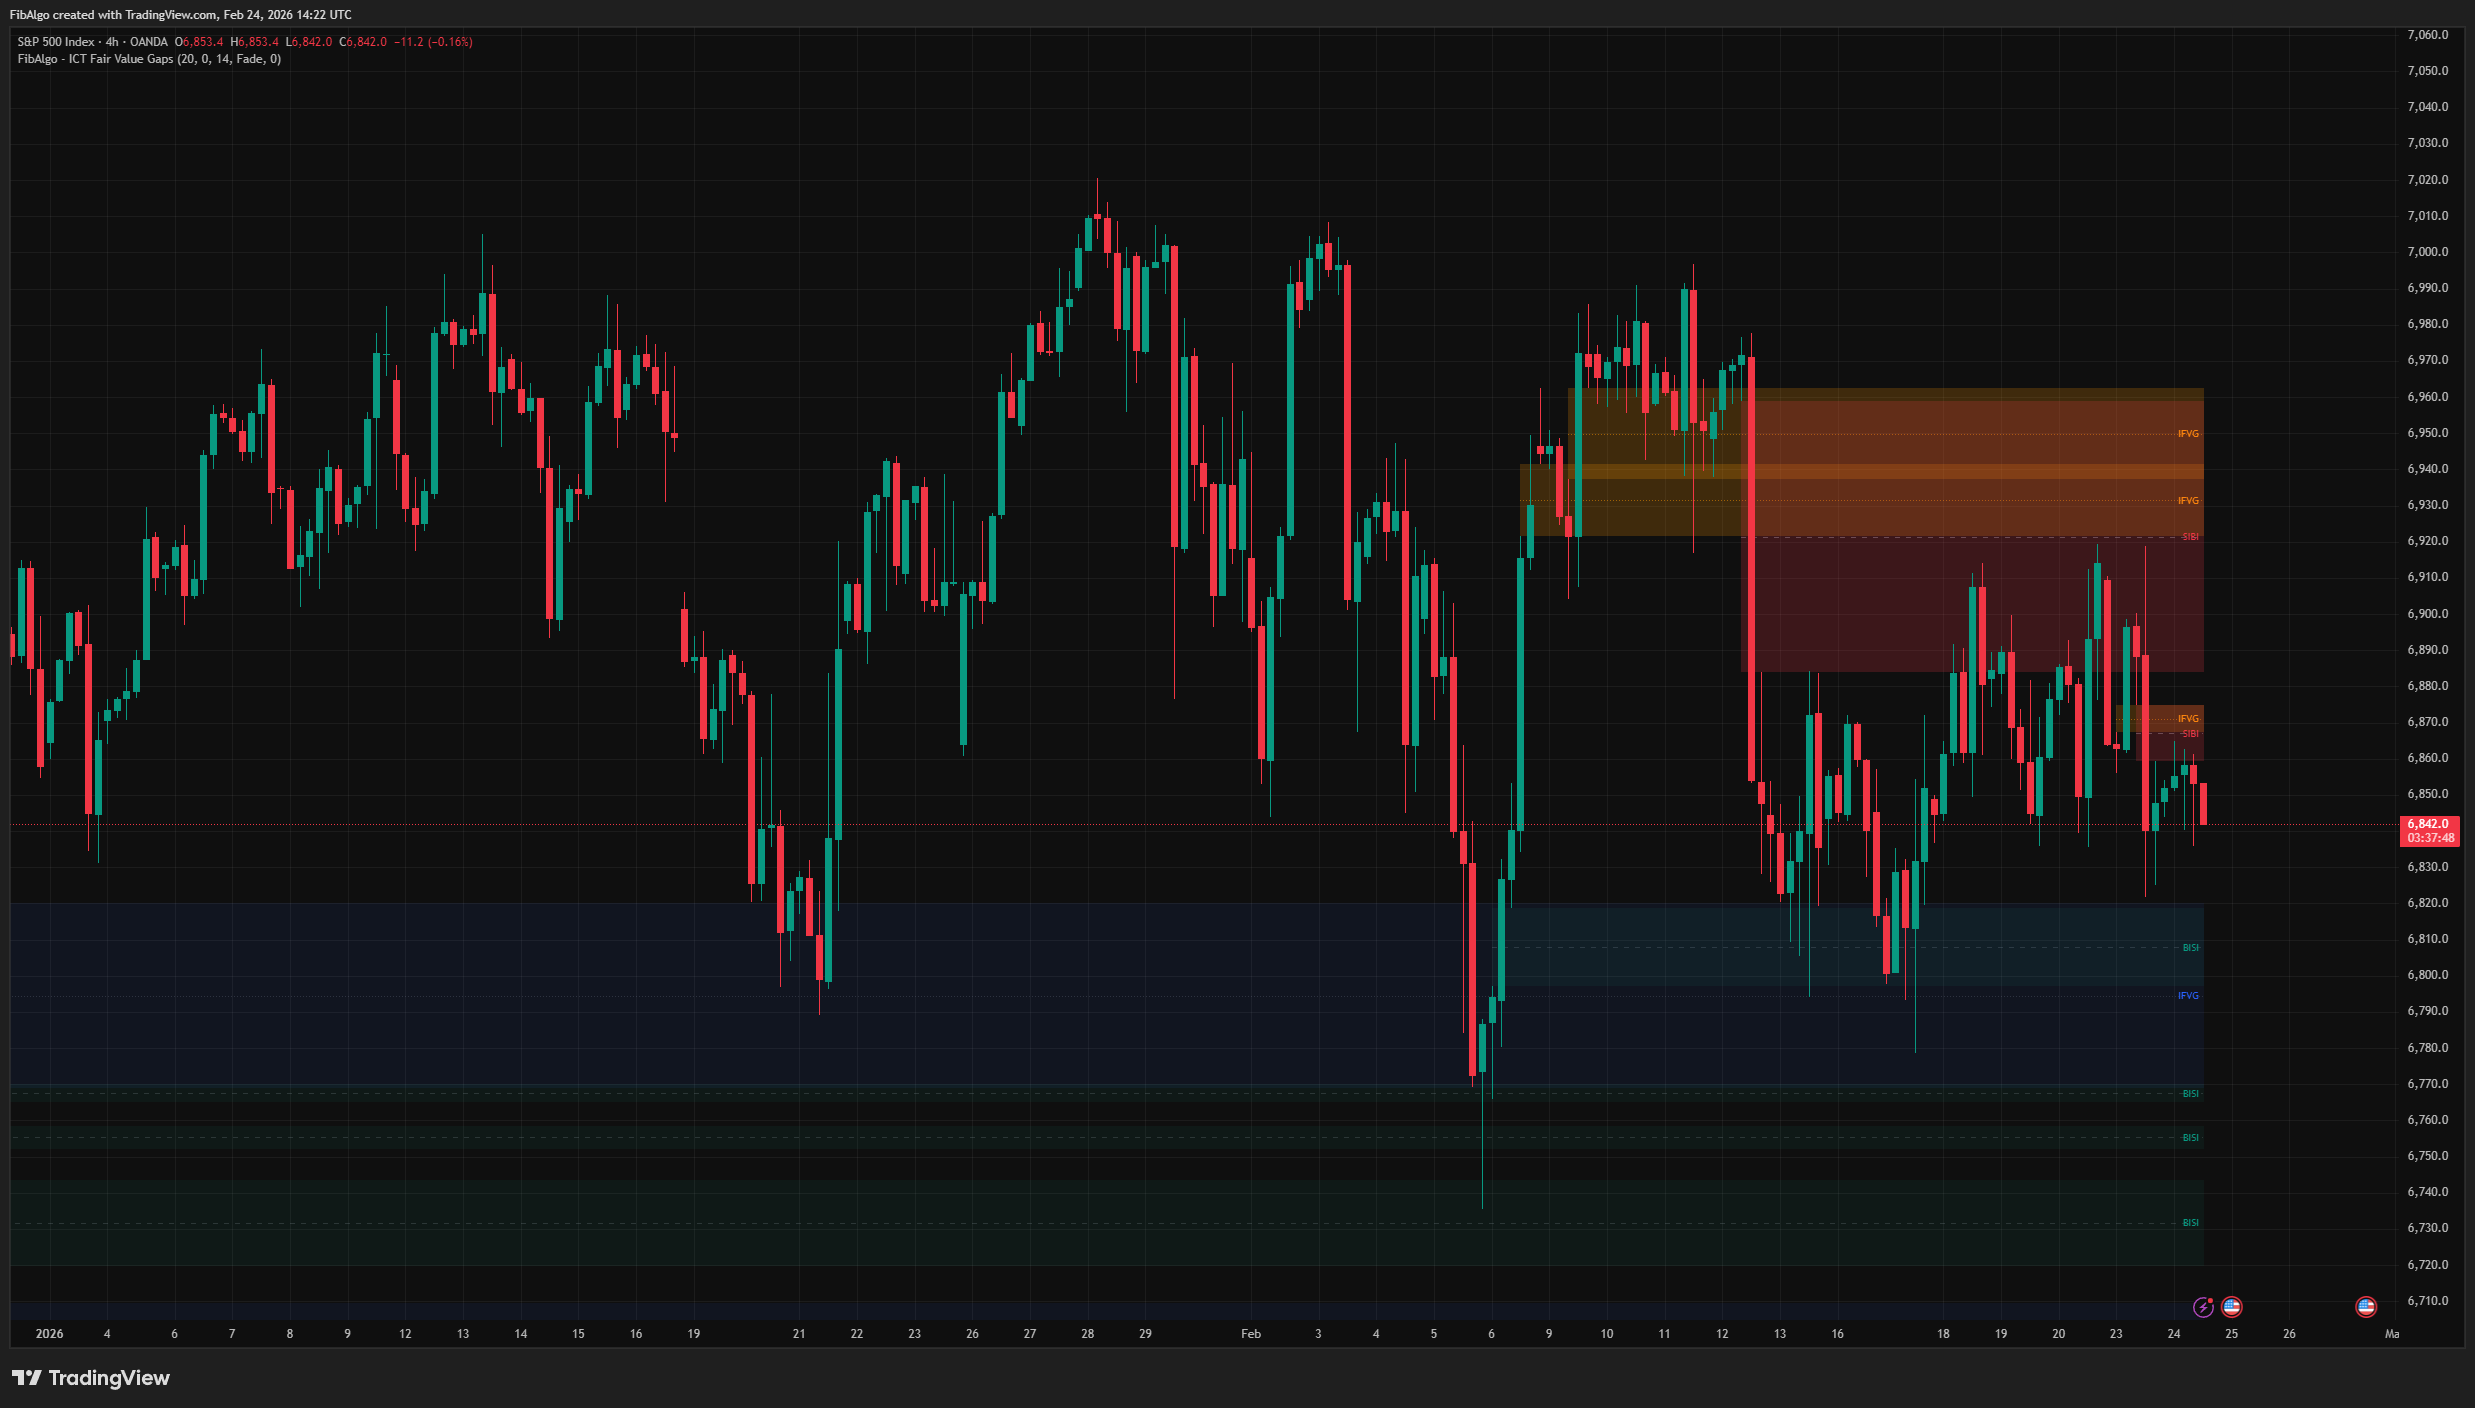 Free
FreeTradingView indicator that detects ICT Fair Value Gaps (BISI/SIBI), draws CE midlines, identifies Inversion FVGs, and maps Balanced Price Range zones.
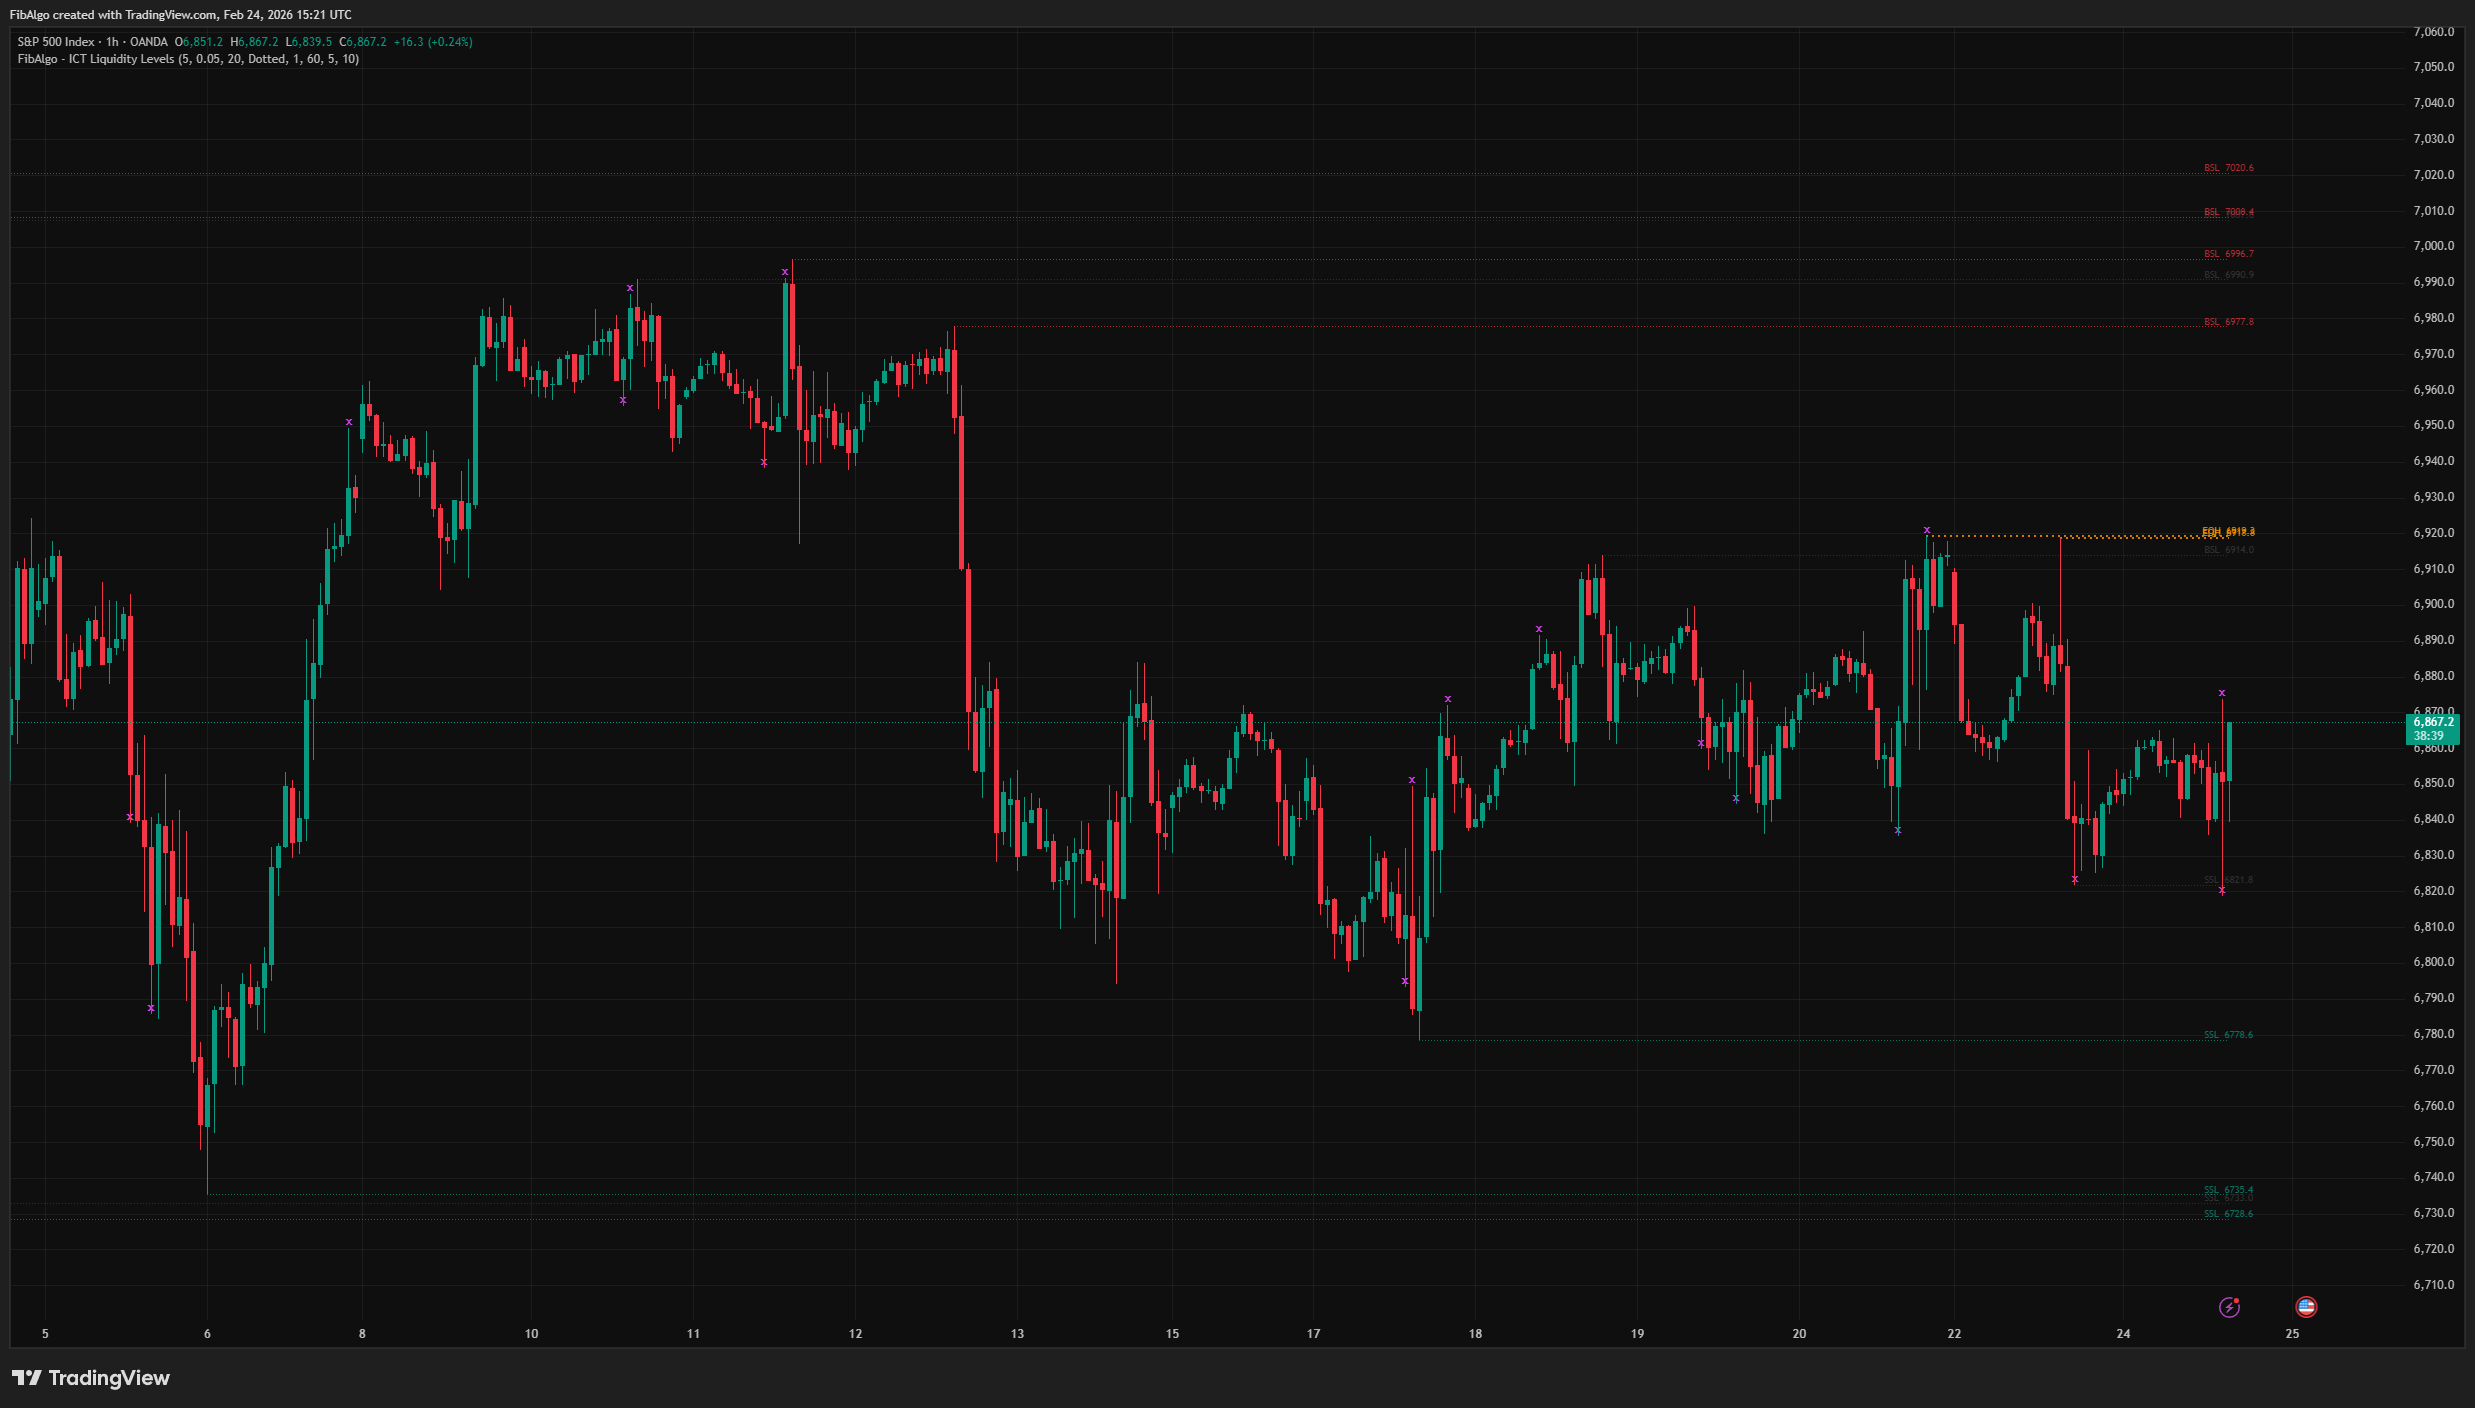 Free
FreeTradingView indicator that maps ICT Liquidity Levels — Buy Side (BSL), Sell Side (SSL), Equal Highs/Lows, and Liquidity Sweeps with HTF support.
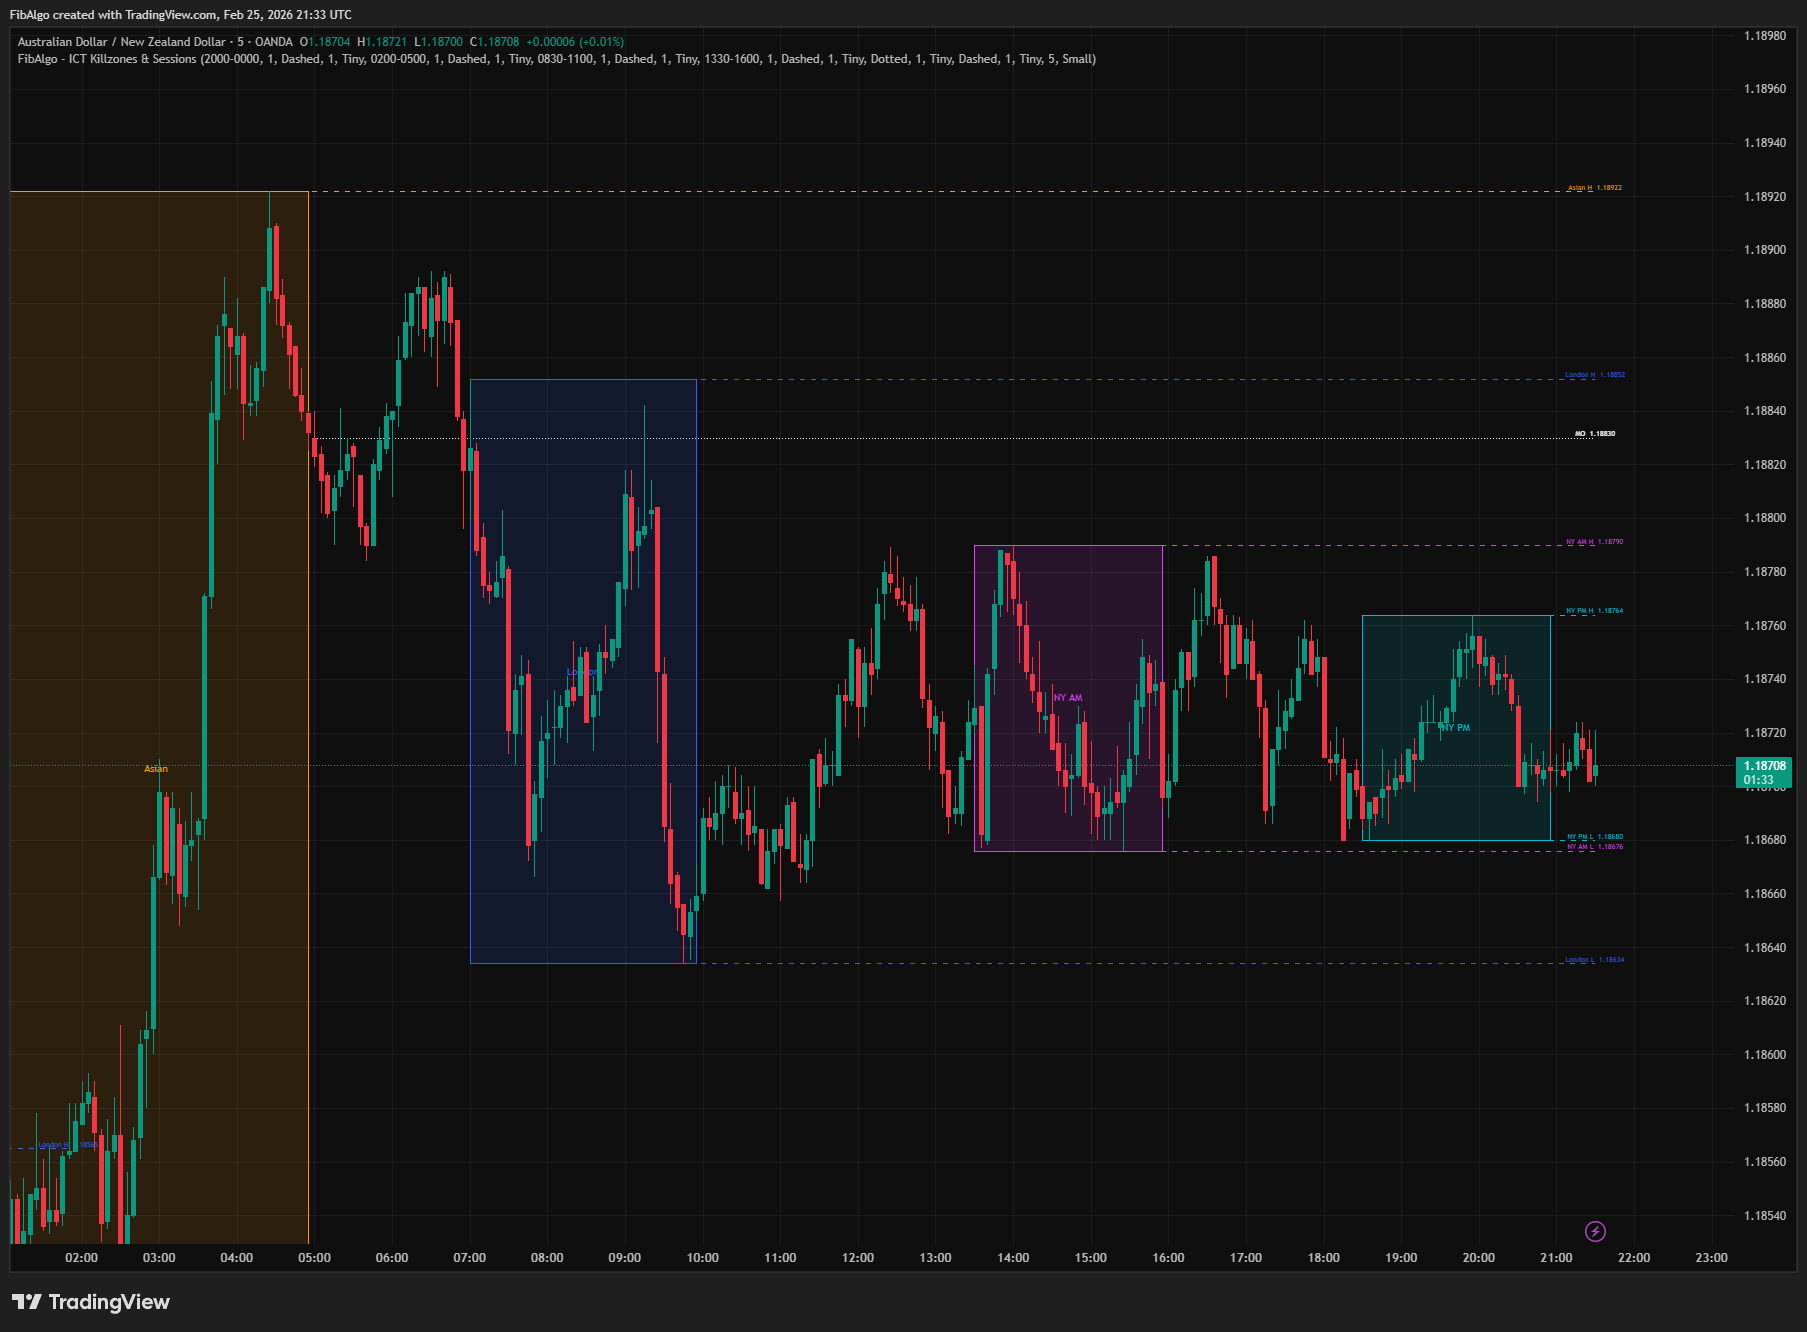 Free
FreeTradingView indicator that highlights ICT Killzones — Asian, London, NY AM, and NY PM session boxes with high/low extensions and key opening levels.
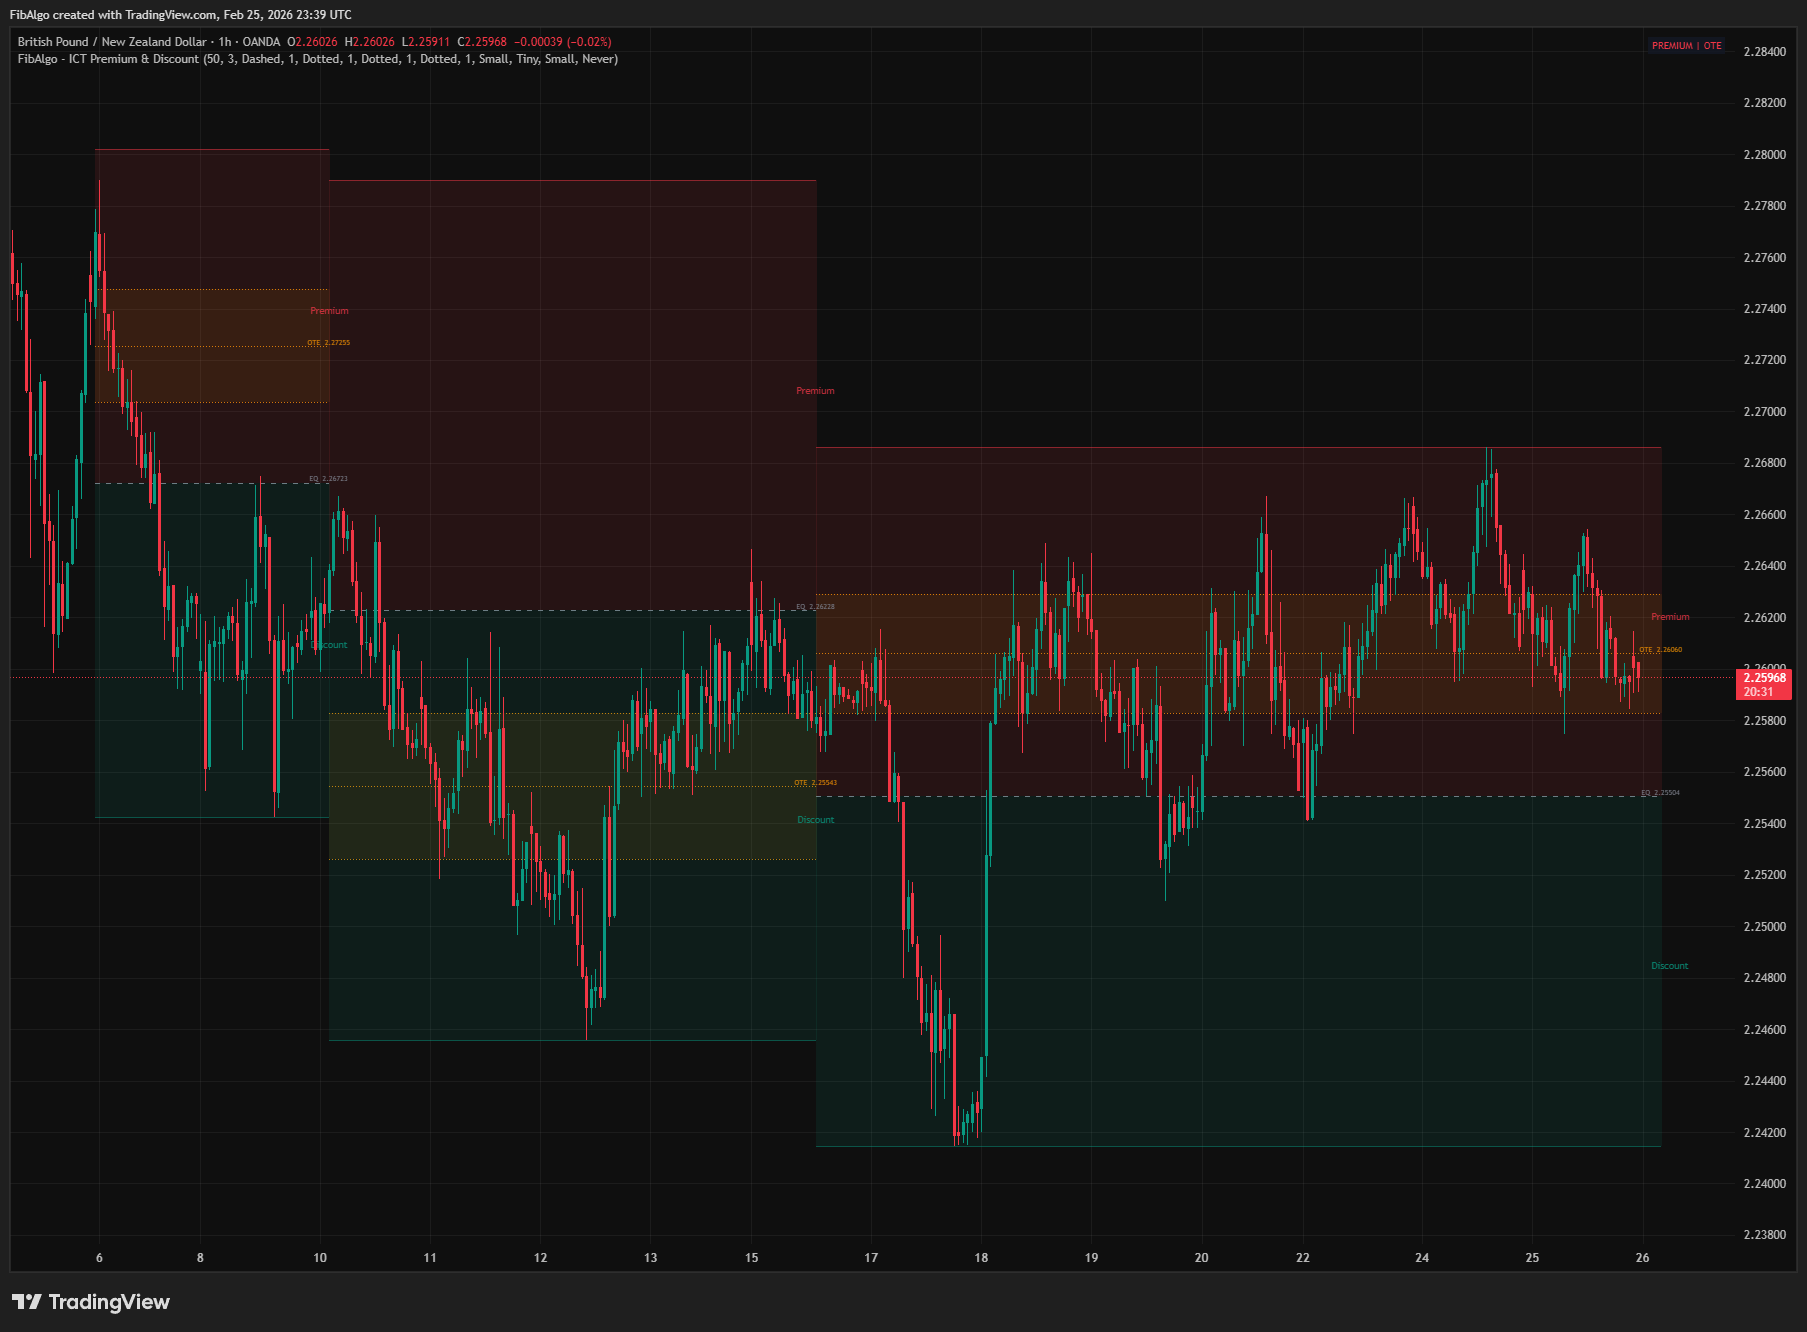 Free
FreeTradingView indicator that detects ICT Premium and Discount zones in real-time using zigzag analysis with Equilibrium and OTE retracement highlights.
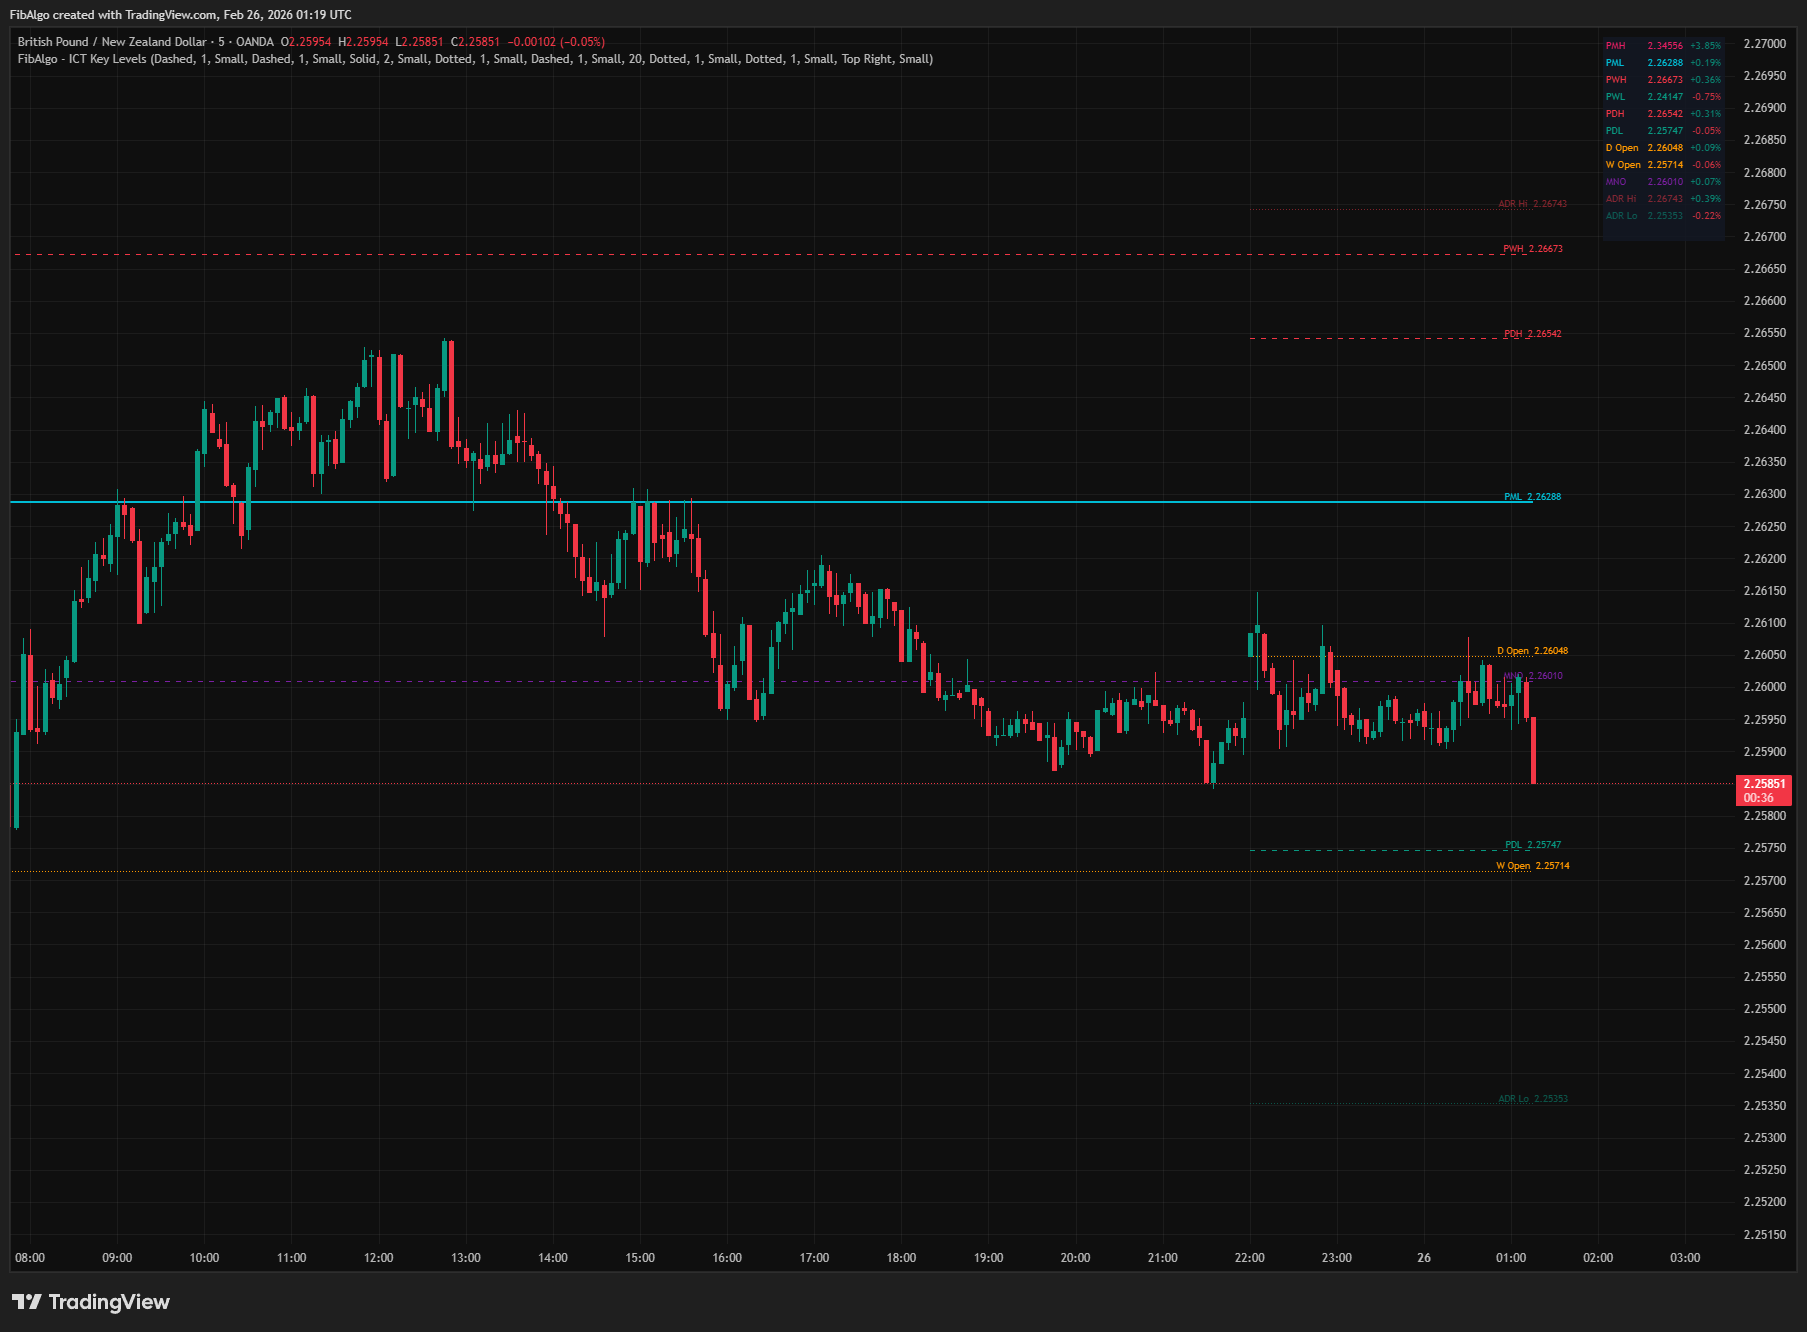 Free
FreeTradingView indicator that draws ICT institutional reference levels — Previous Day/Week/Month High/Low, Daily Opens, Midnight Open, and ADR projections.
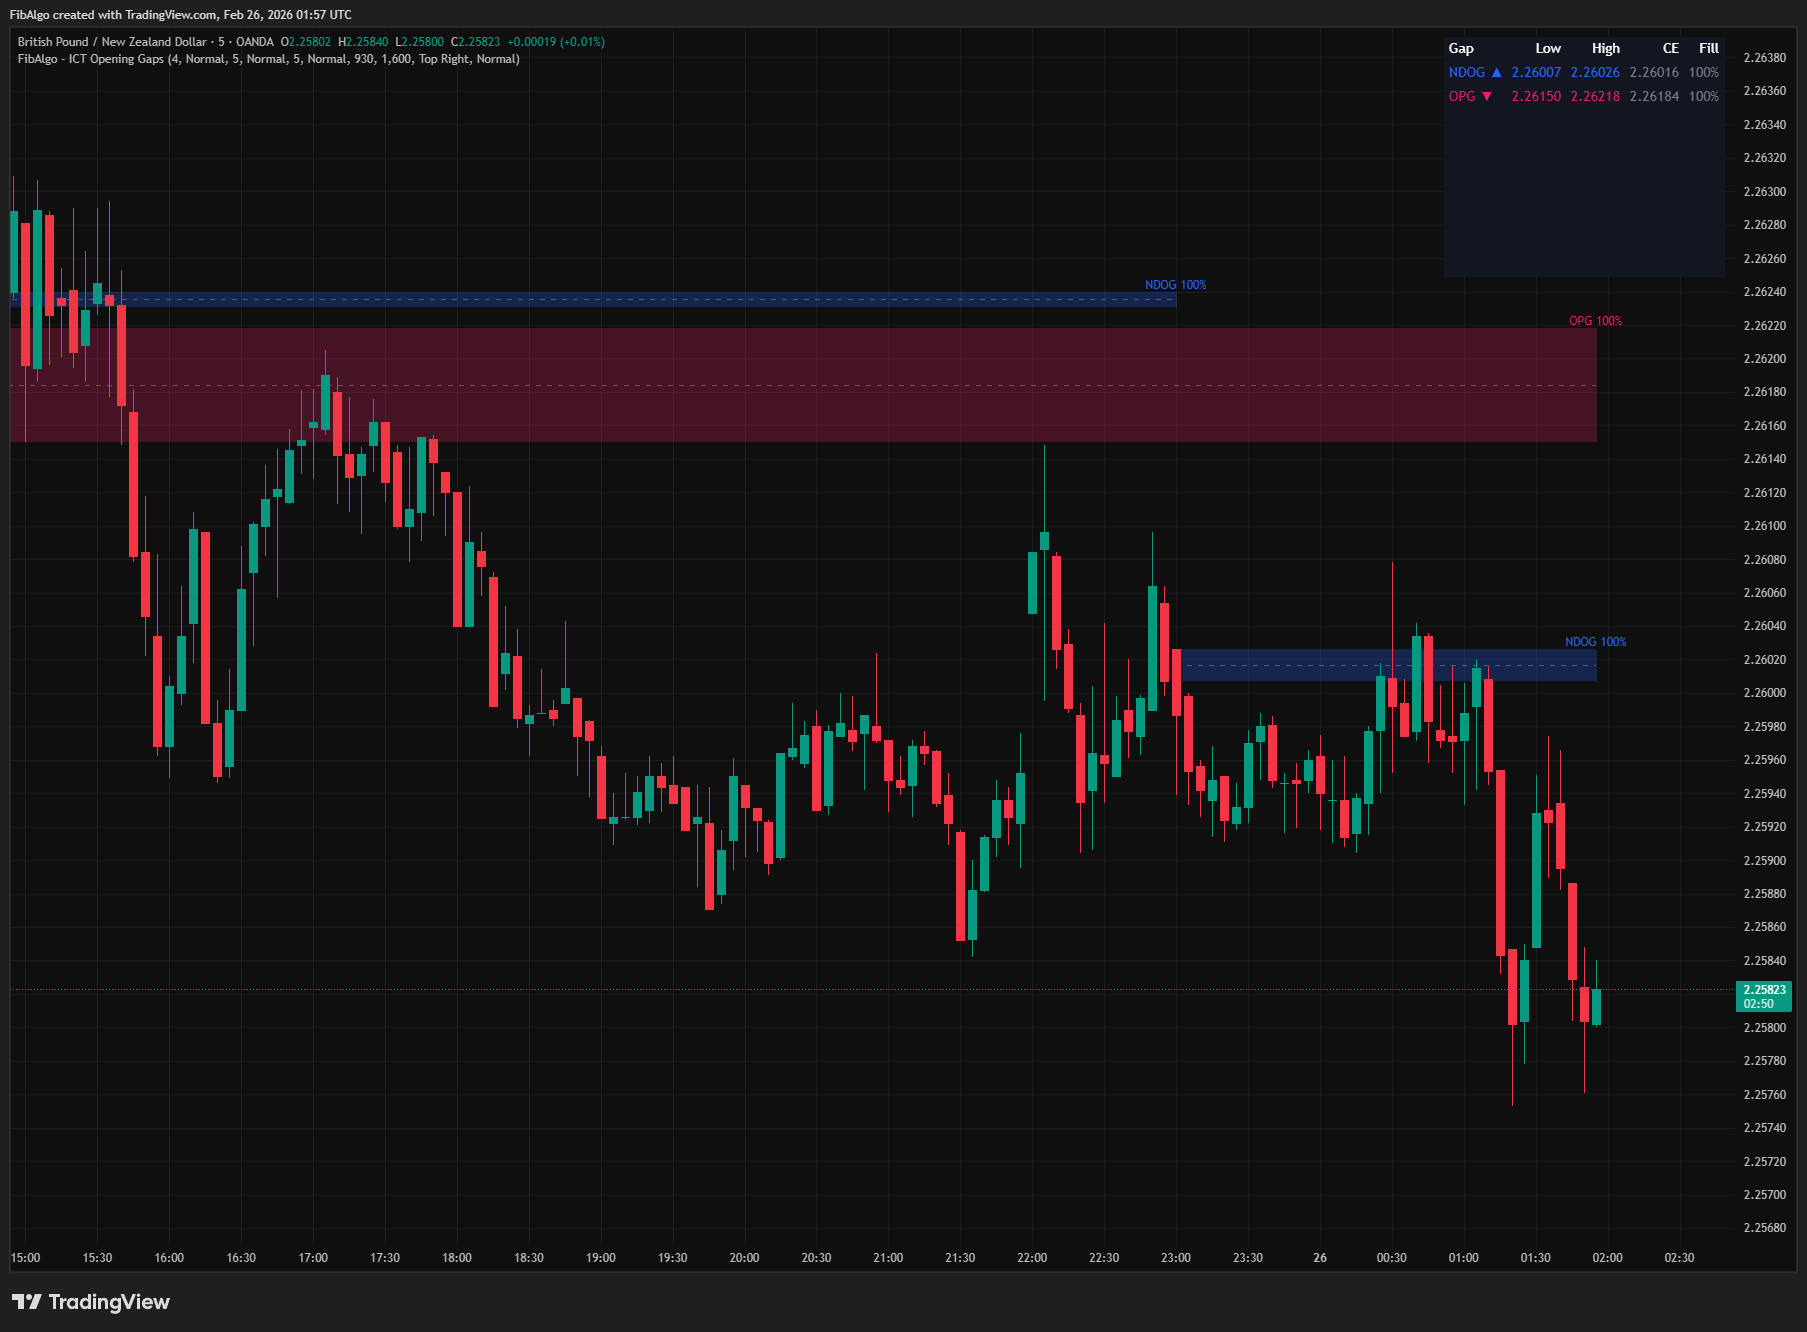 Free
FreeTradingView indicator that detects ICT Opening Gaps — NWOG, NDOG, and OPG — displayed as colored zones with CE midlines and gap fill tracking.
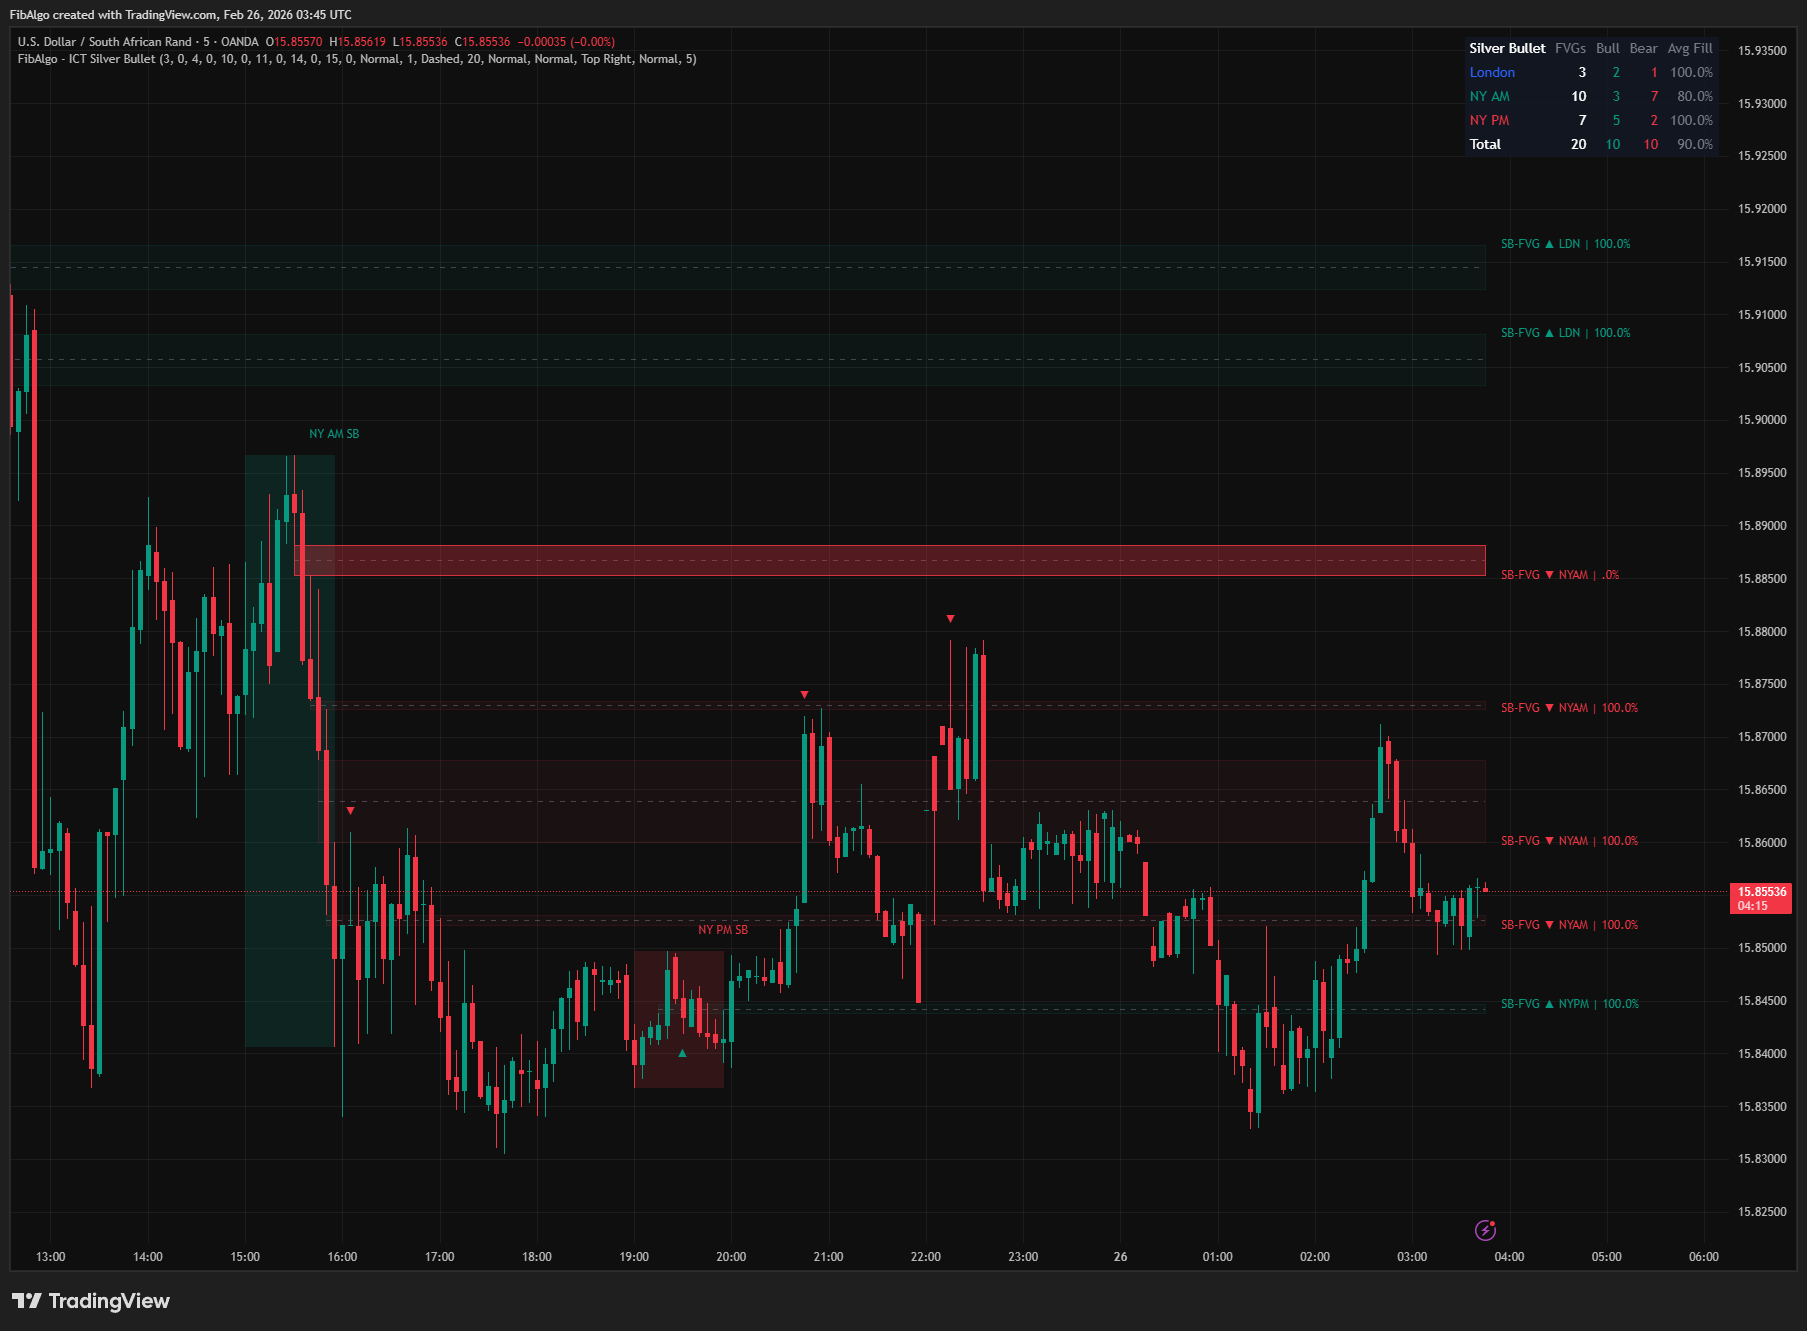 Free
FreeTradingView indicator that identifies ICT Silver Bullet windows — London, NY AM, and NY PM — and detects Fair Value Gaps with CE entry signals.
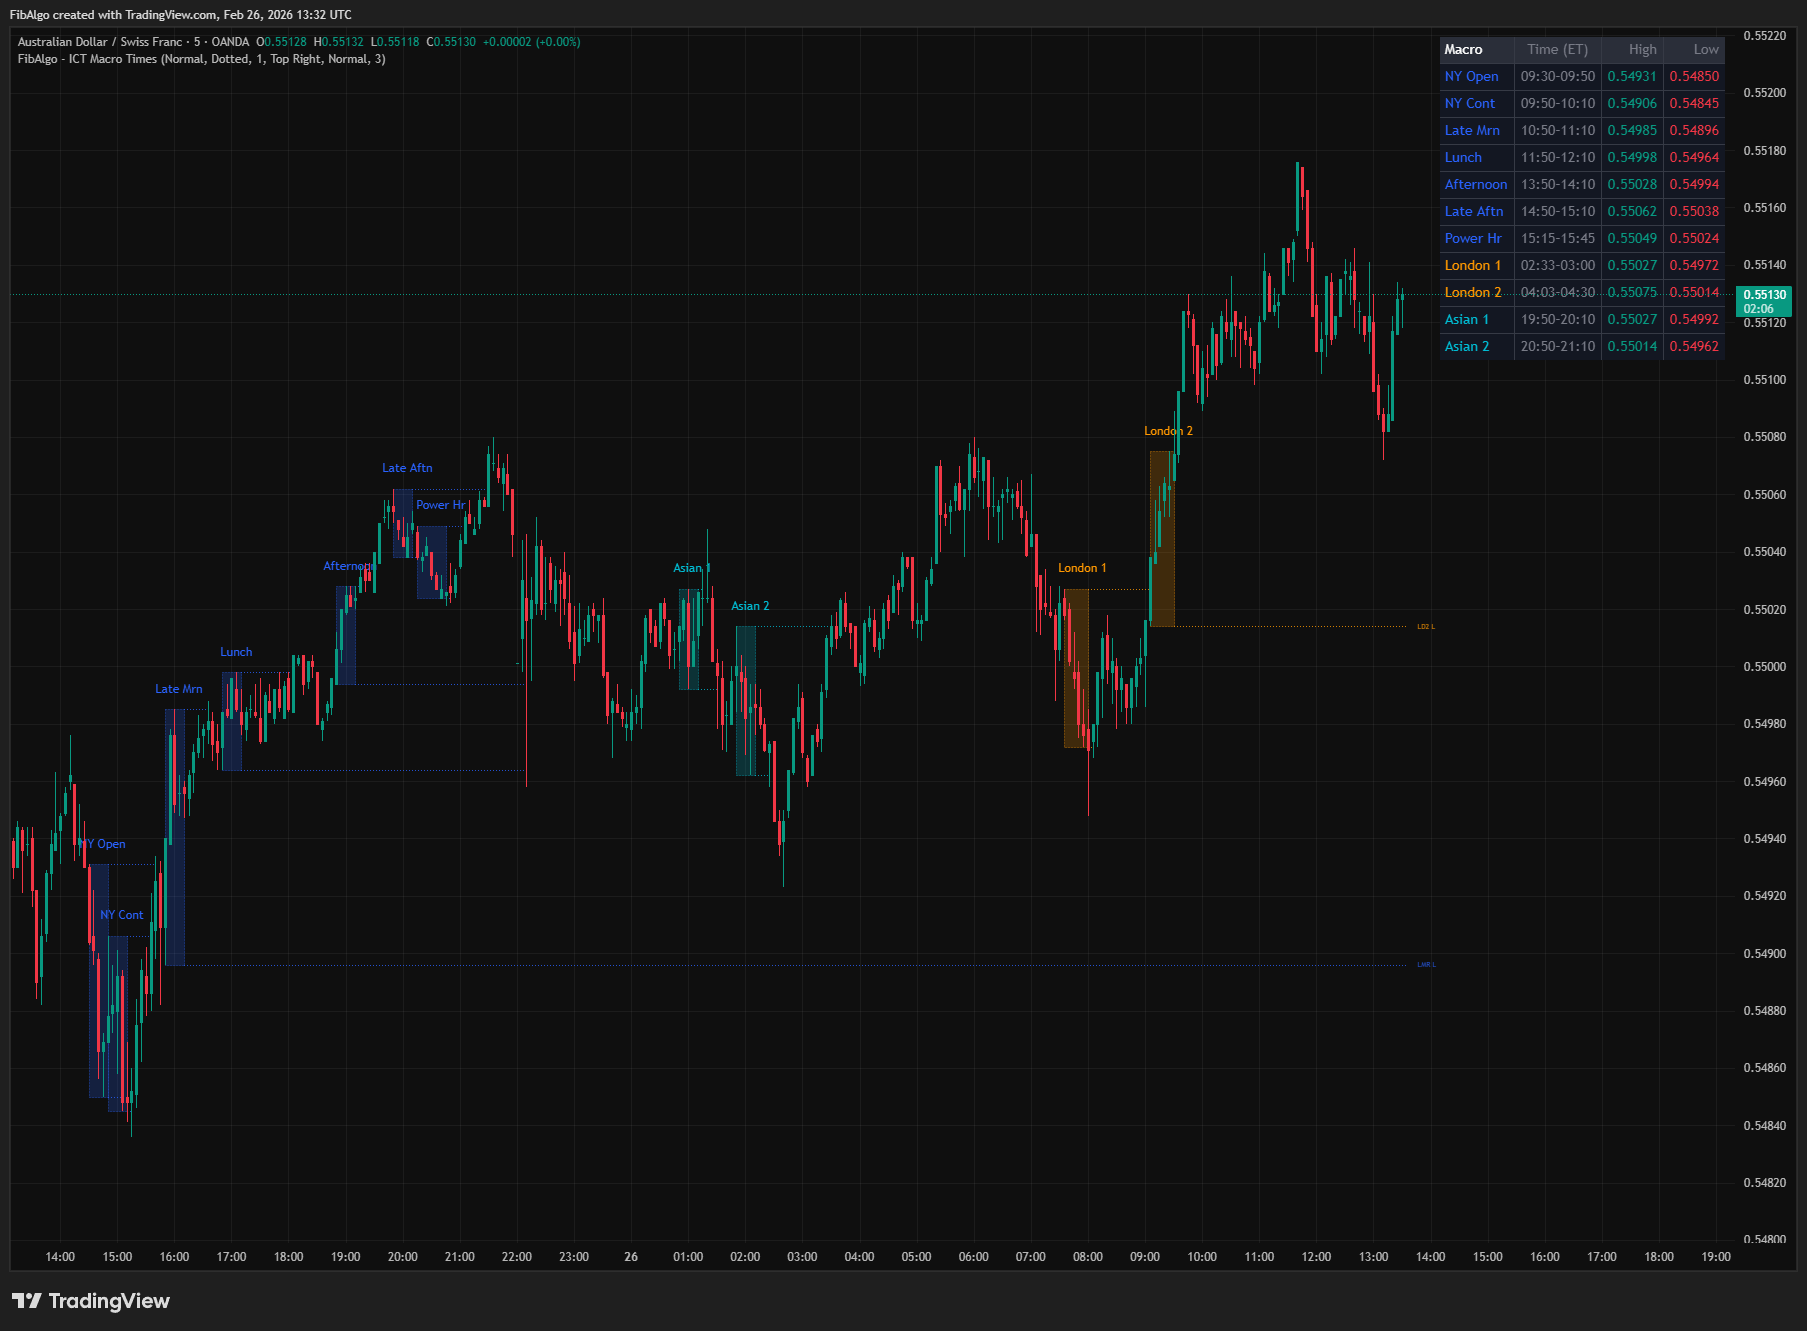 Free
FreeTradingView indicator that highlights 11 ICT Macro Time windows — specific intraday periods where algorithmic price delivery concentrates.
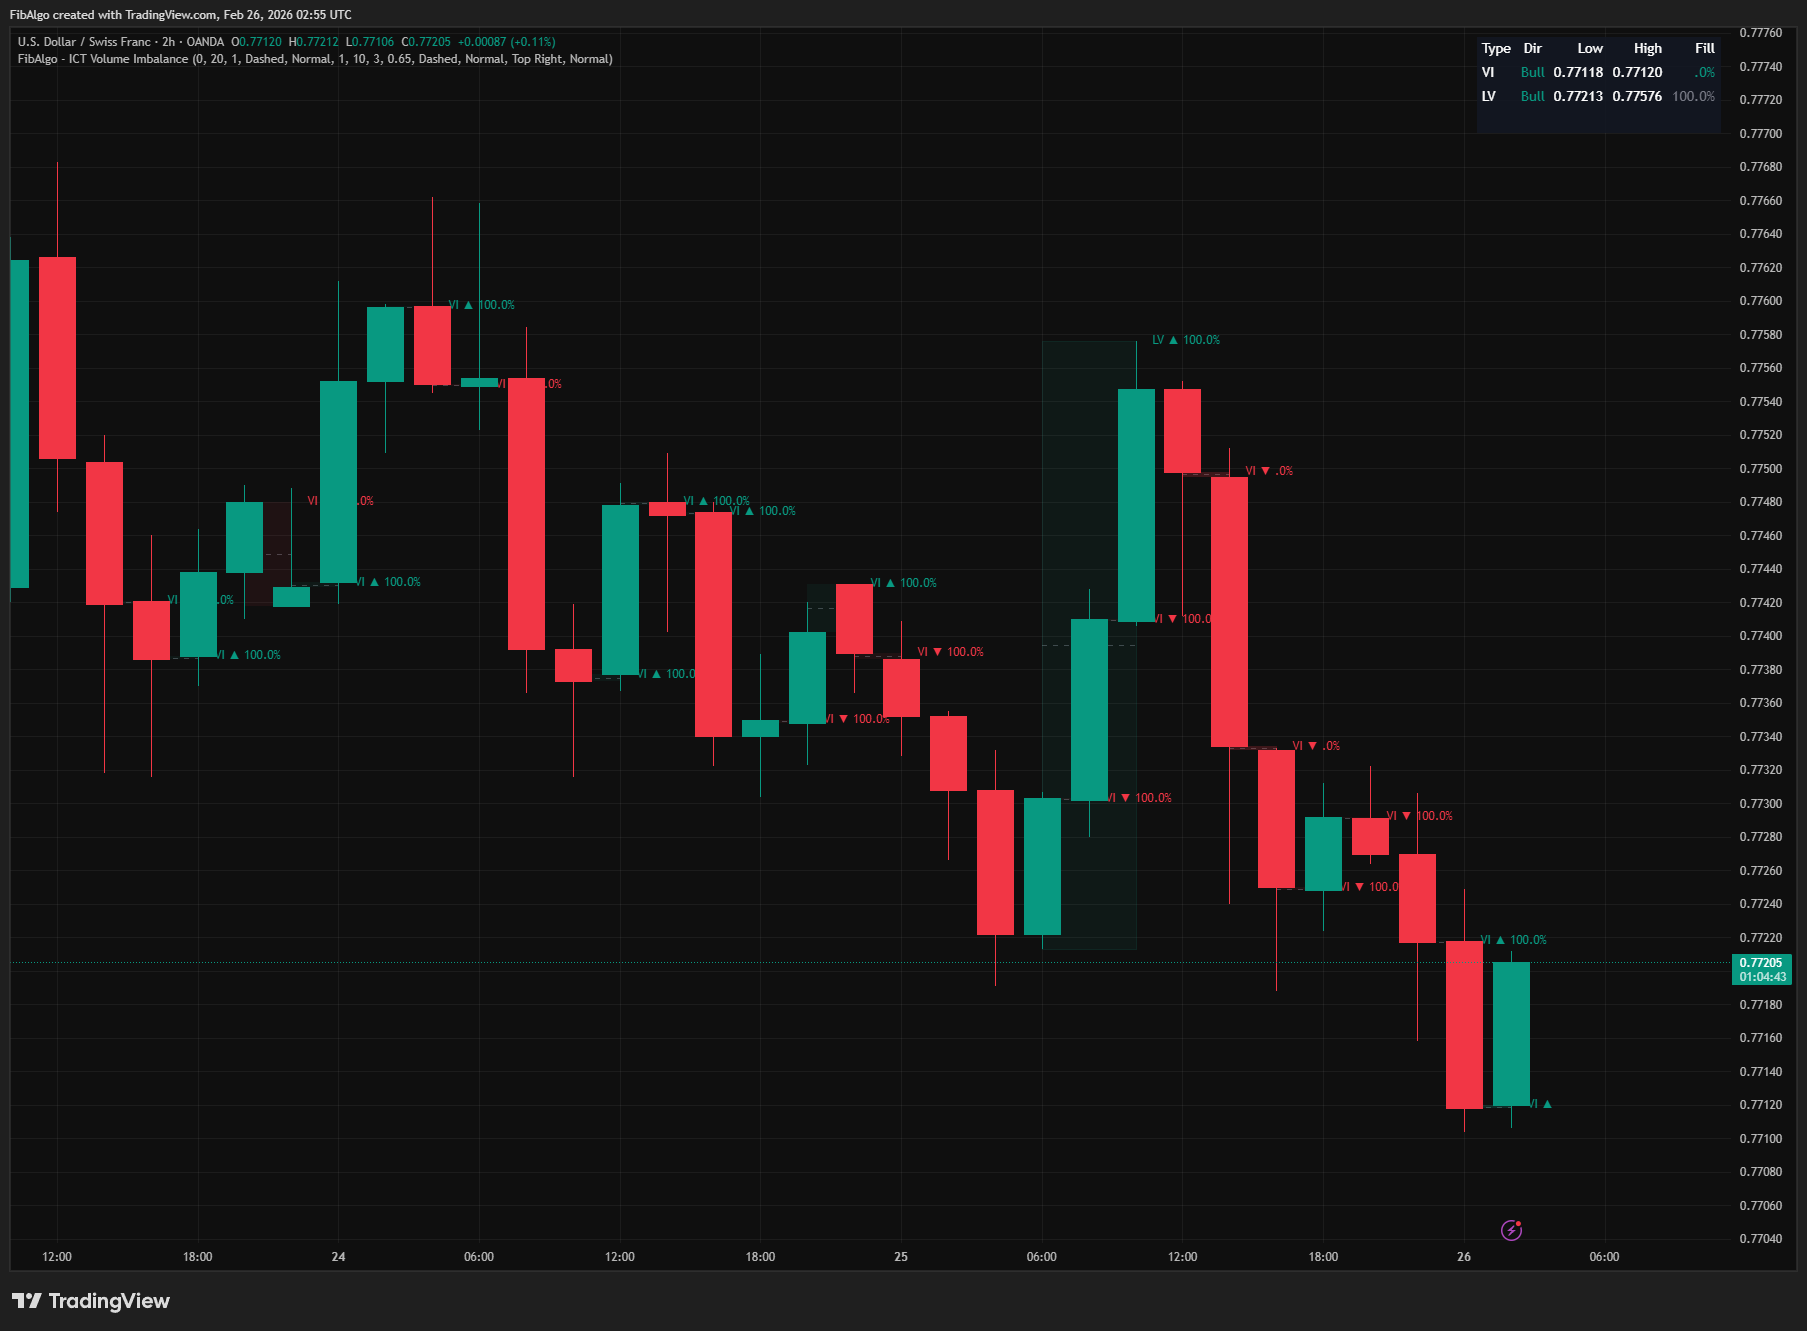 Free
FreeTradingView indicator that detects ICT Volume Imbalance and Liquidity Void inefficiencies with CE midlines and real-time fill tracking.
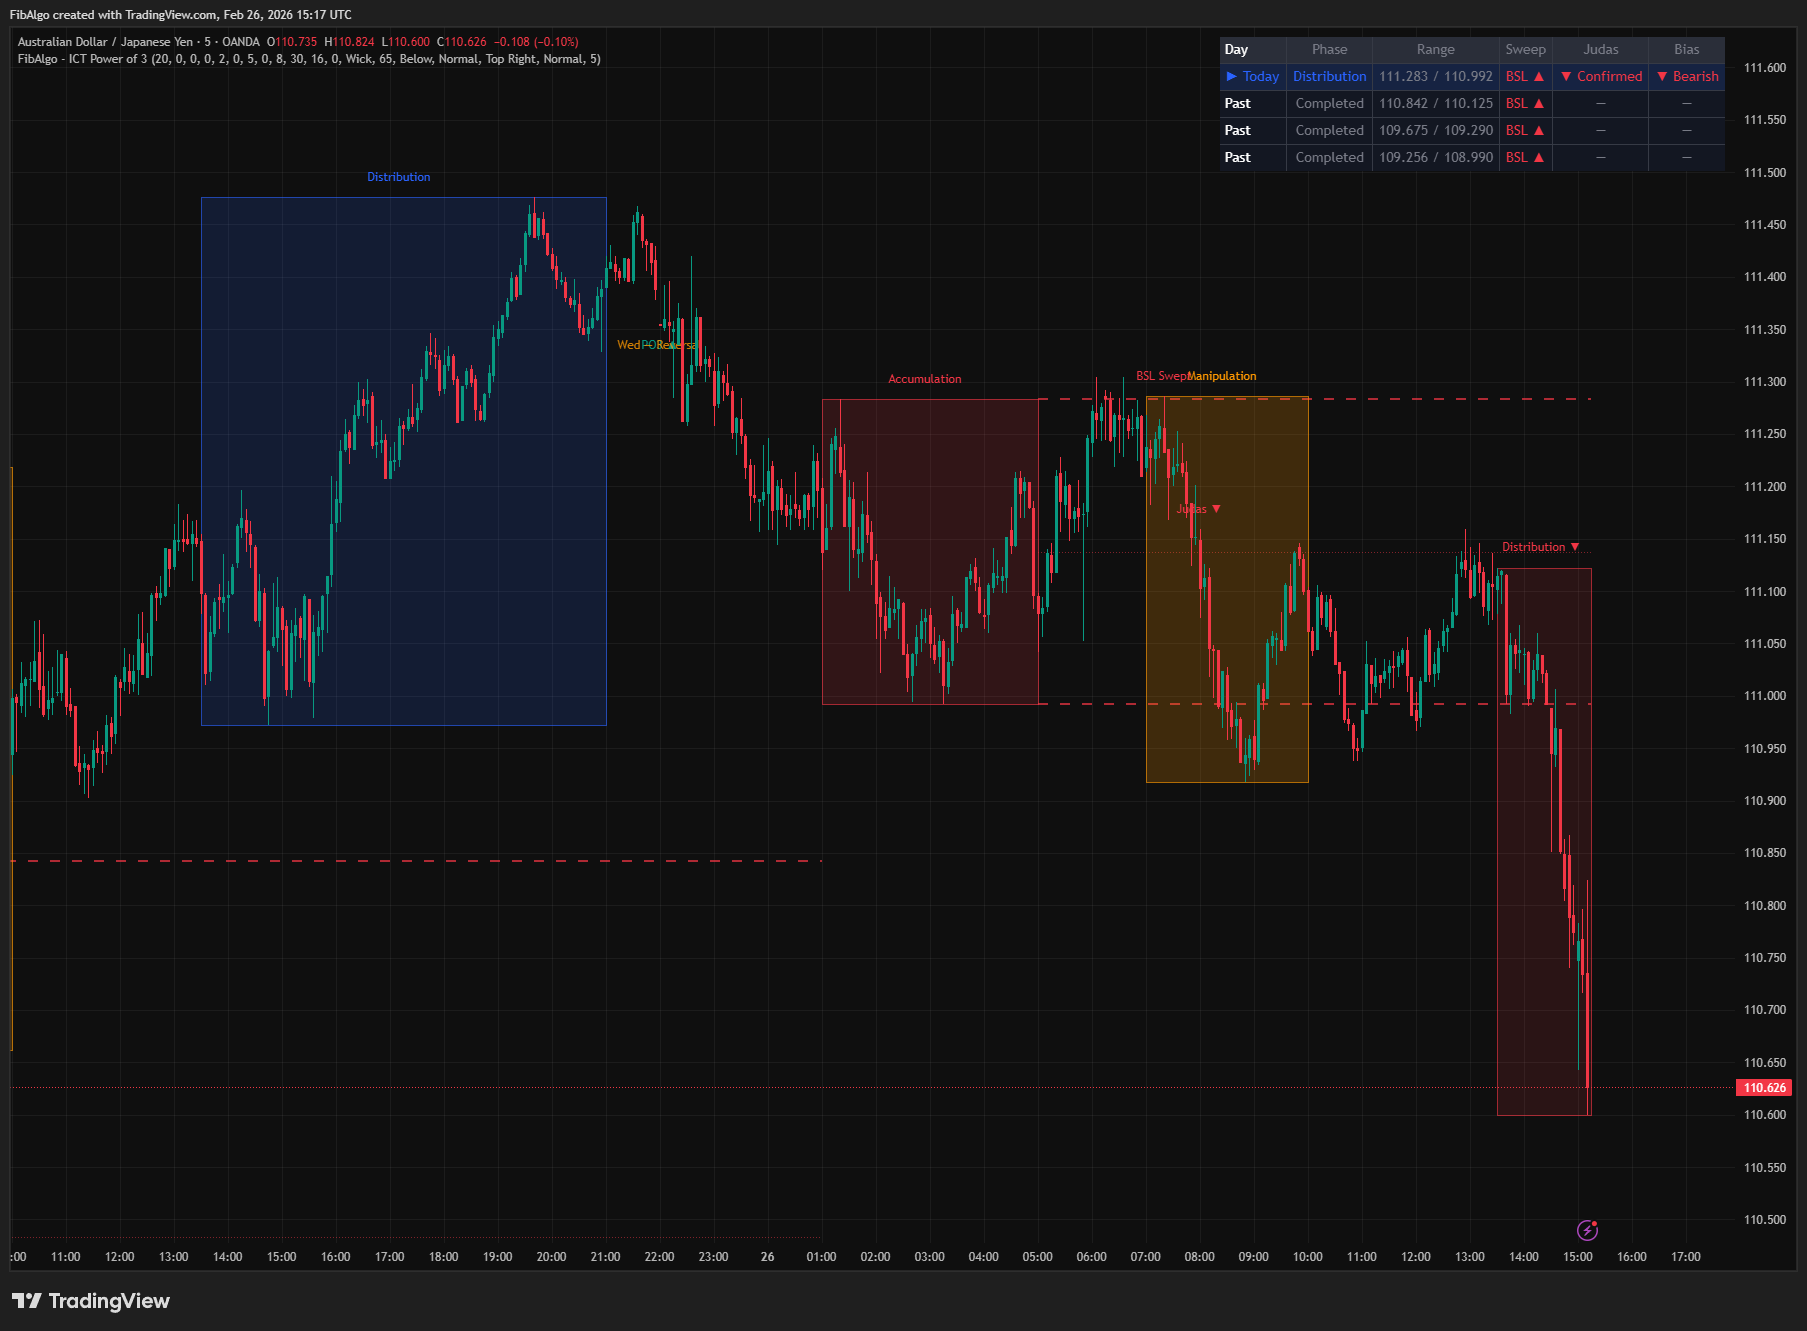 Free
FreeTradingView indicator that visualizes the ICT Power of 3 daily cycle — Accumulation, Manipulation, and Distribution across Asia, London, and New York.
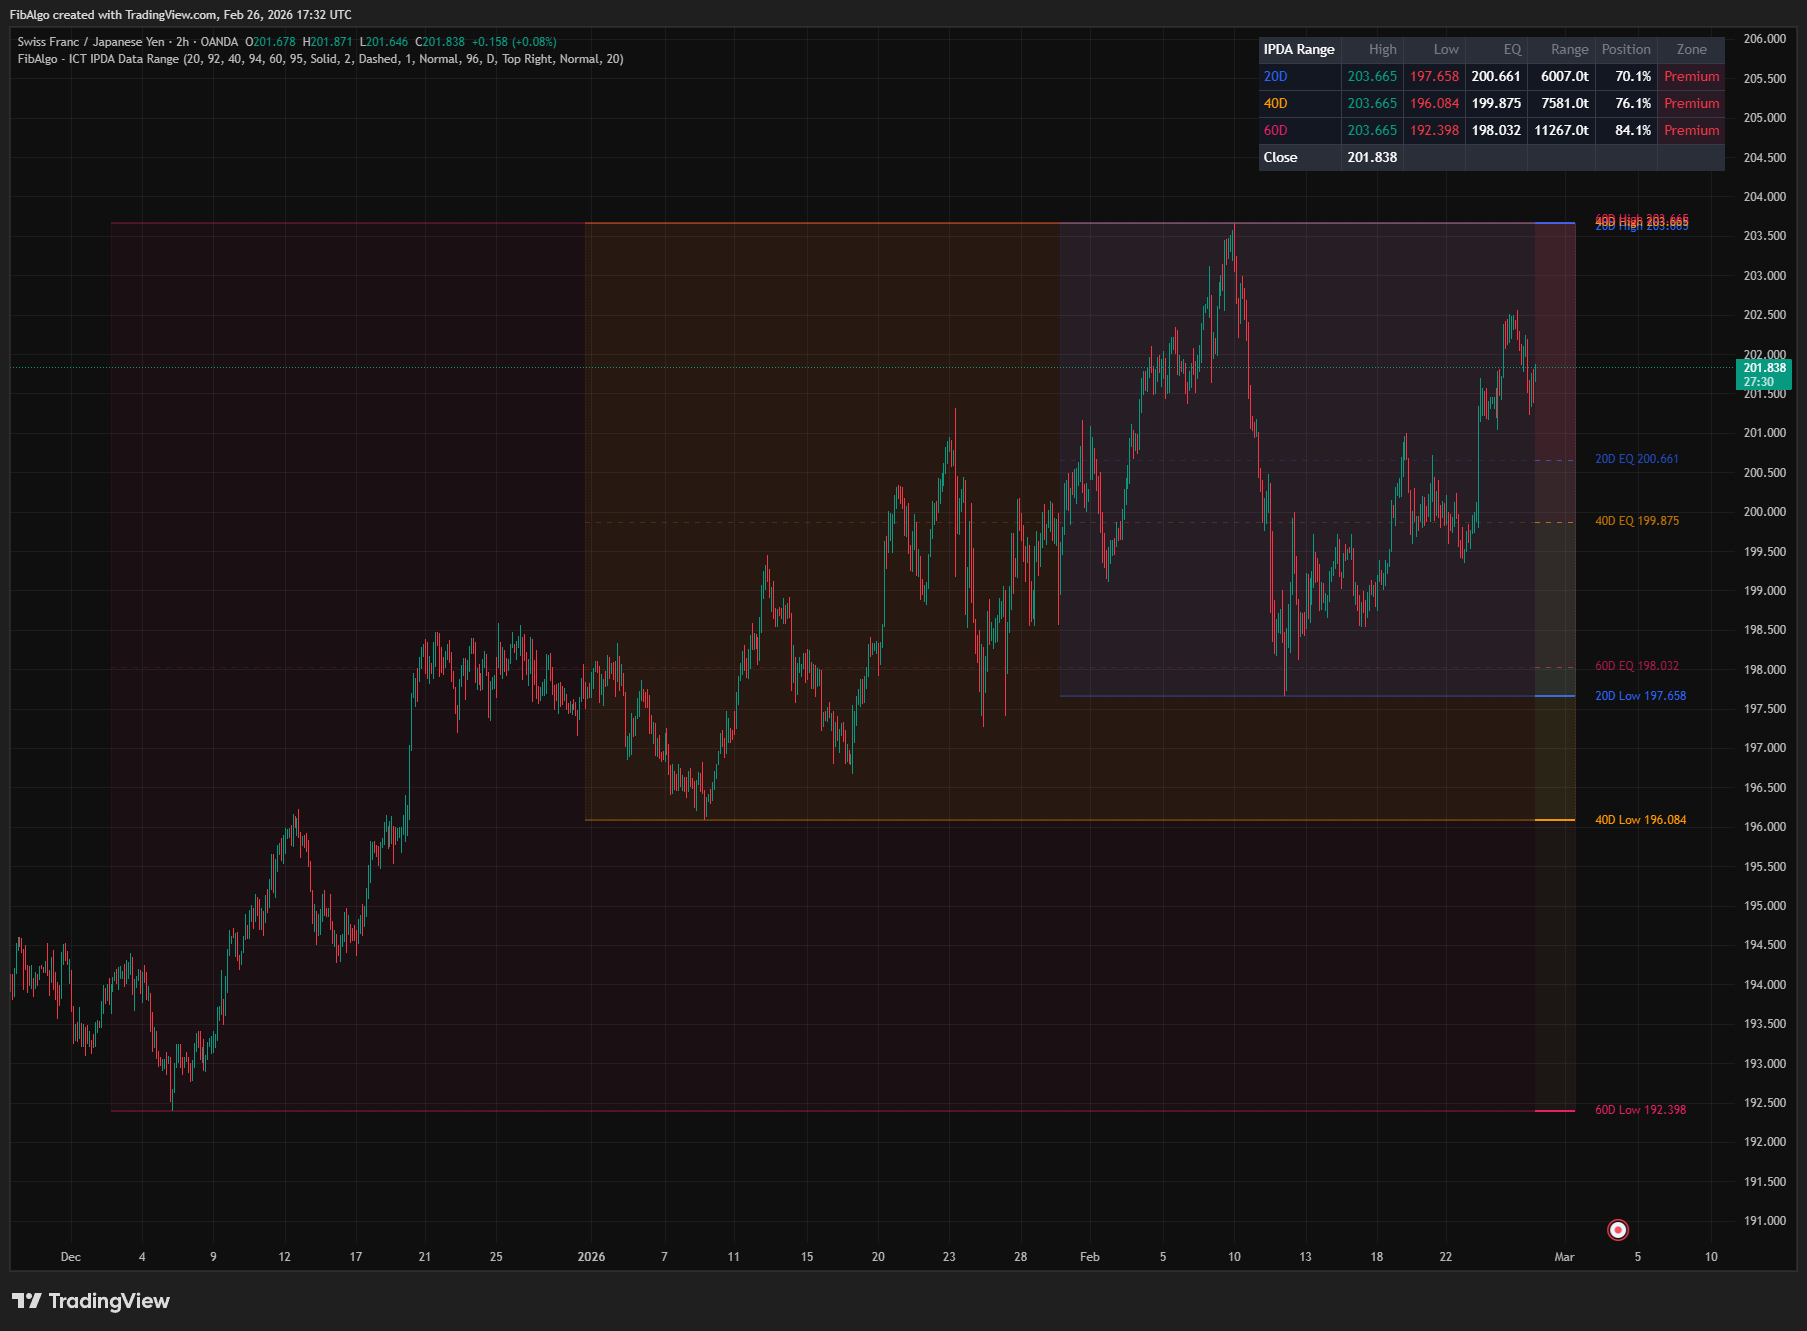 Free
FreeTradingView indicator that plots ICT IPDA Data Ranges — 20, 40, and 60 trading day lookback periods with equilibrium and Premium/Discount zones.
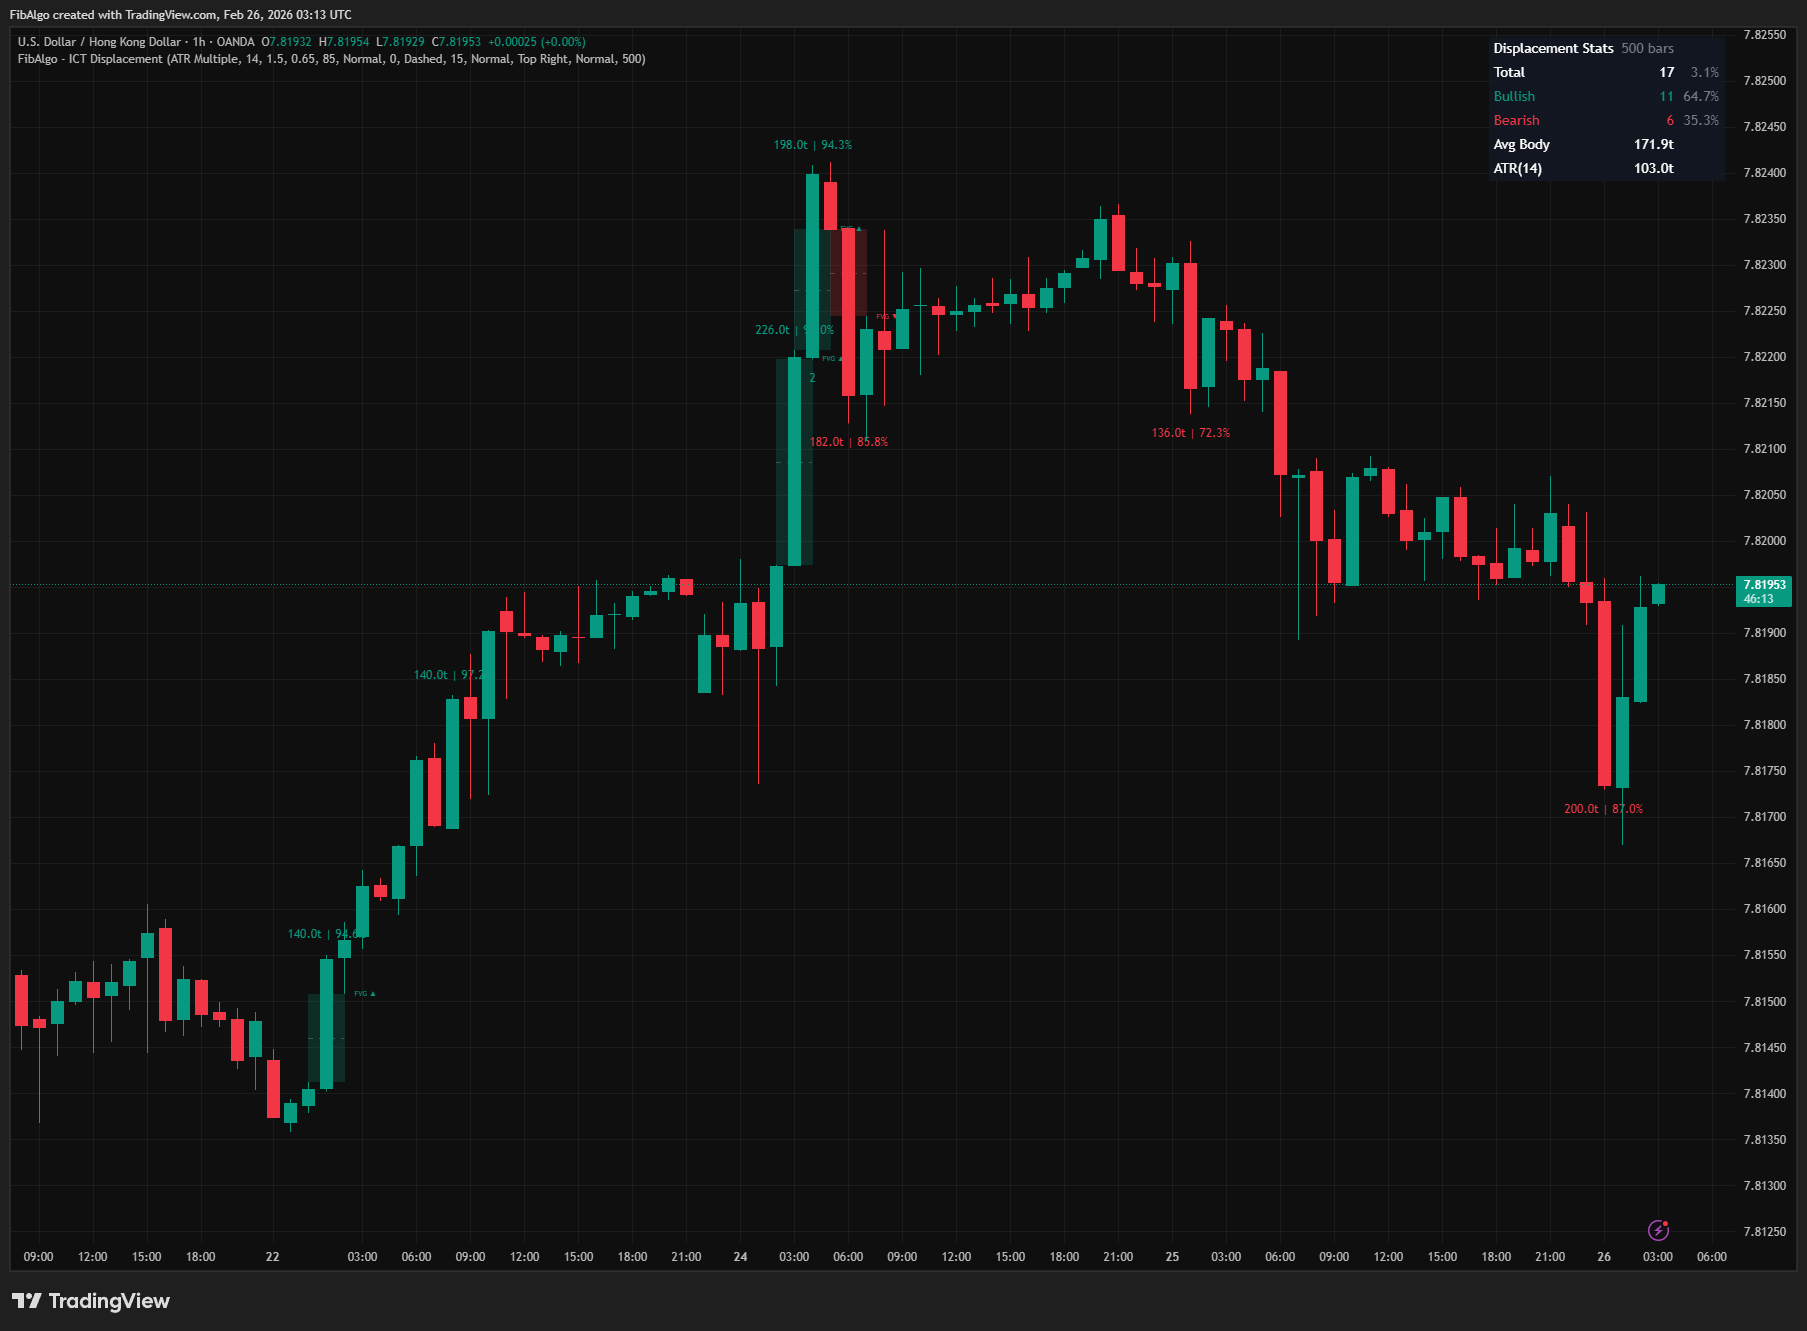 Free
FreeTradingView indicator that detects ICT Displacement candles — aggressive institutional order flow using ATR Multiple and Body/Range Ratio analysis.
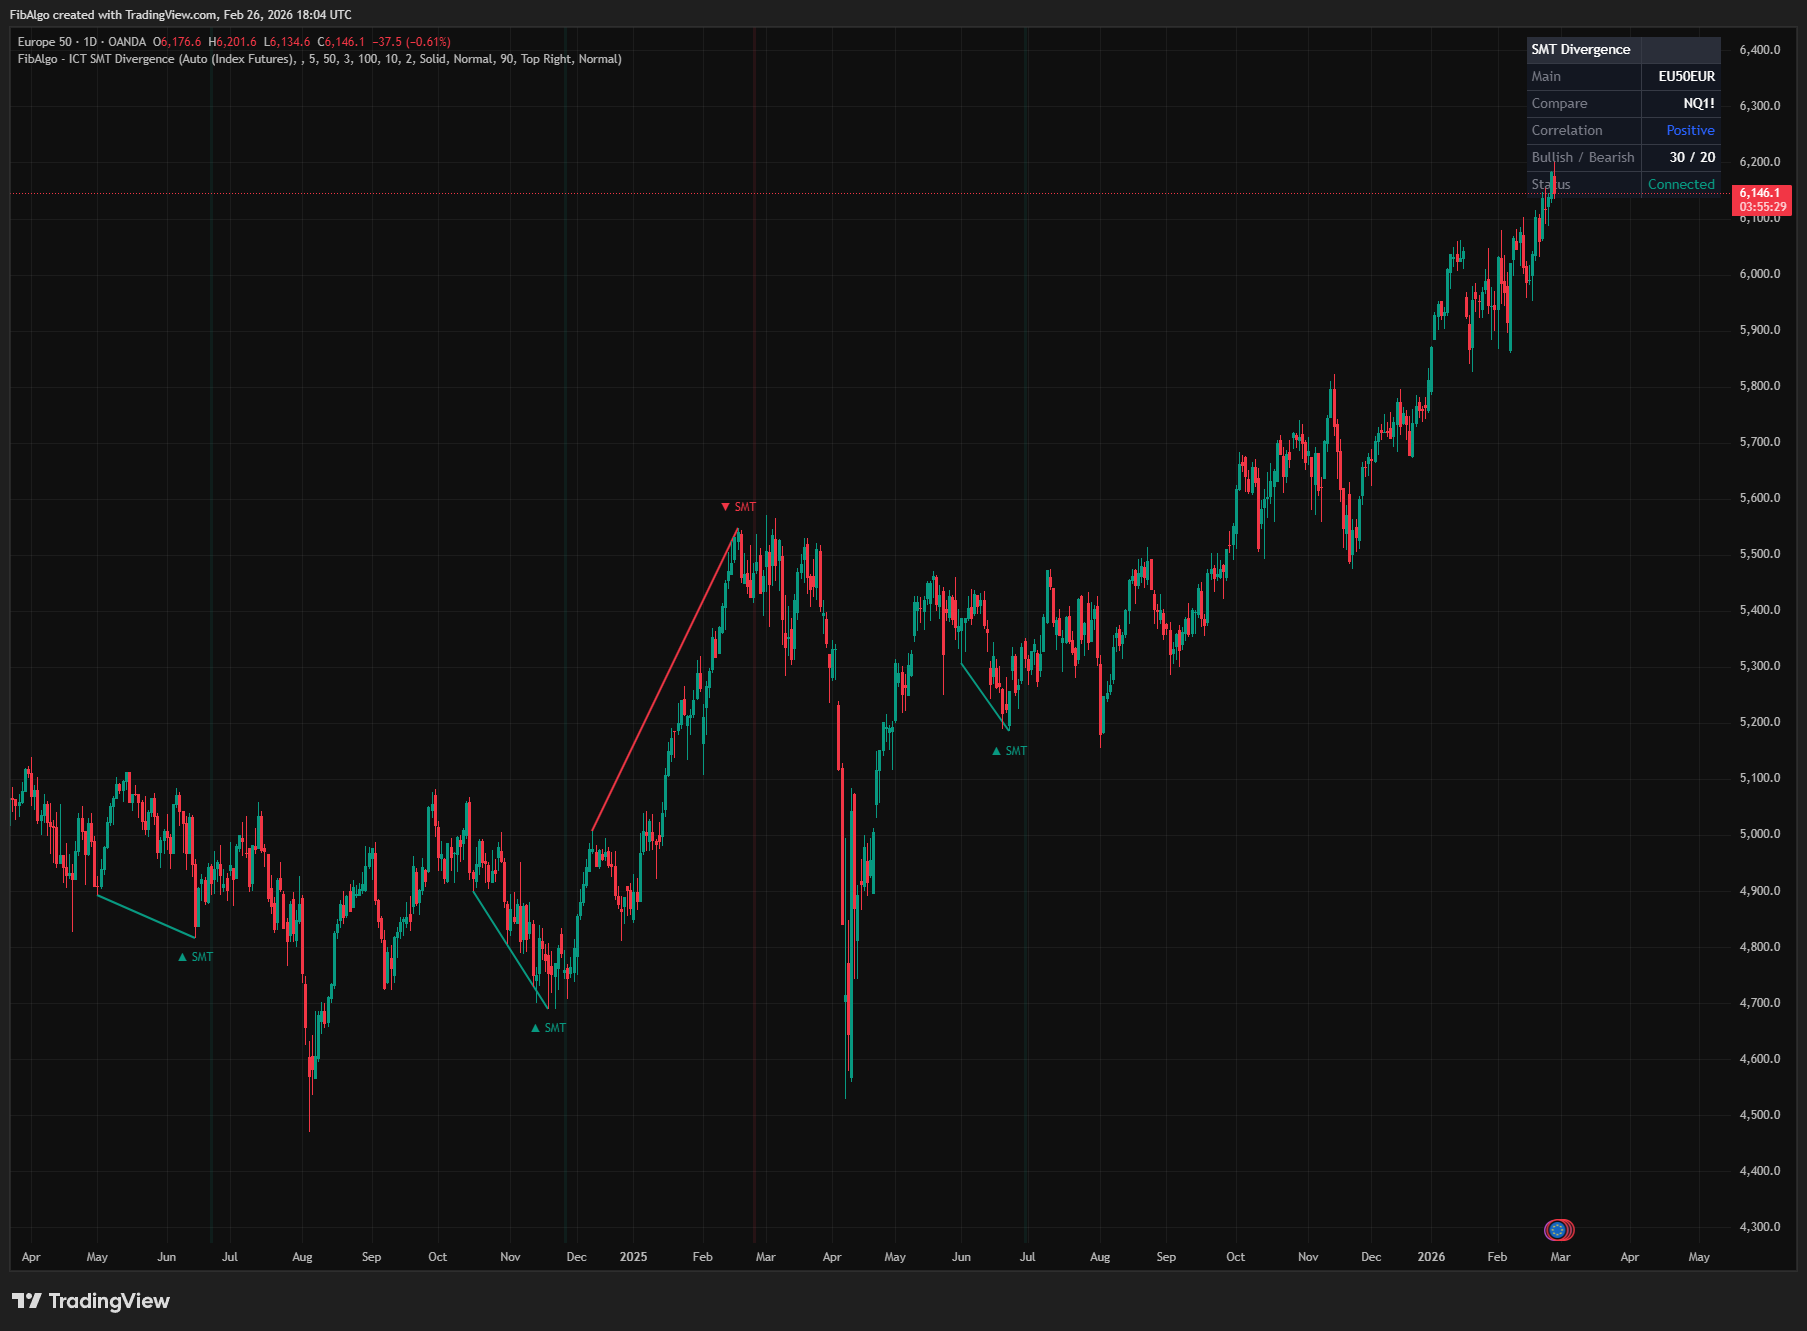 Free
FreeTradingView indicator that detects ICT SMT Divergence — cross-symbol analysis comparing swing extremes to identify institutional manipulation.
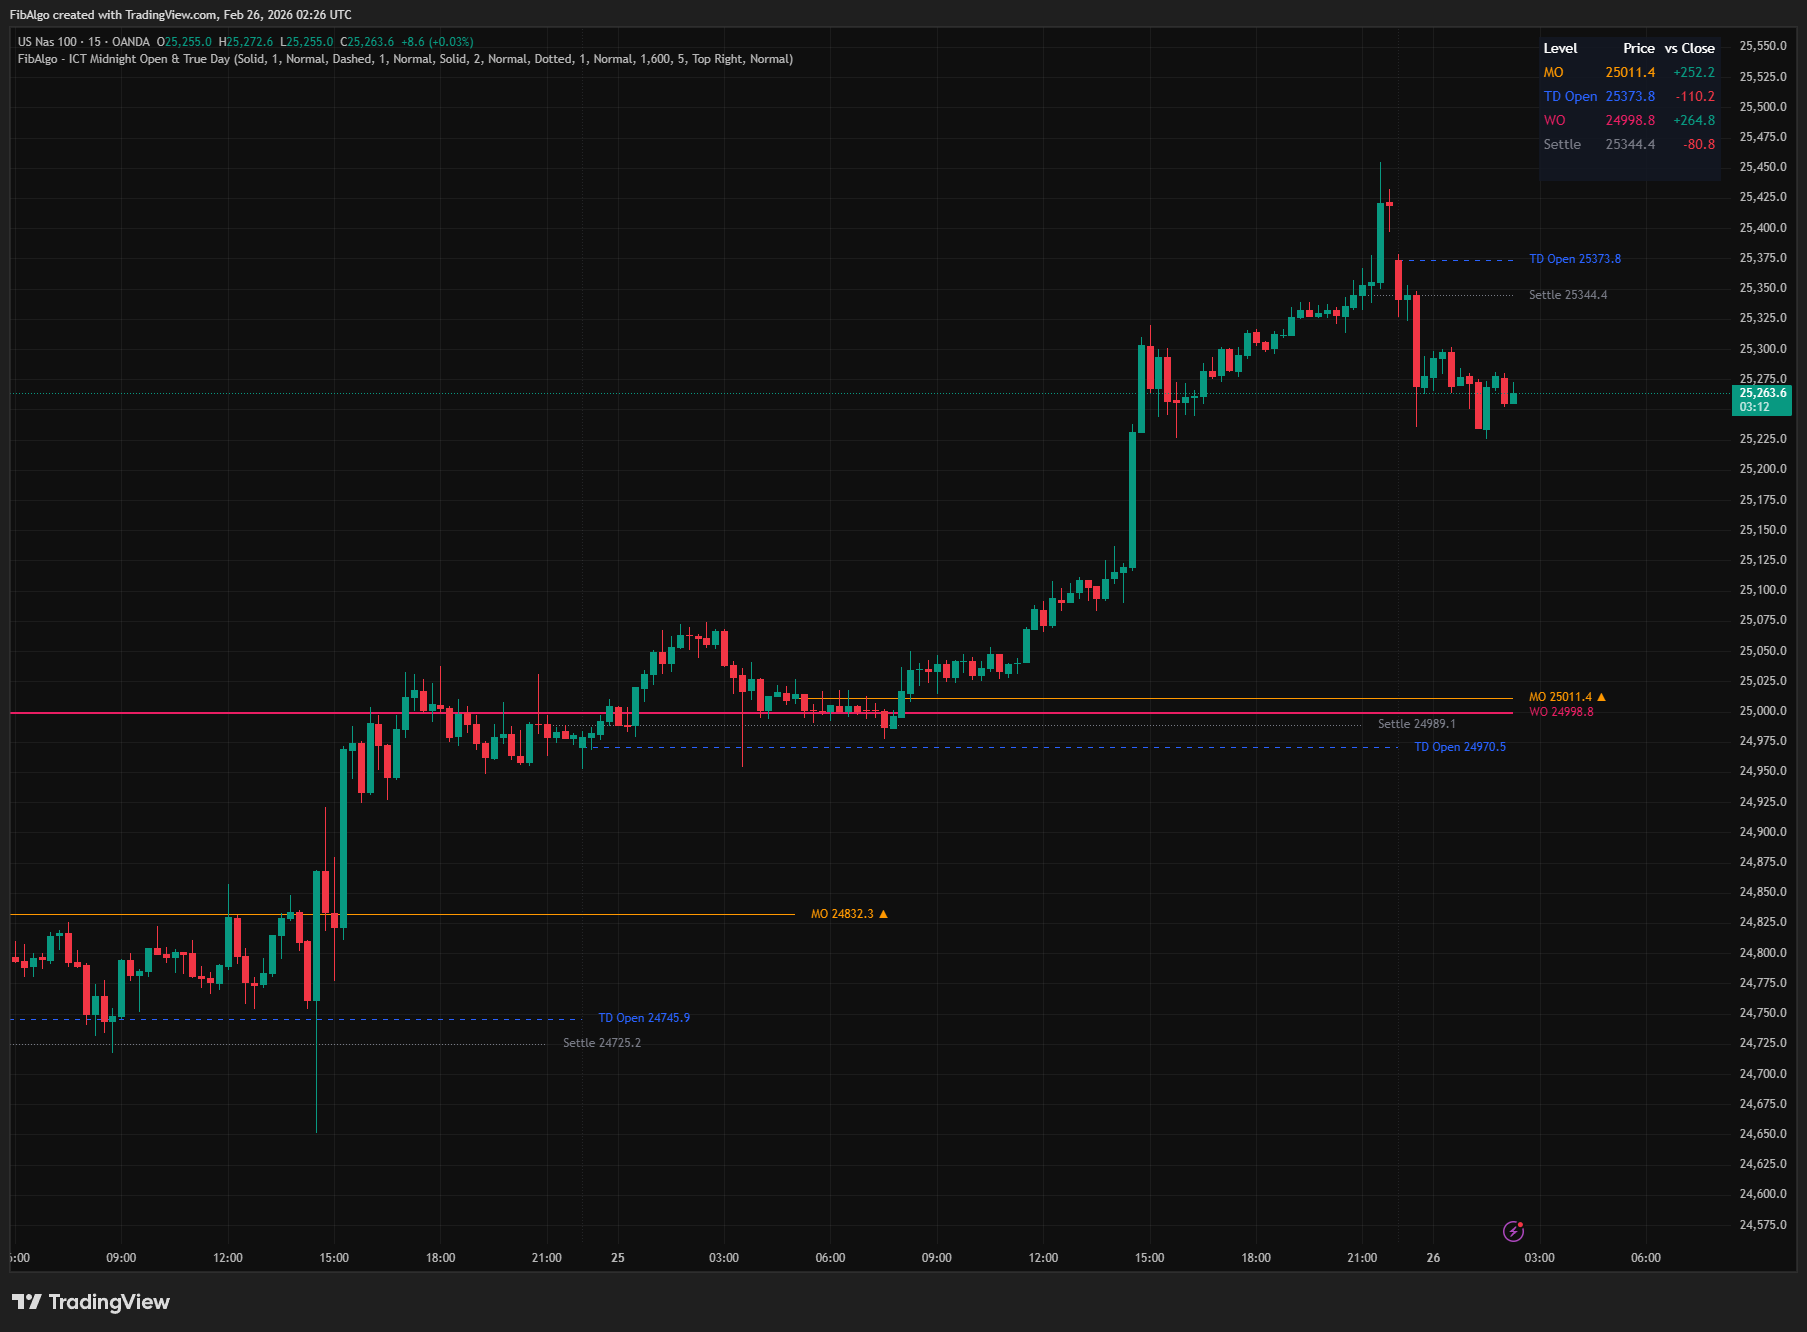 Free
FreeTradingView indicator that plots ICT Midnight Open, True Day Open, Weekly Open, and Settlement Price with directional bias analysis.
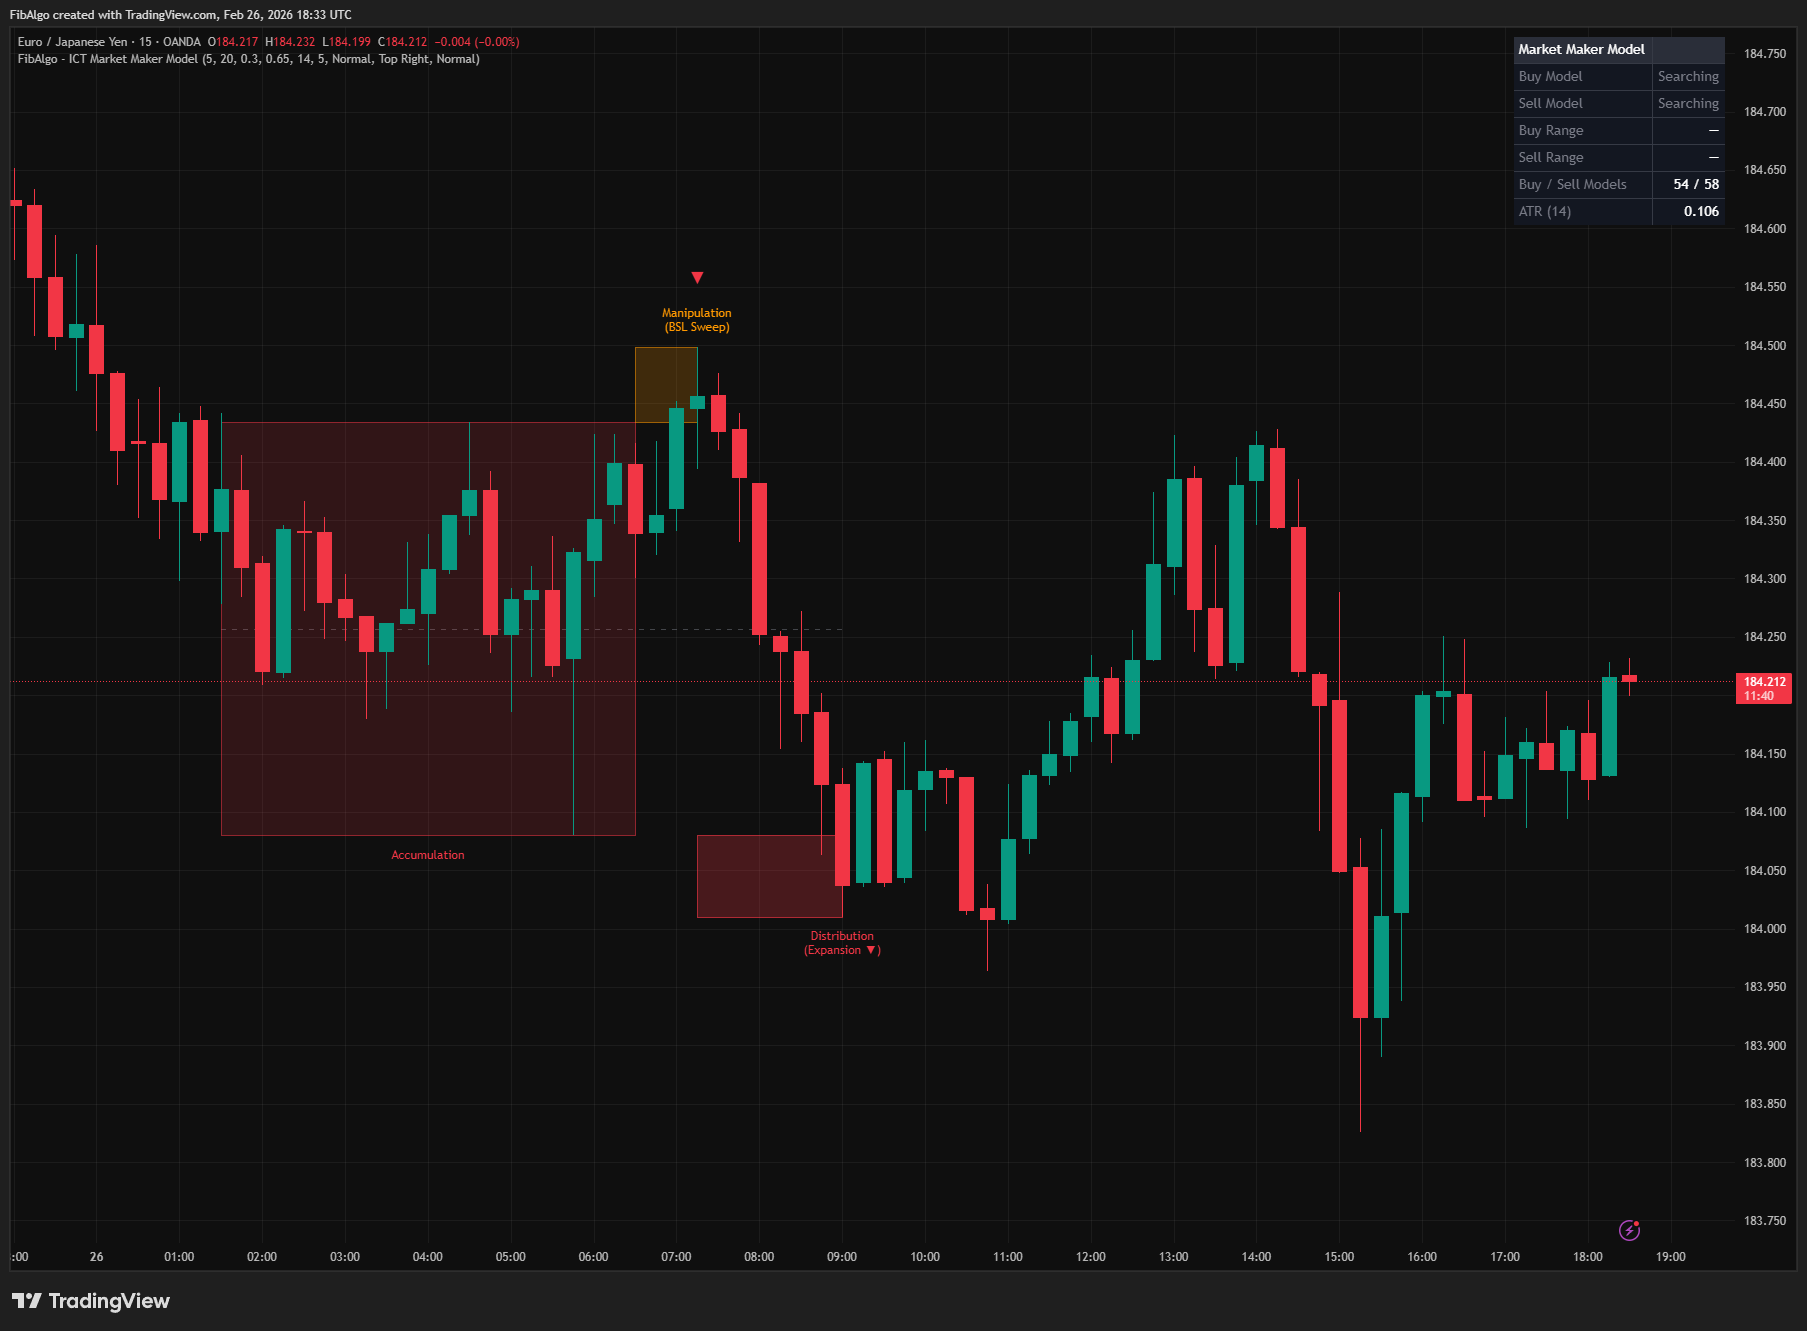 Free
FreeTradingView indicator that detects ICT Market Maker Model — the Accumulation, Manipulation, and Distribution institutional price cycle.
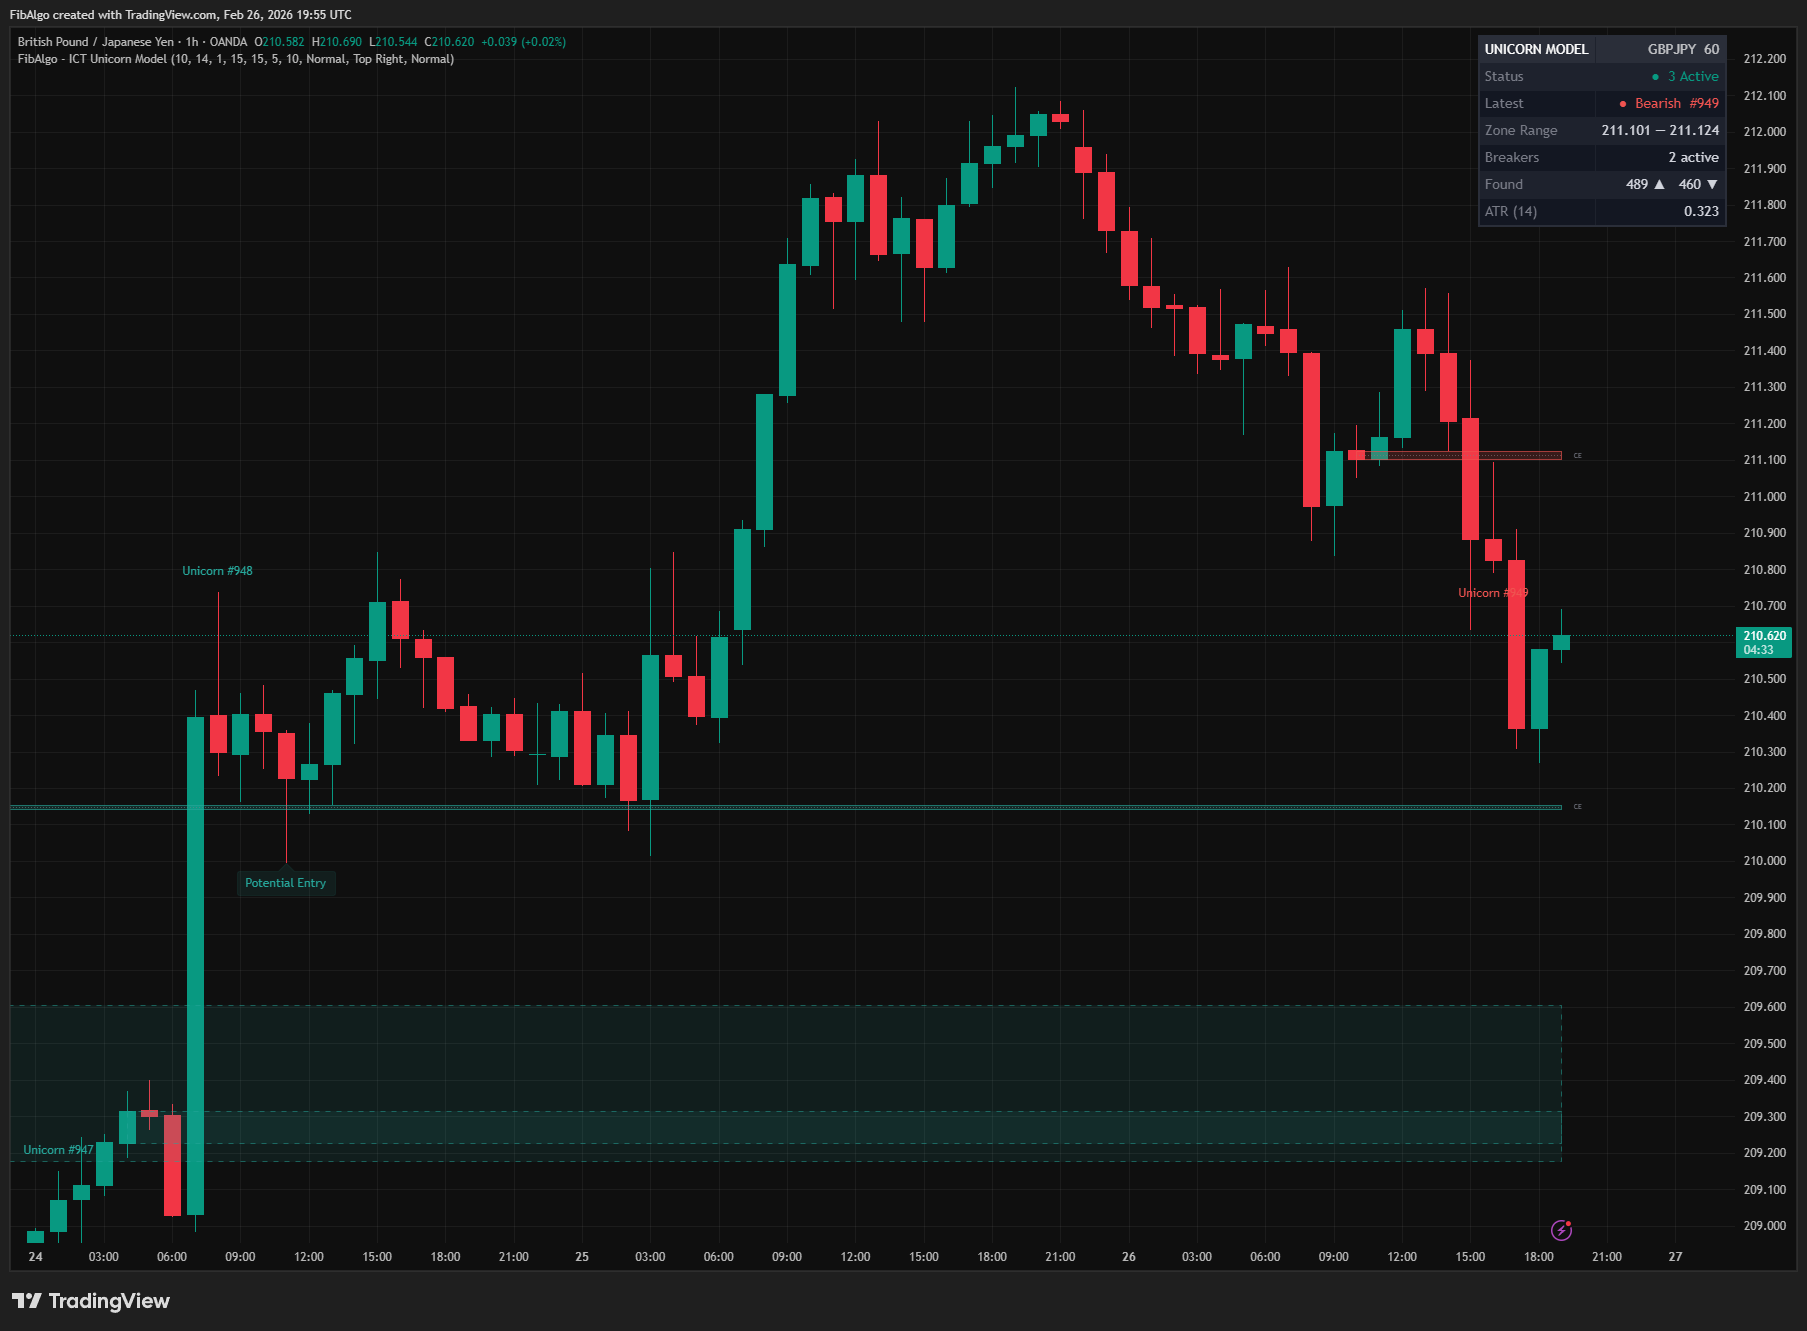 Free
FreeTradingView indicator that detects the ICT Unicorn Model — the highest-conviction setup where a Breaker Block and Fair Value Gap overlap.
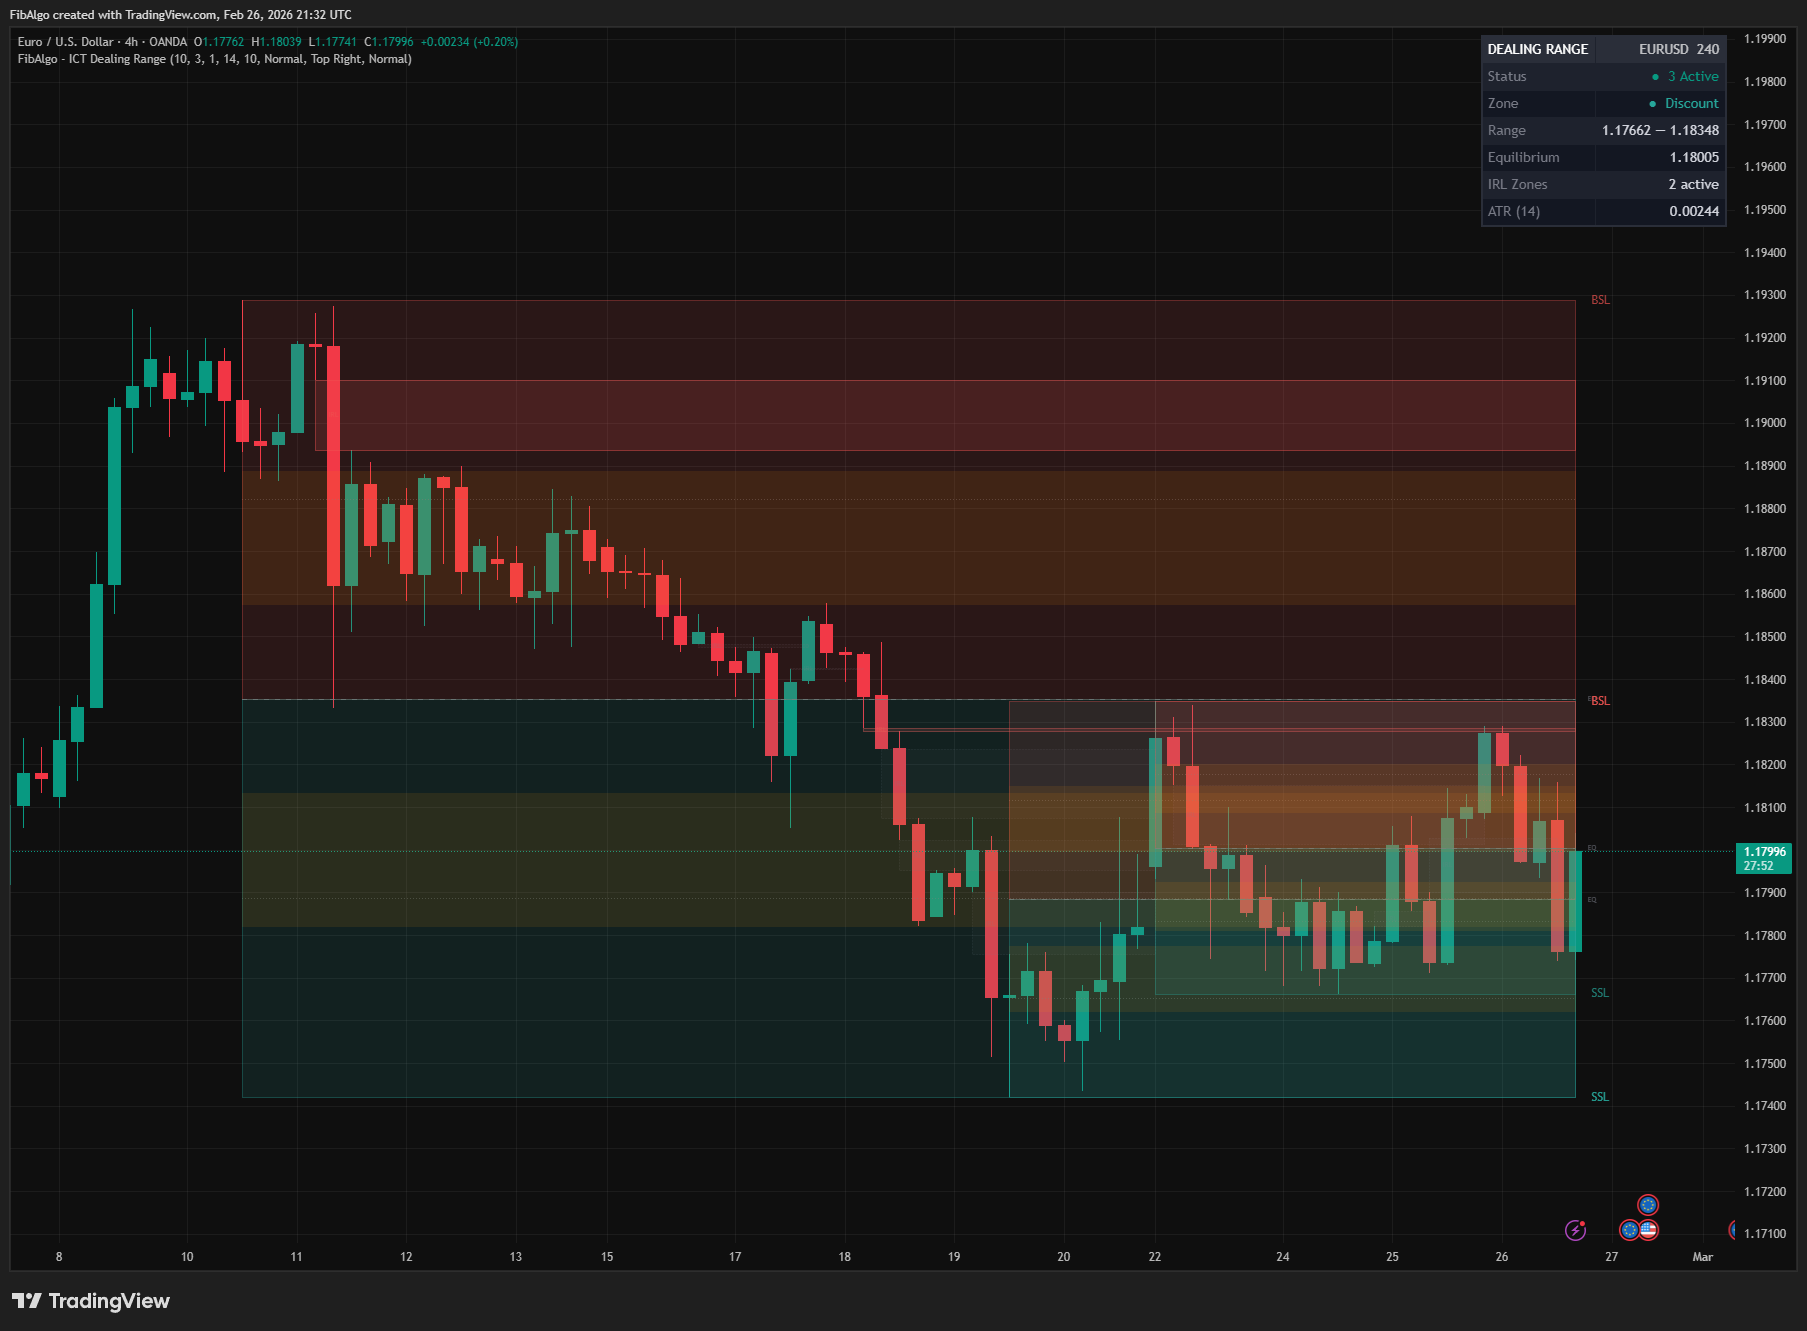 Free
FreeTradingView indicator that identifies ICT Dealing Ranges with Premium, Discount, and Equilibrium zones, plus internal and external range liquidity mapping.
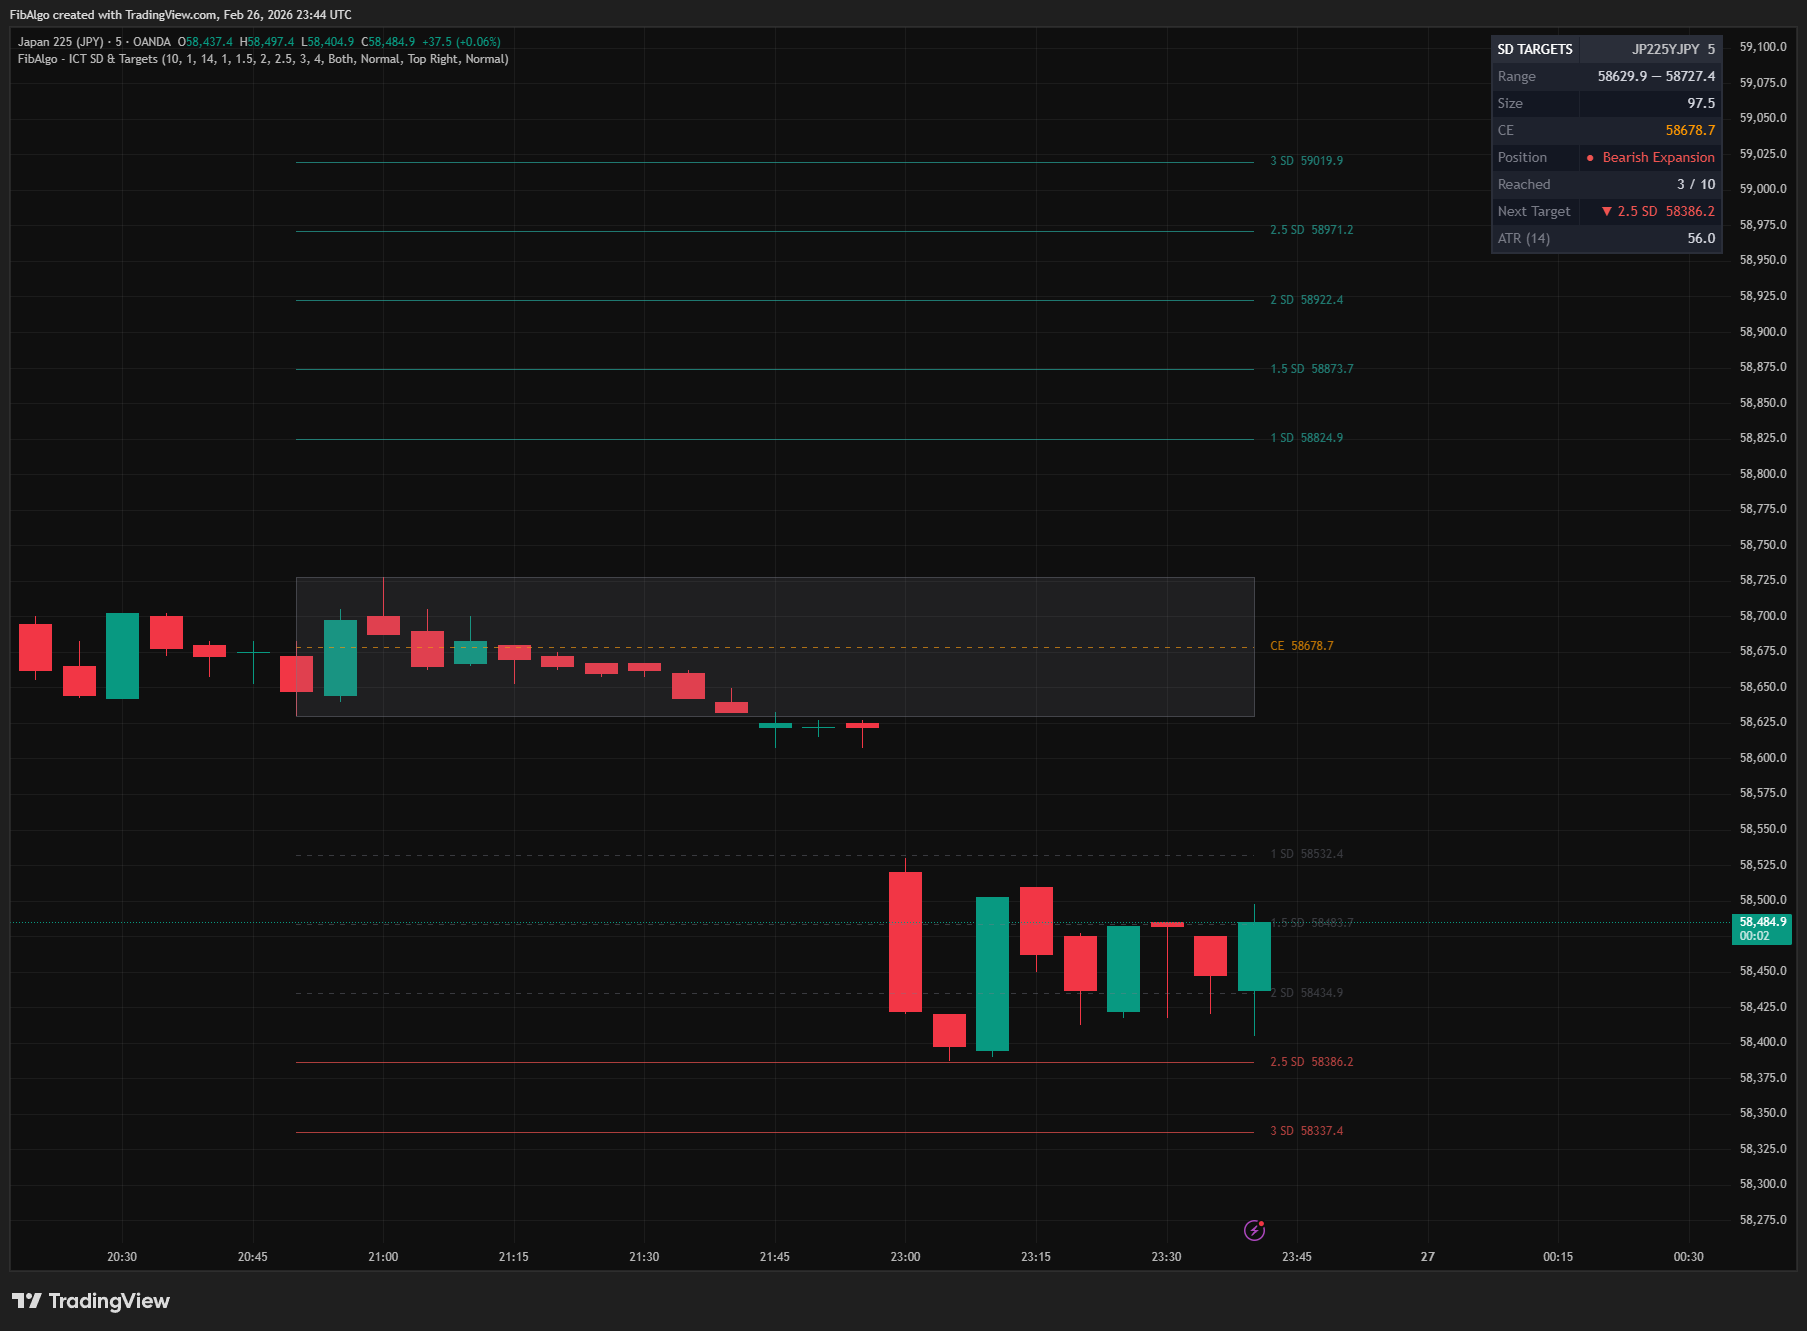 Free
FreeTradingView indicator that projects ICT Standard Deviation extension levels from swing ranges for identifying high-probability price targets.
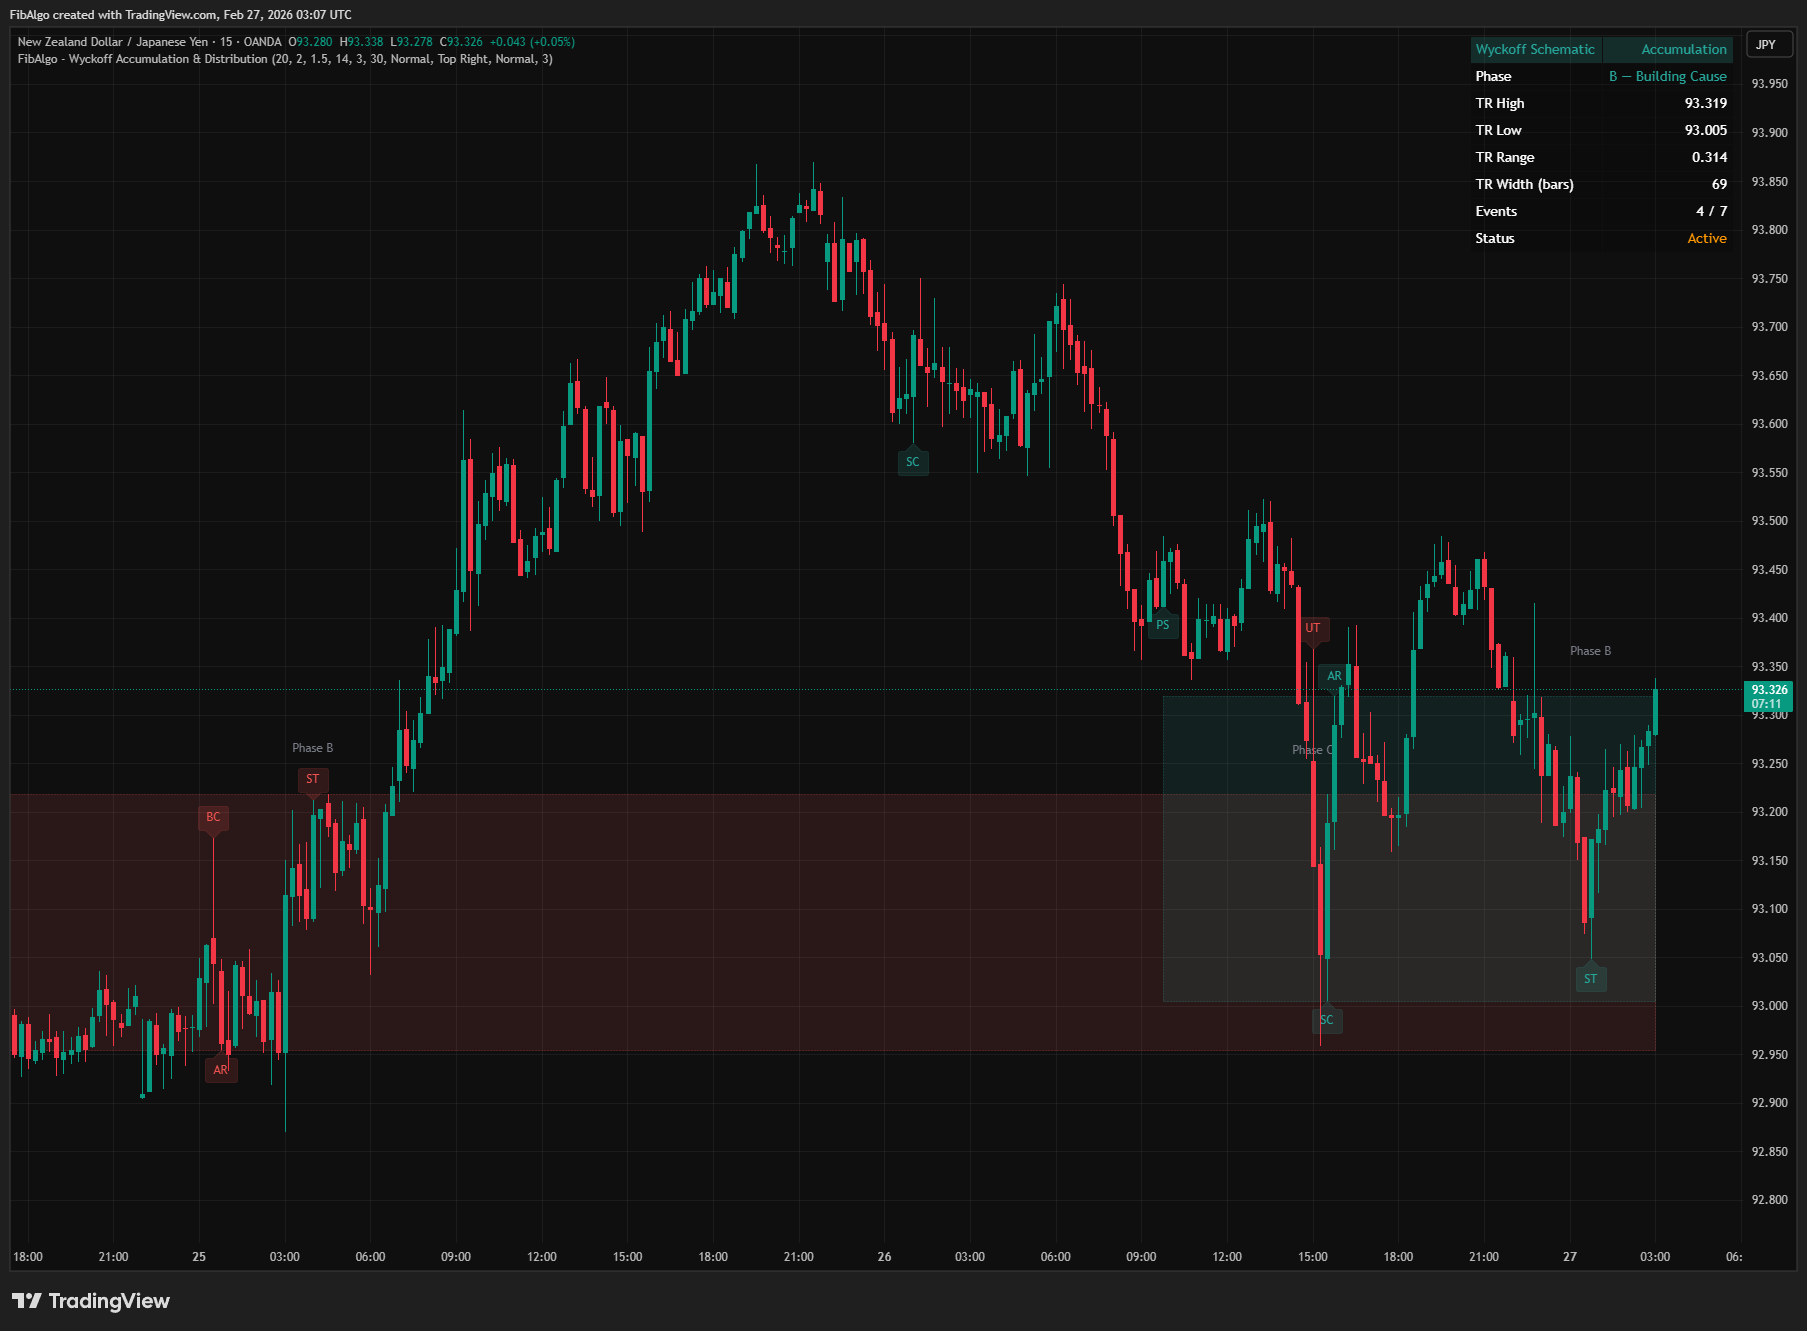 Free
FreeTradingView indicator that automatically detects Wyckoff Accumulation and Distribution schematics in real-time with phase classification (A through E).
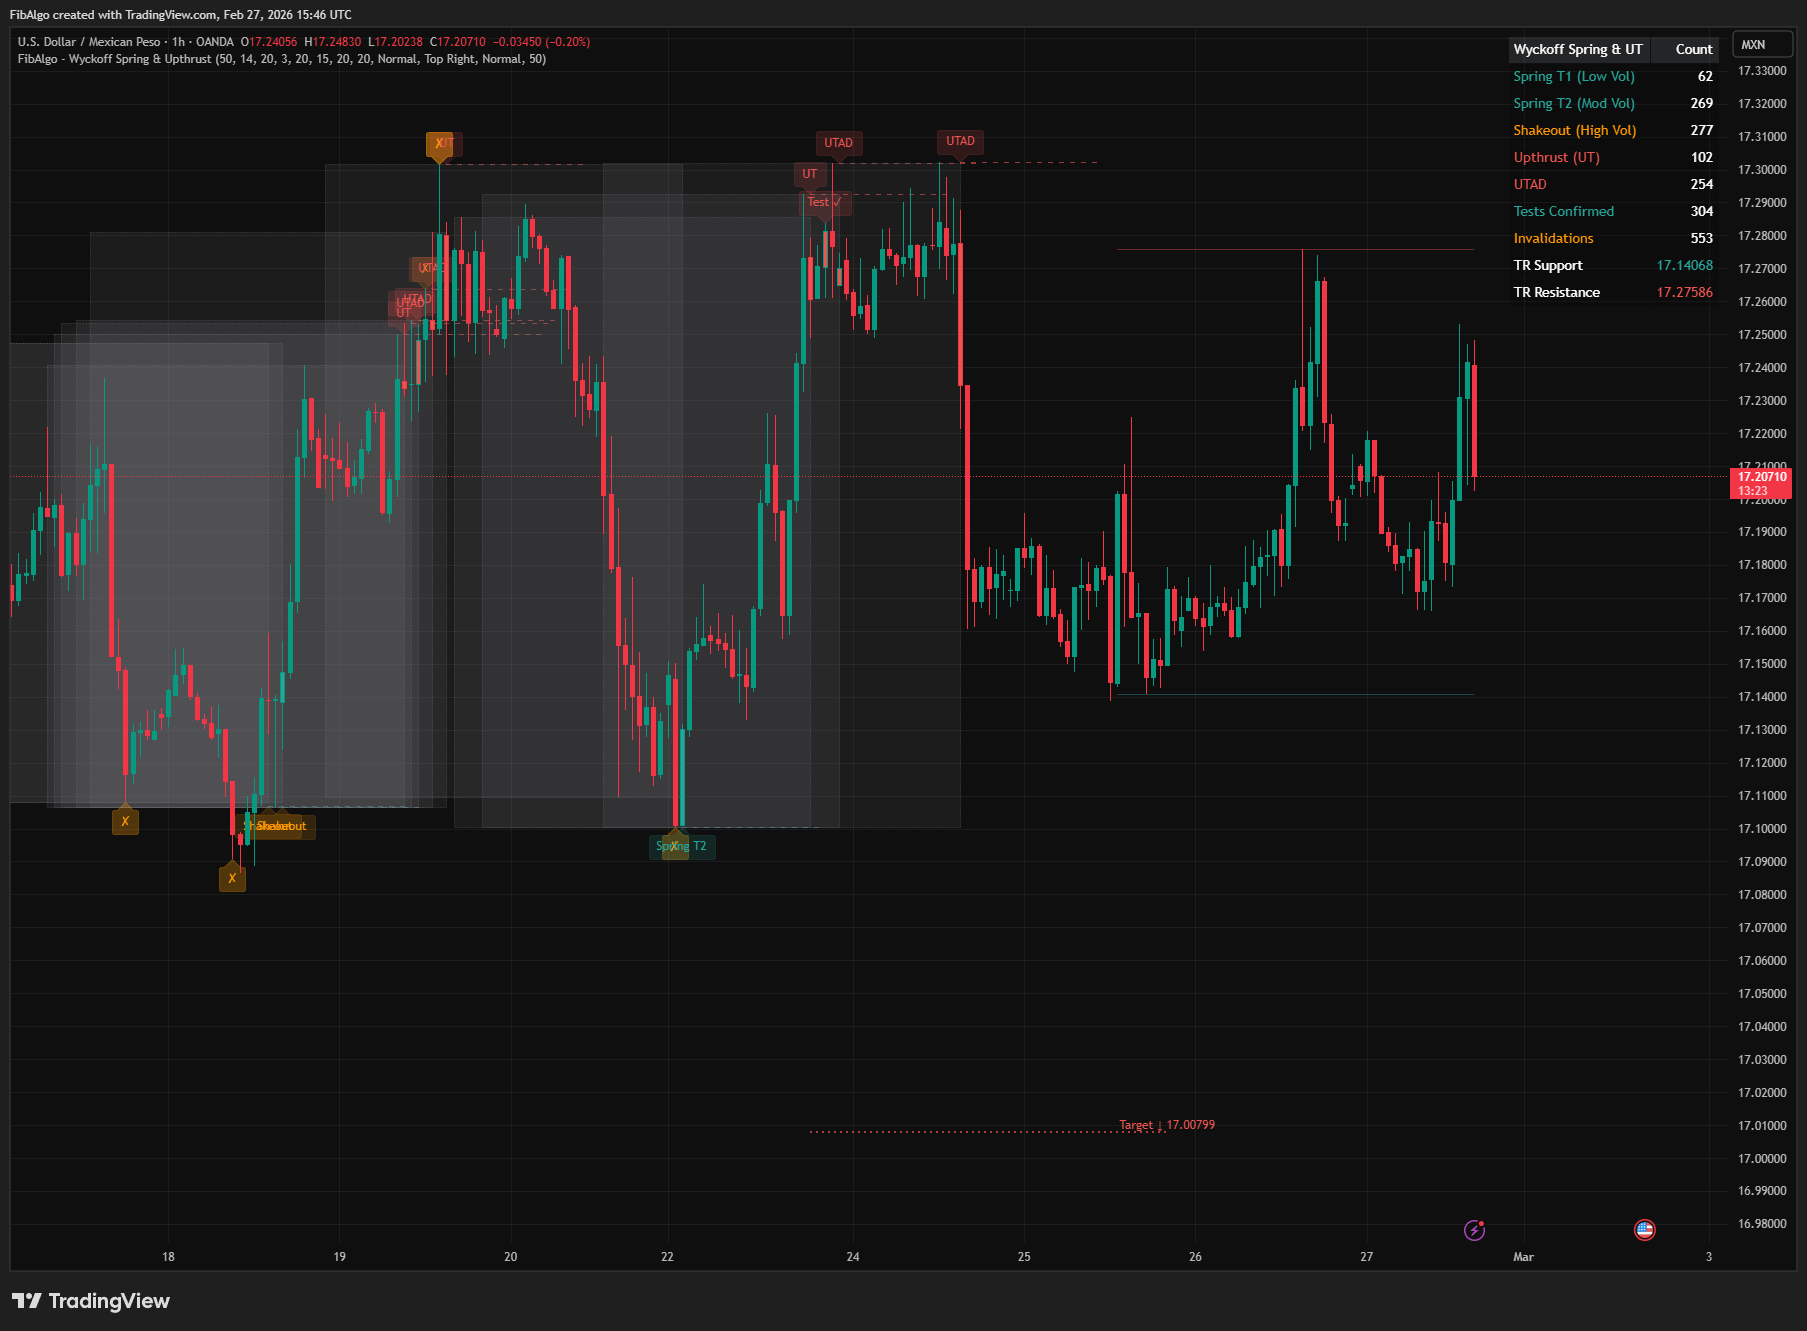 Free
FreeTradingView indicator that detects Wyckoff Springs and Upthrusts — the two most actionable reversal events with volume classification and price targets.
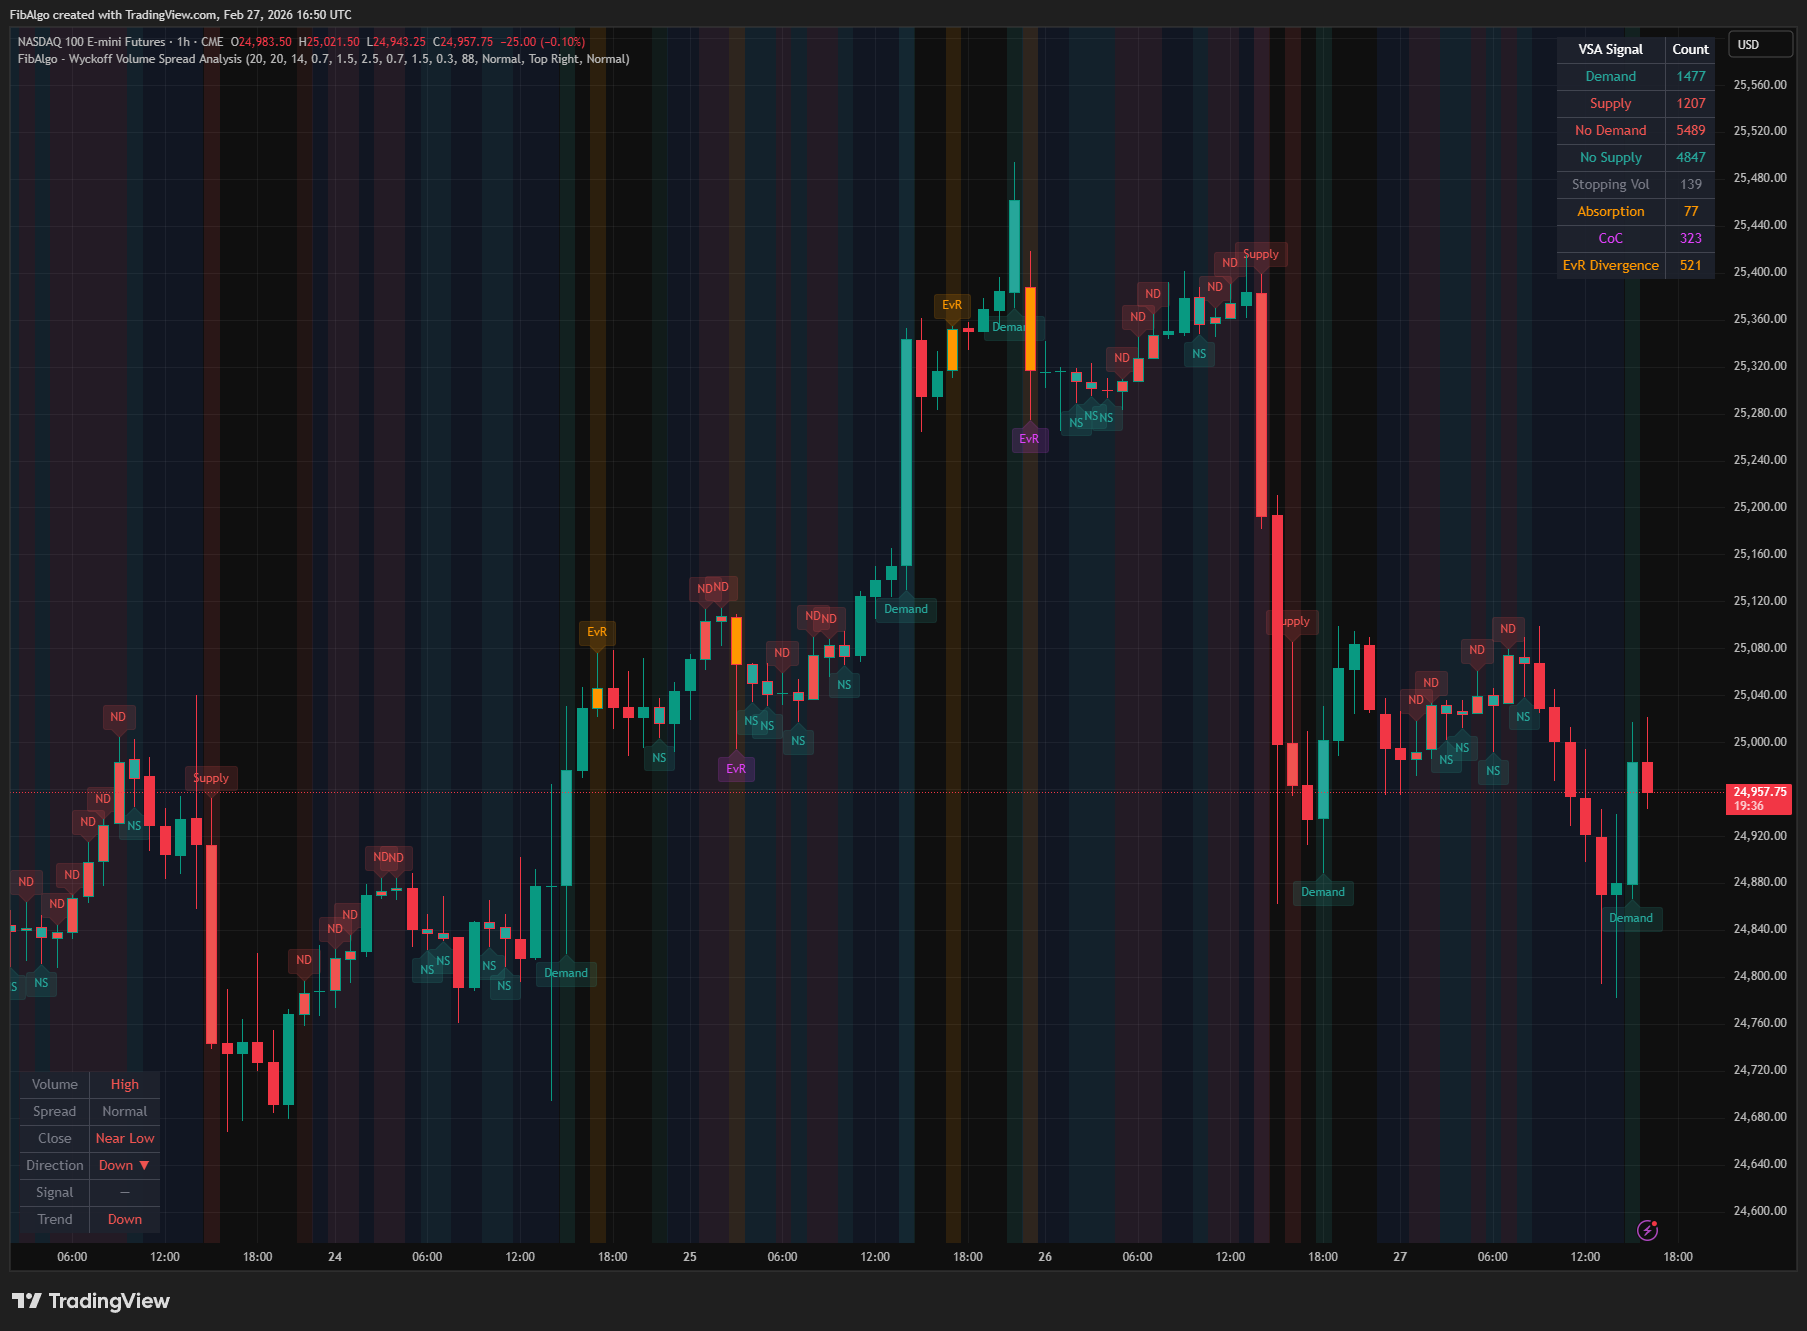 Free
FreeTradingView indicator that classifies bars into eight Wyckoff VSA signal types by analyzing volume, spread width, and close position.
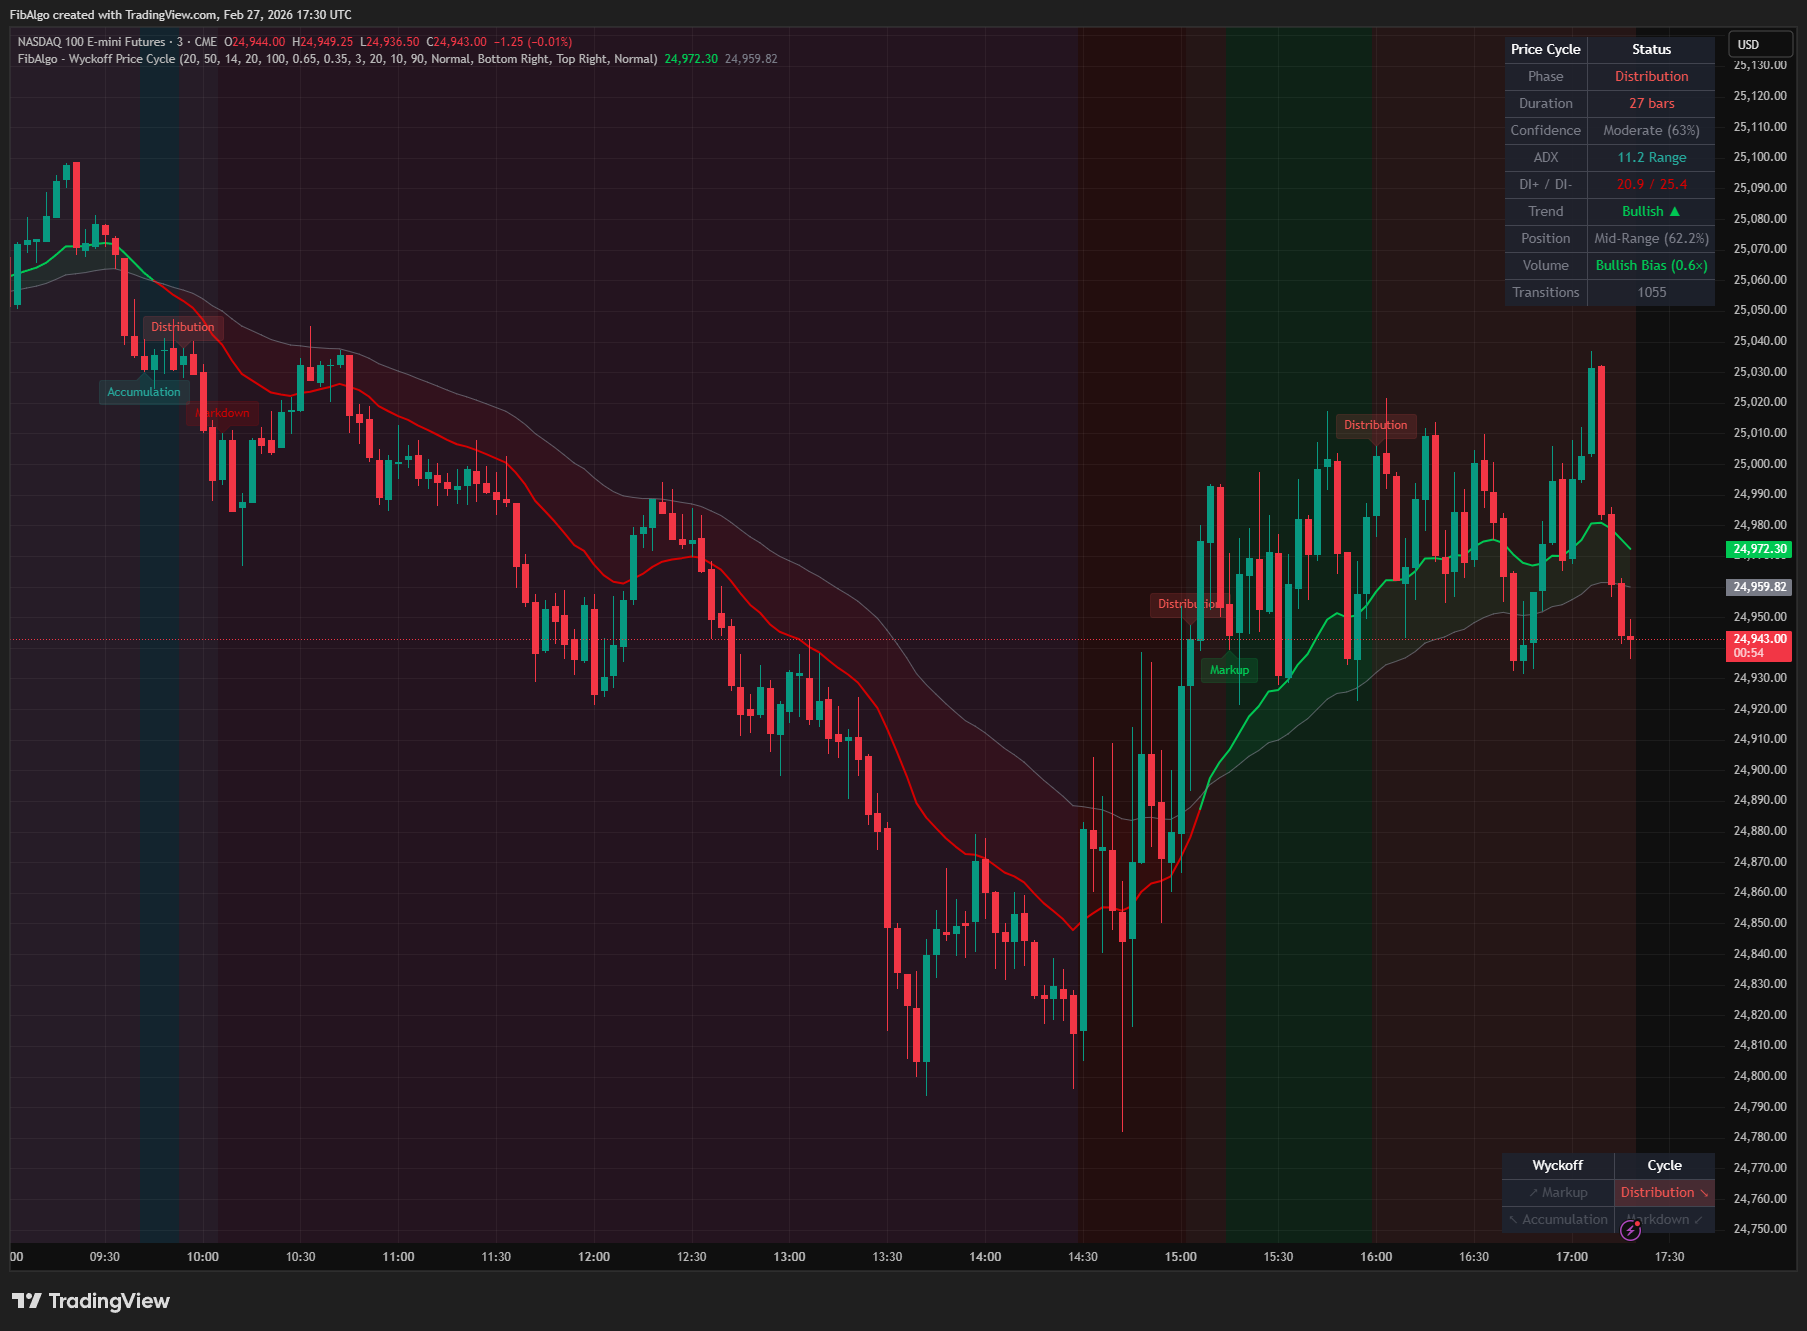 Free
FreeTradingView indicator that identifies the four Wyckoff market cycle phases — Accumulation, Markup, Distribution, and Markdown — in real-time.
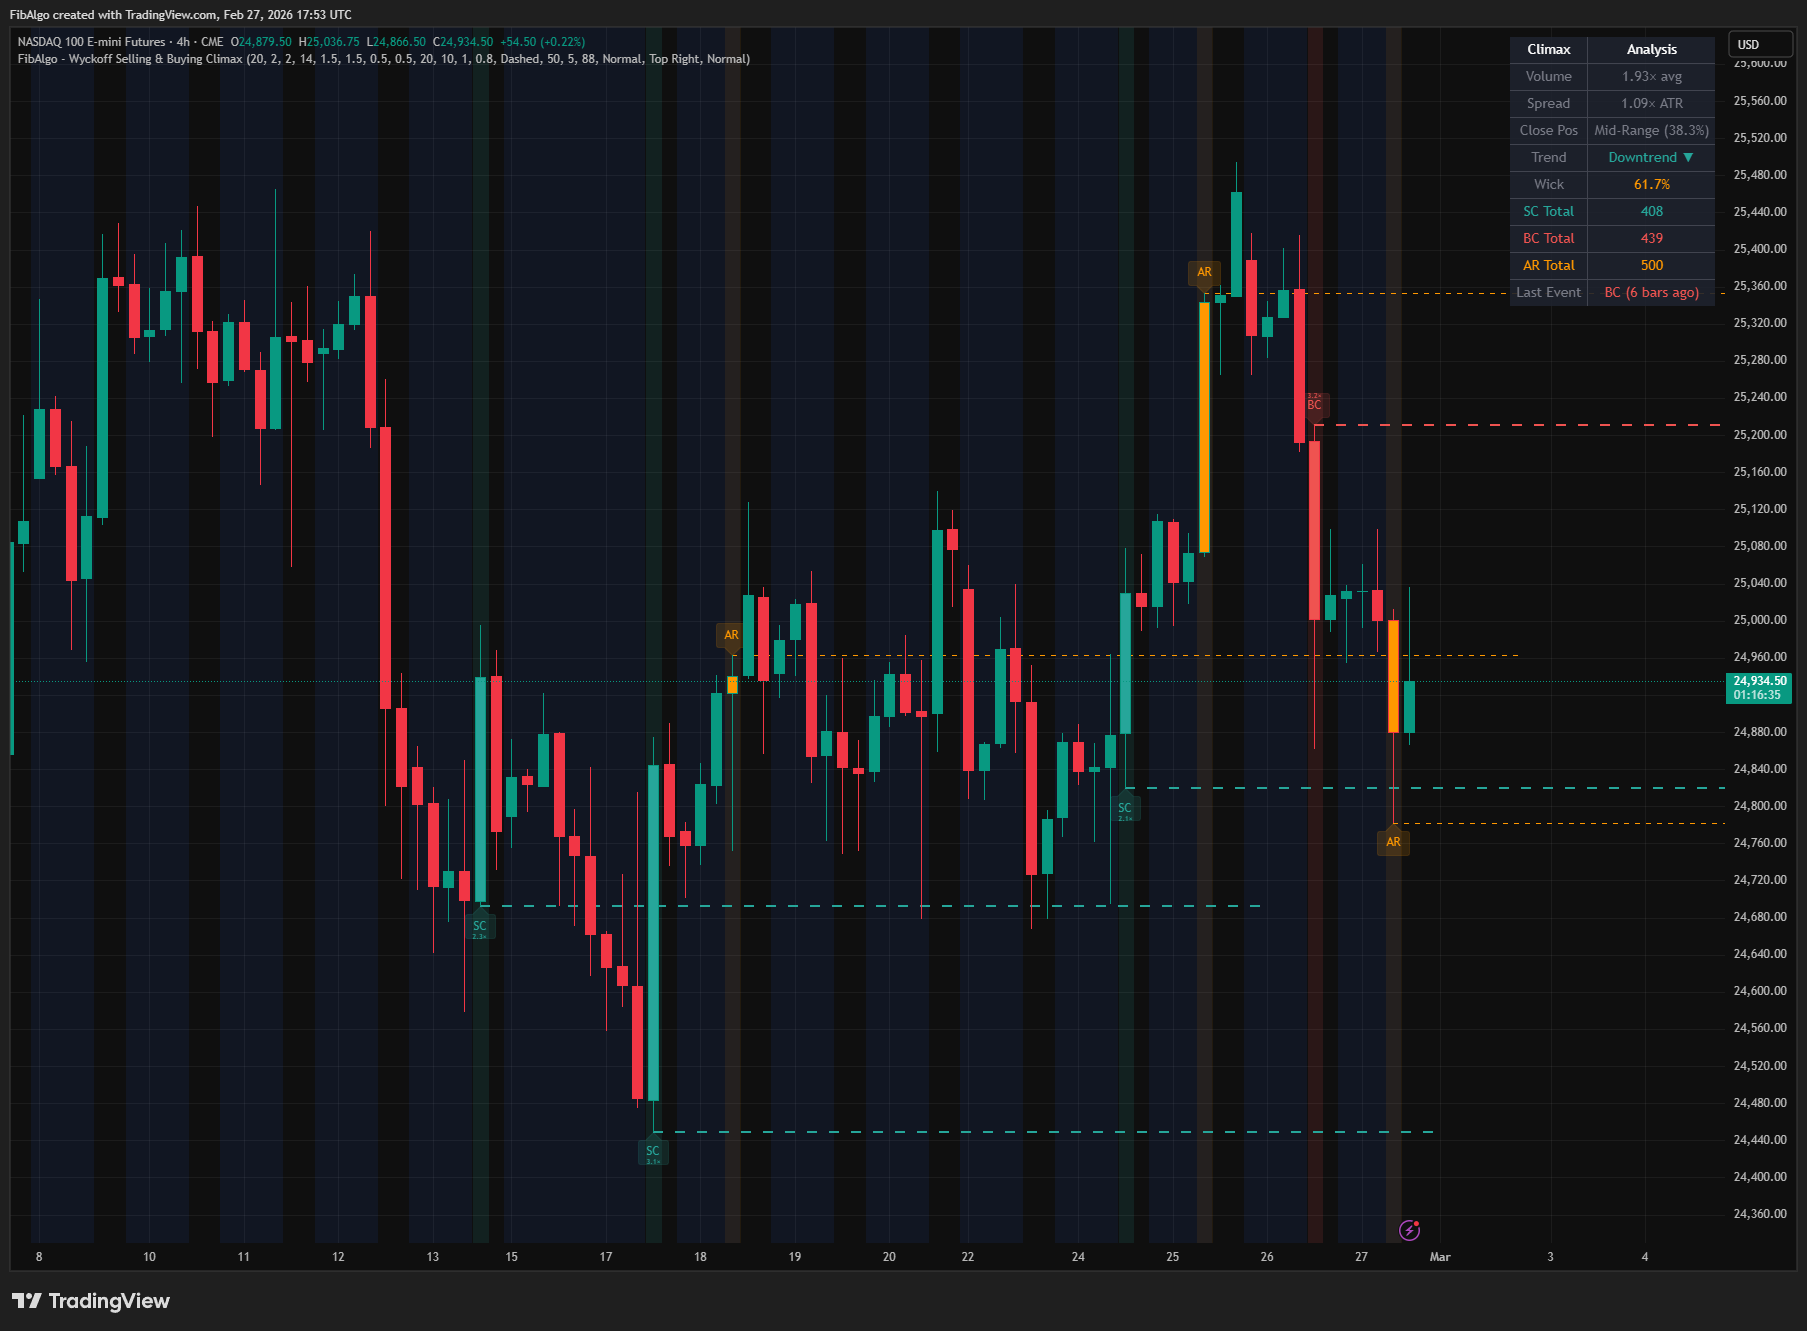 Free
FreeTradingView indicator that detects Wyckoff Selling and Buying Climax events — extreme institutional pressure signaling potential trend exhaustion.
 Free
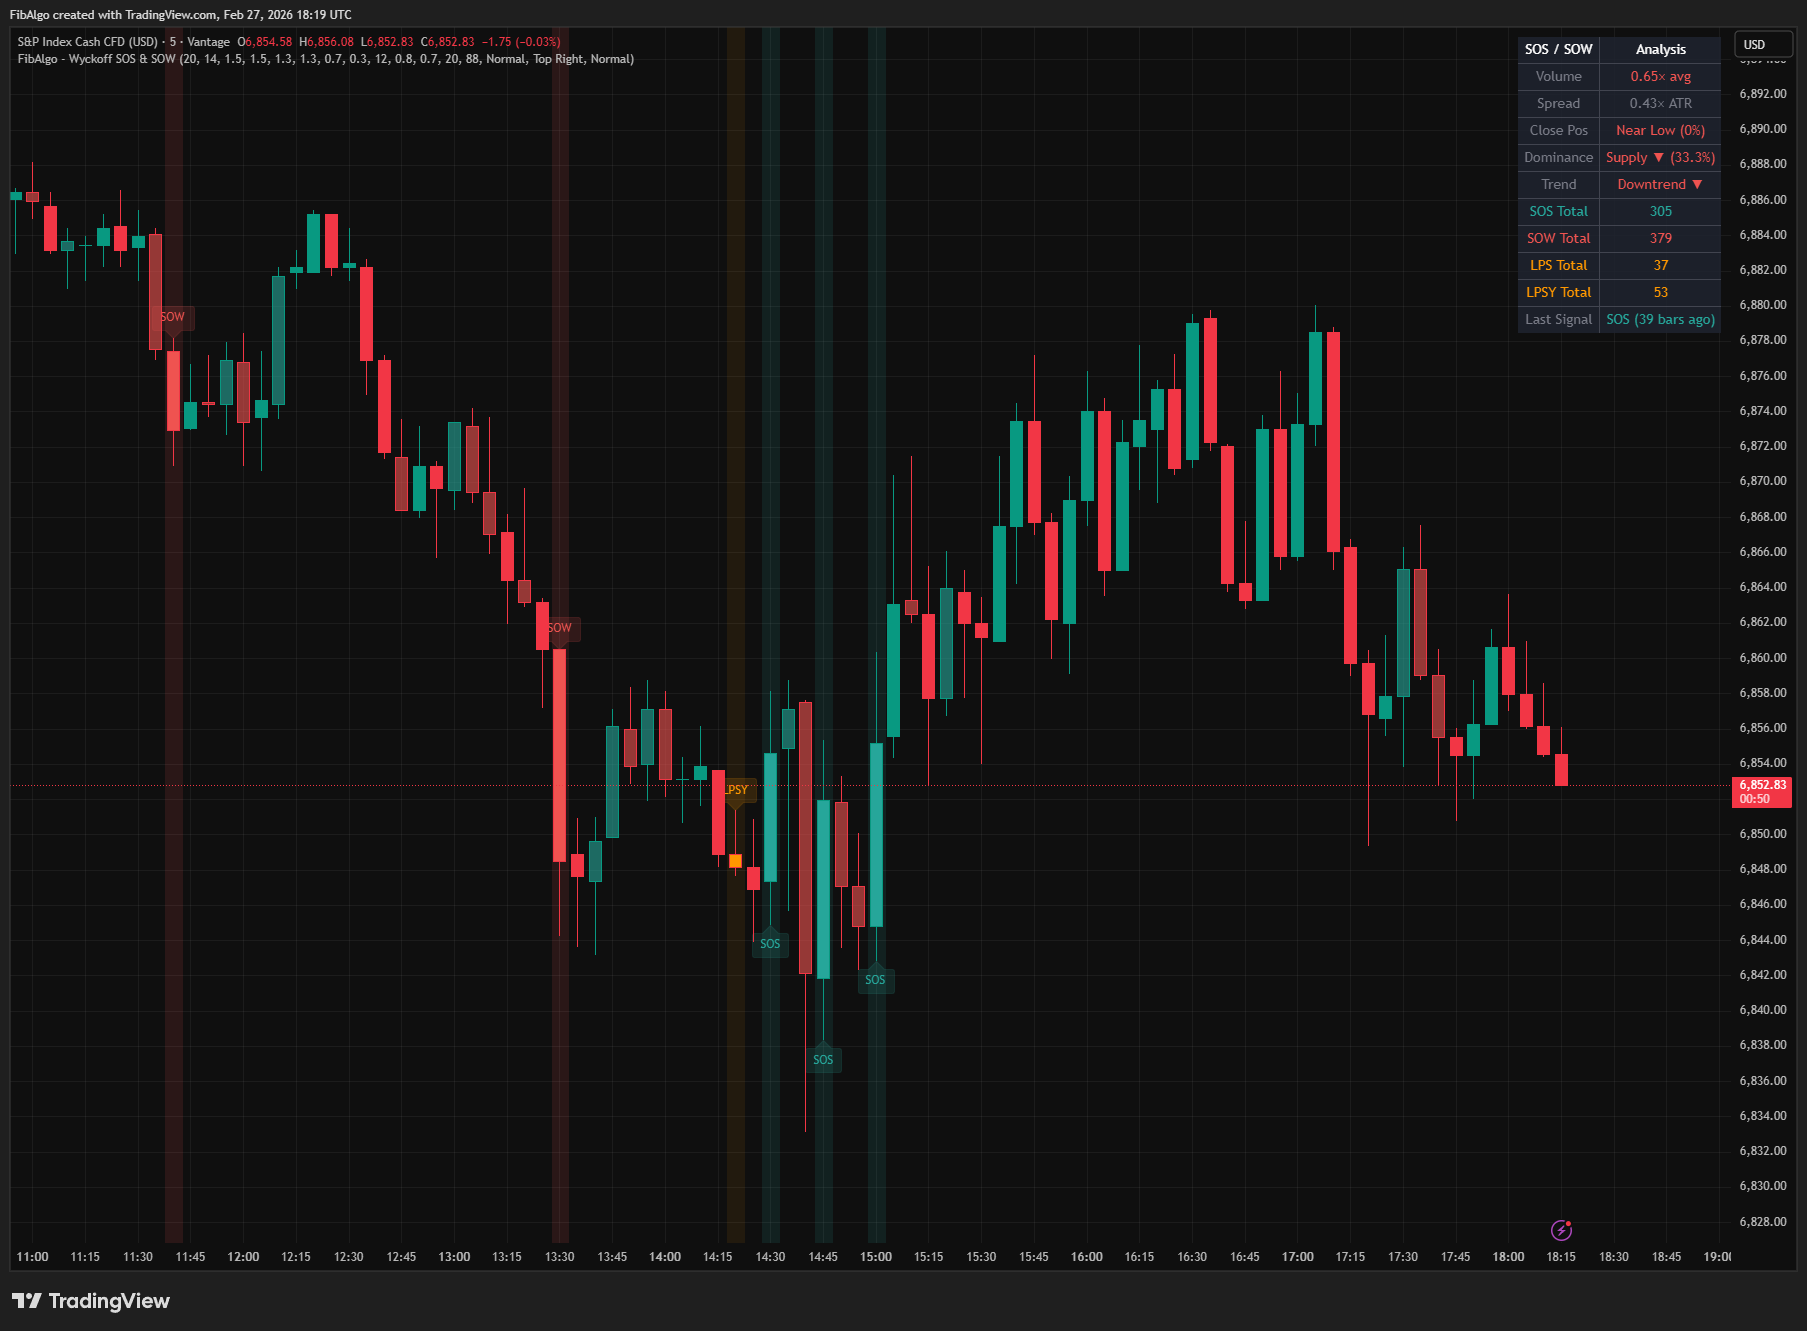
FreeTradingView indicator that identifies Wyckoff Sign of Strength (SOS) and Sign of Weakness (SOW) events with LPS/LPSY confirmations.
 Free
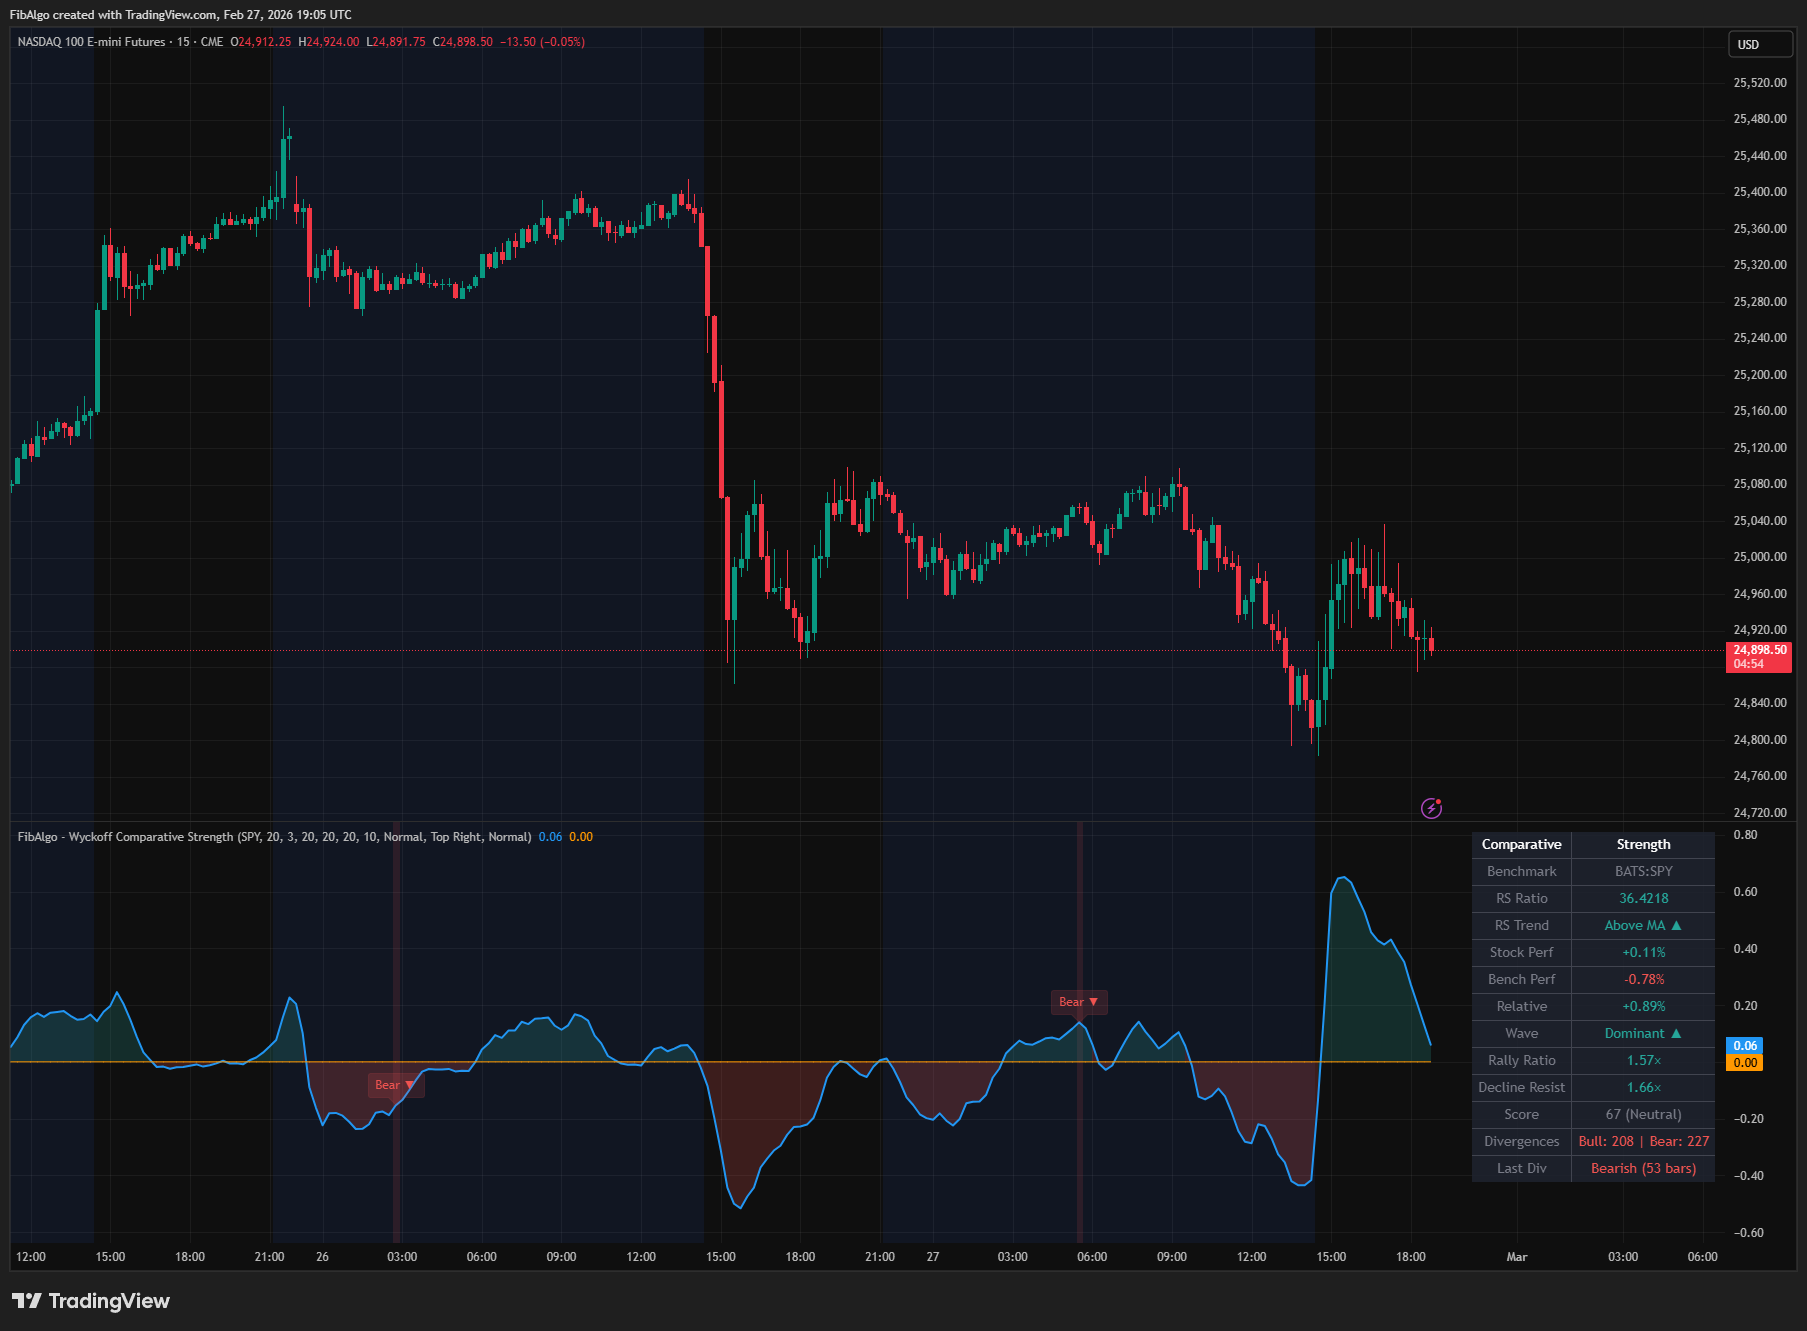
FreeTradingView indicator that measures Wyckoff Comparative Strength — relative performance vs benchmark with RS oscillator and divergence analysis.
 Free
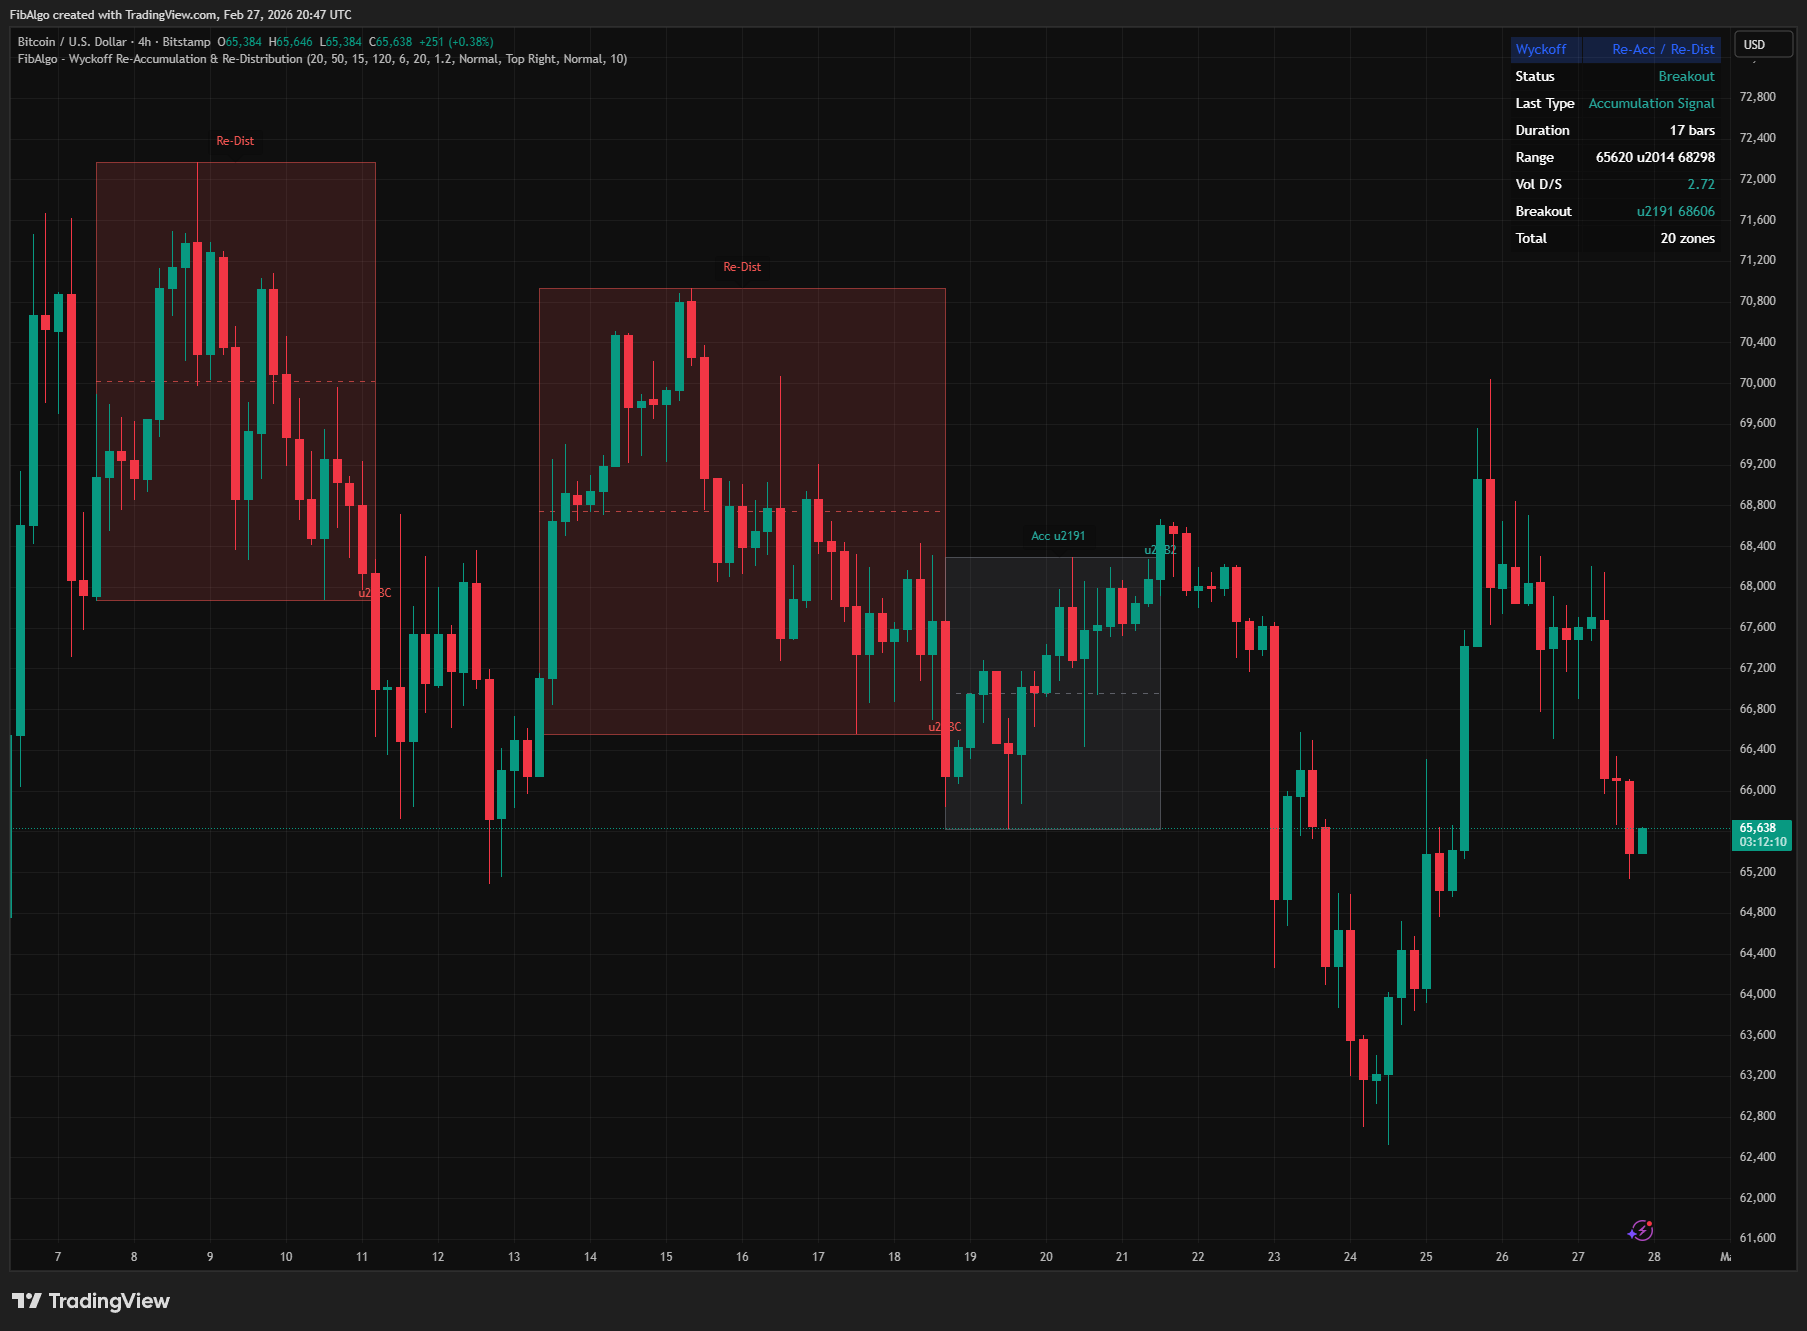
FreeTradingView indicator that detects Wyckoff Re-Accumulation and Re-Distribution patterns — consolidation pauses within established market trends.
Get access to our premium indicator suite with advanced Fibonacci analysis, smart trading signals, and multi-symbol screening.
View Plans