Overview
This indicator identifies and visualizes the three ICT Silver Bullet time windows — London (03:00–04:00 ET), NY AM (10:00–11:00 ET), and NY PM (14:00–15:00 ET) — then detects Fair Value Gaps (FVGs) that form within those windows. When price retraces to the Consequent Encroachment (CE) midline of a Silver Bullet FVG, an entry arrow is displayed. The indicator includes background shading for each window, real-time FVG fill tracking with percentage labels, configurable history management, and a summary statistics table.
Key Concepts
- Silver Bullet — A time-based ICT trading model that identifies specific one-hour windows during the trading day where institutional order flow creates high-probability Fair Value Gaps. The three windows are: London (03:00–04:00 ET), New York AM (10:00–11:00 ET), and New York PM (14:00–15:00 ET). The key principle is that FVGs forming within these windows carry higher significance because they coincide with periods of peak institutional activity and liquidity delivery.
- Fair Value Gap (FVG) — A three-candle pattern where a gap exists between the first candle's high/low and the third candle's low/high, with the middle candle being the displacement candle that creates the gap. In a bullish FVG, the current bar's low is above the bar-two-ago's high. In a bearish FVG, the current bar's high is below the bar-two-ago's low. FVGs represent inefficient price delivery that the market tends to revisit.
- Consequent Encroachment (CE) — The 50% midpoint of an FVG zone. ICT identifies the CE as the precision entry level within a Fair Value Gap — when price retraces to the CE, it represents the optimal entry point. A bullish CE touch (price pulling back down to the CE of a bullish FVG) signals a potential long entry. A bearish CE touch (price pushing up to the CE of a bearish FVG) signals a potential short entry.
- FVG Fill — The percentage of an FVG zone that price has retraced through. A 0% fill means price has not entered the zone. A 100% fill means price has completely traversed the zone from one side to the other. Tracking fill percentage helps determine whether an FVG is still "fresh" (low fill, likely to hold) or "consumed" (high fill, less likely to provide a reaction).
How It Works
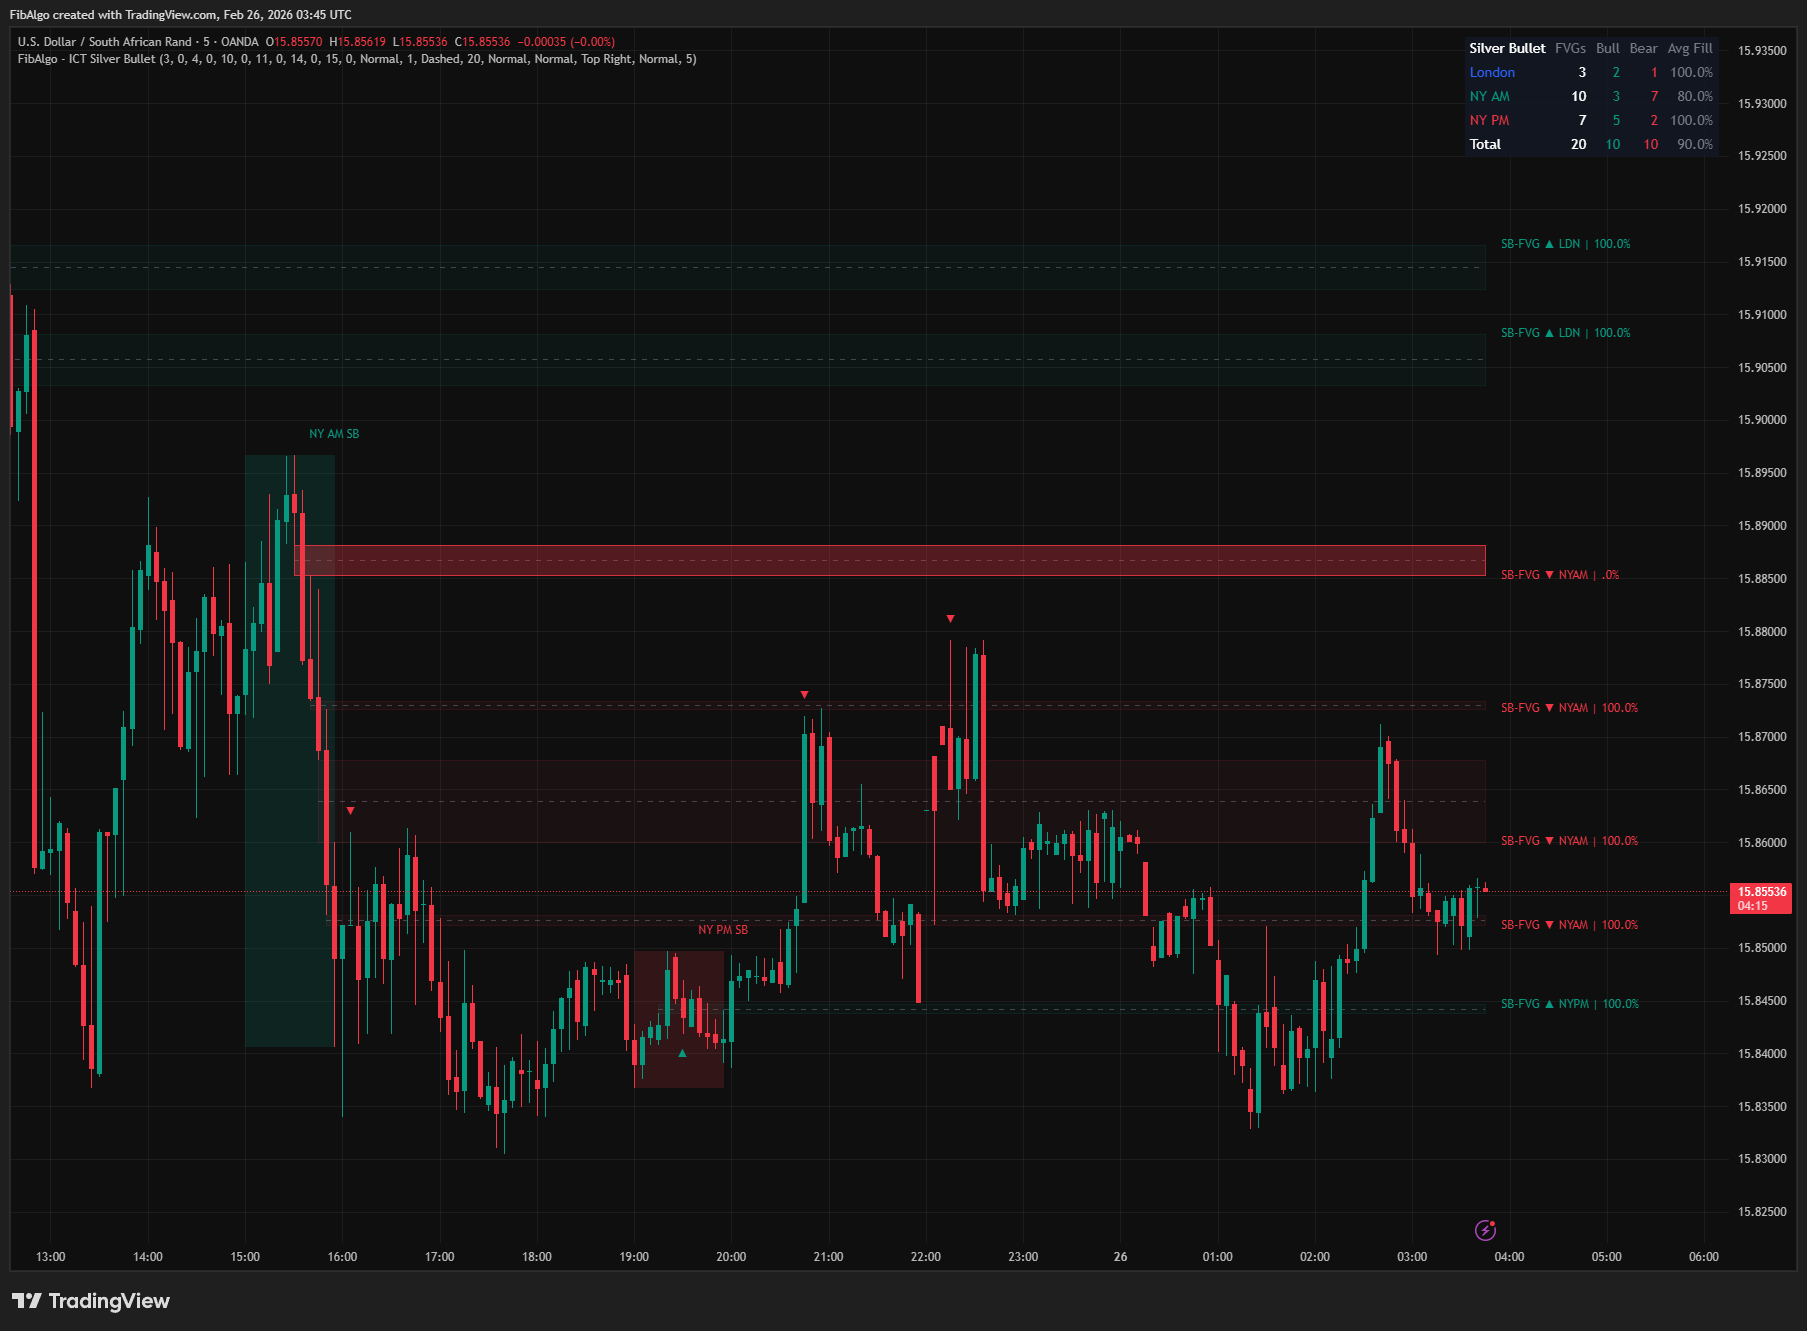
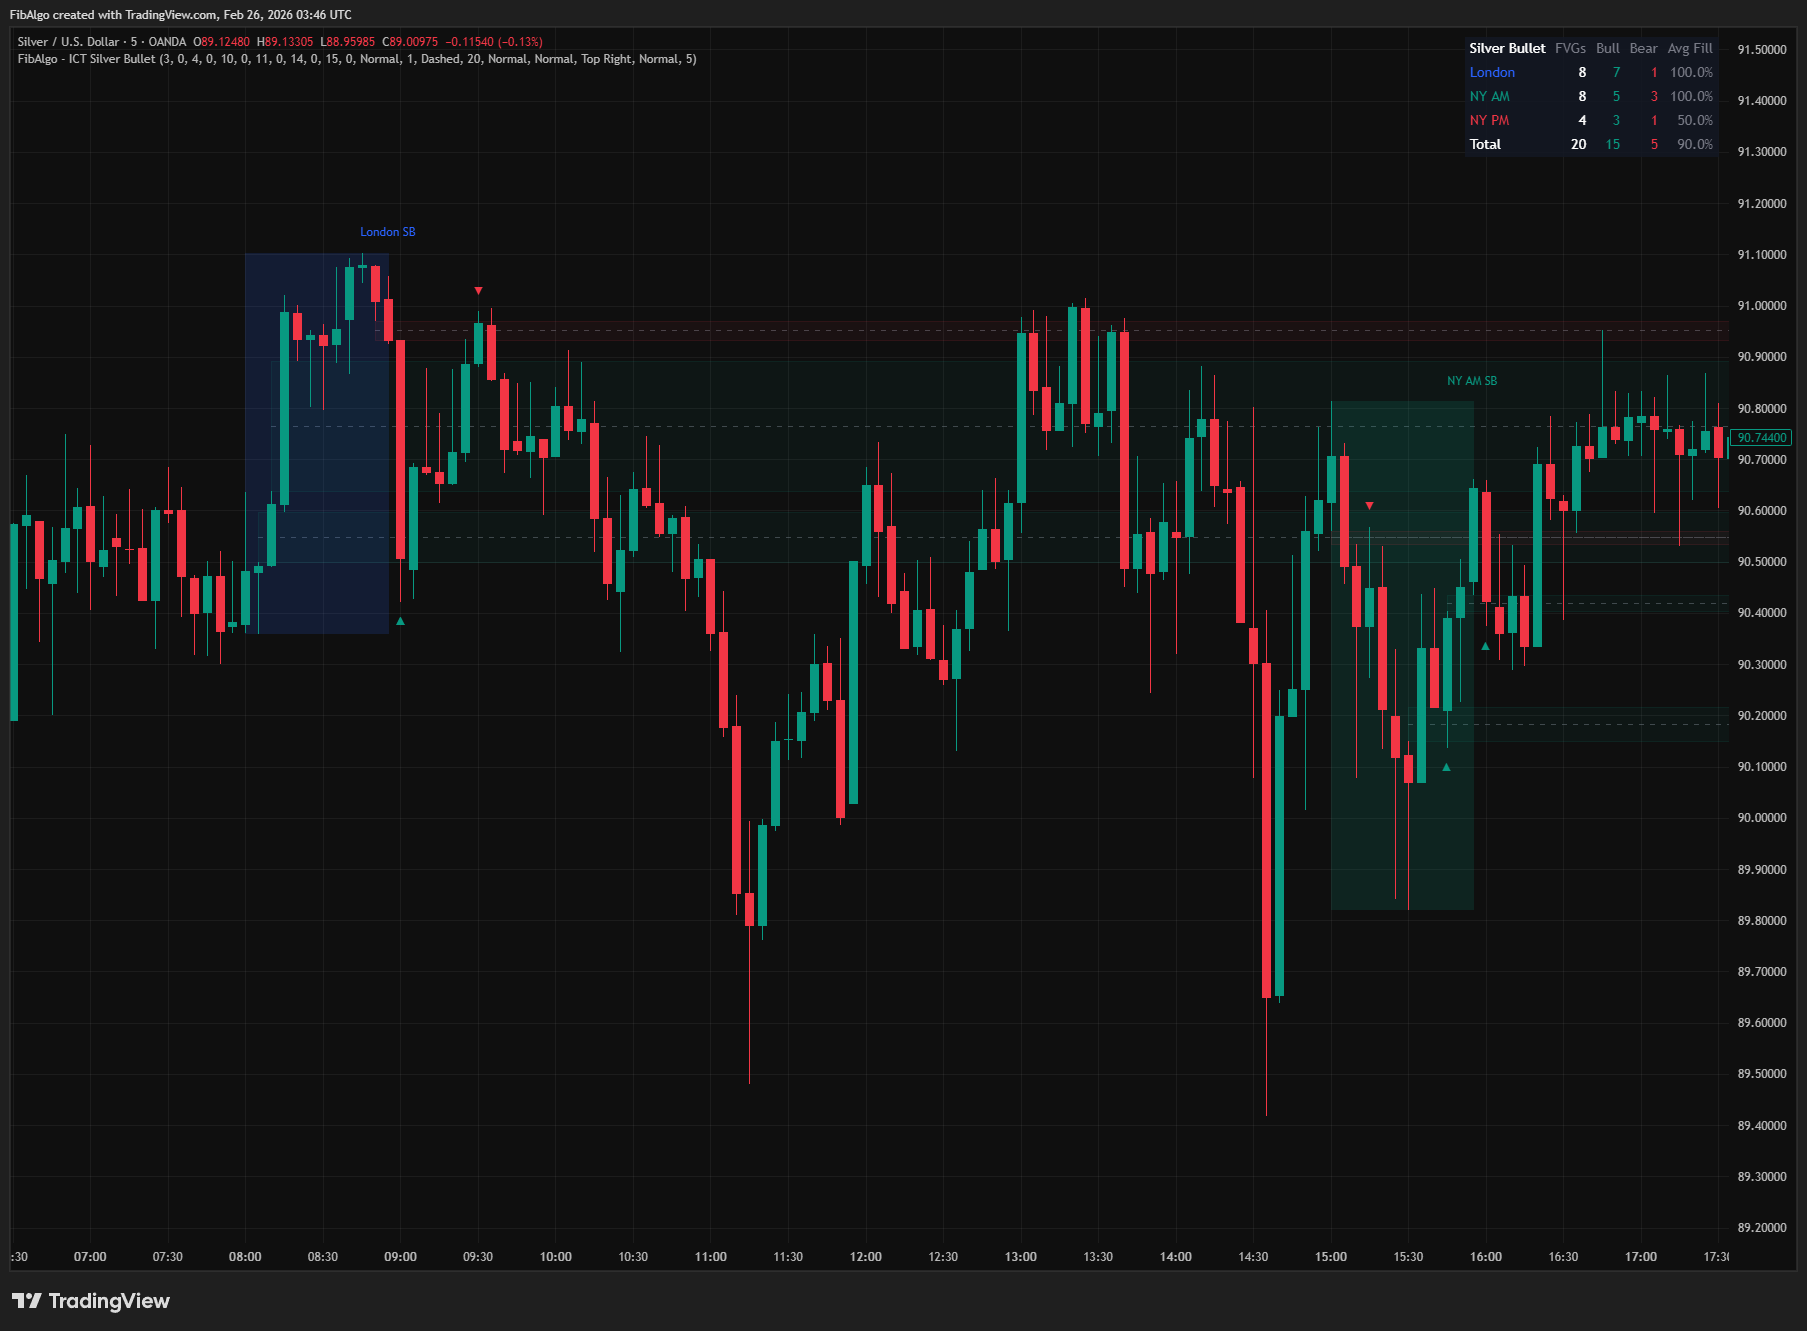
1. Silver Bullet Window Detection The indicator converts each bar's timestamp to Eastern Time (America/New_York) and checks whether the current bar falls within any of the three Silver Bullet windows. Default windows follow ICT's exact specifications: London 03:00–04:00, NY AM 10:00–11:00, NY PM 14:00–15:00. All times are ET regardless of the chart's timezone setting. Each window can be independently enabled/disabled, and custom start/end times can be configured for each window. 2. Window Background Shading When a Silver Bullet window opens (the first bar to enter the window), a color-coded background box is created spanning the window's high-to-low range. As new bars arrive within the window, the box extends rightward and its top/bottom adjust to capture the full price range of the window. An optional label identifies each window ("London SB", "NY AM SB", "NY PM SB"). Window history is managed by day count — older windows beyond the configured history limit are automatically removed. 3. FVG Detection Inside Windows On each bar, the indicator checks whether the middle candle (bar[1]) of a potential 3-candle FVG pattern was inside a Silver Bullet window. If yes, it checks for the standard FVG gap: Bullish FVG requires the current bar's low to be above the bar-two-ago's high AND the middle candle to be bullish (close > open). Bearish FVG requires the current bar's high to be below the bar-two-ago's low AND the middle candle to be bearish (close < open). Qualifying FVGs are drawn as colored boxes with an optional CE midline.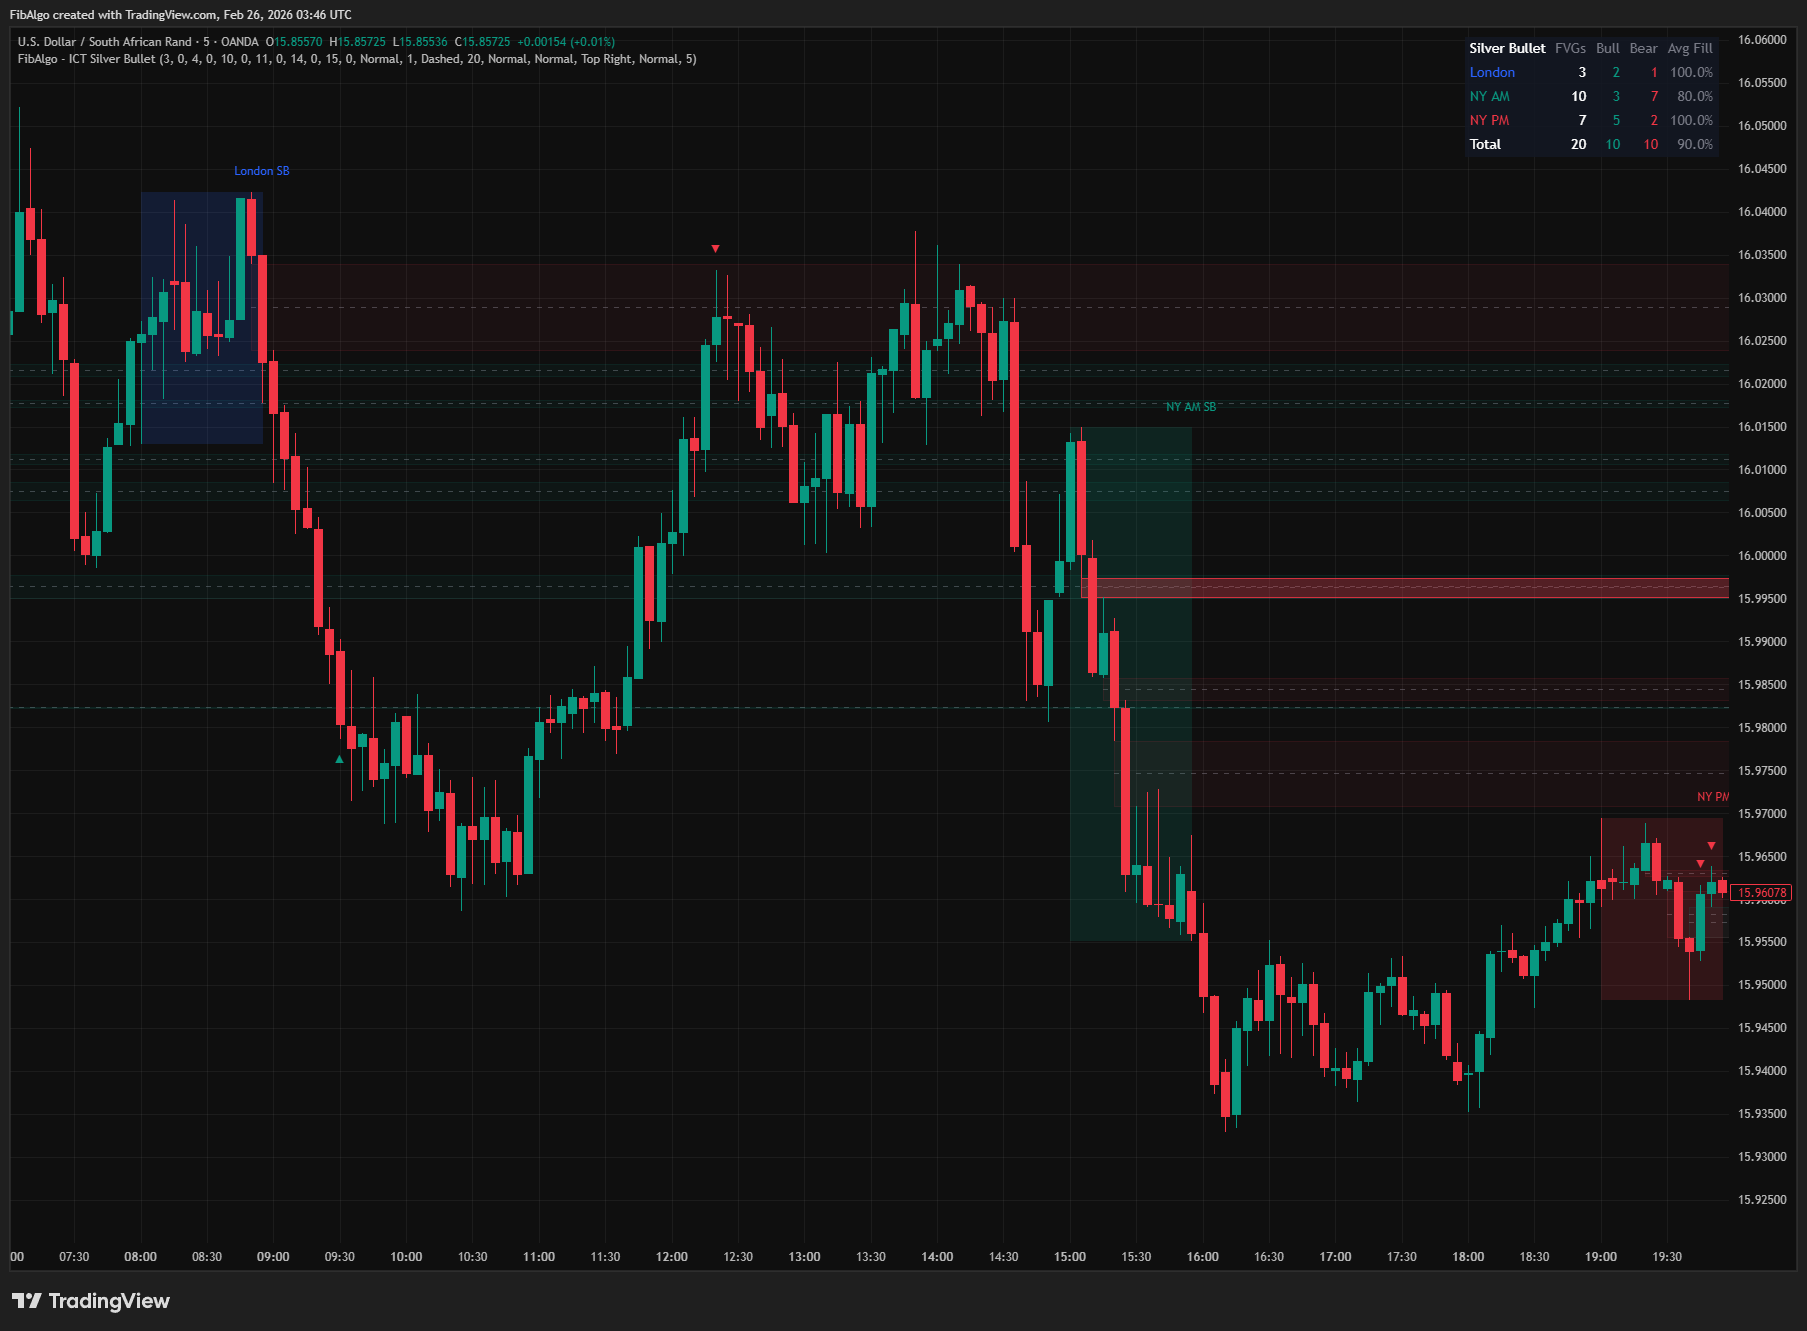
All alerts include the symbol and timeframe in the message and use once-per-bar frequency. A master "Enable Alerts" toggle disables all alert processing when off.
7. Summary Table A real-time statistics table breaks down FVG data by window. For each window (London, NY AM, NY PM) and in total, the table shows: FVG count, Bullish count, Bearish count, and Average Fill percentage. This provides a quick overview of which Silver Bullet windows are producing the most FVGs and how those FVGs are being filled.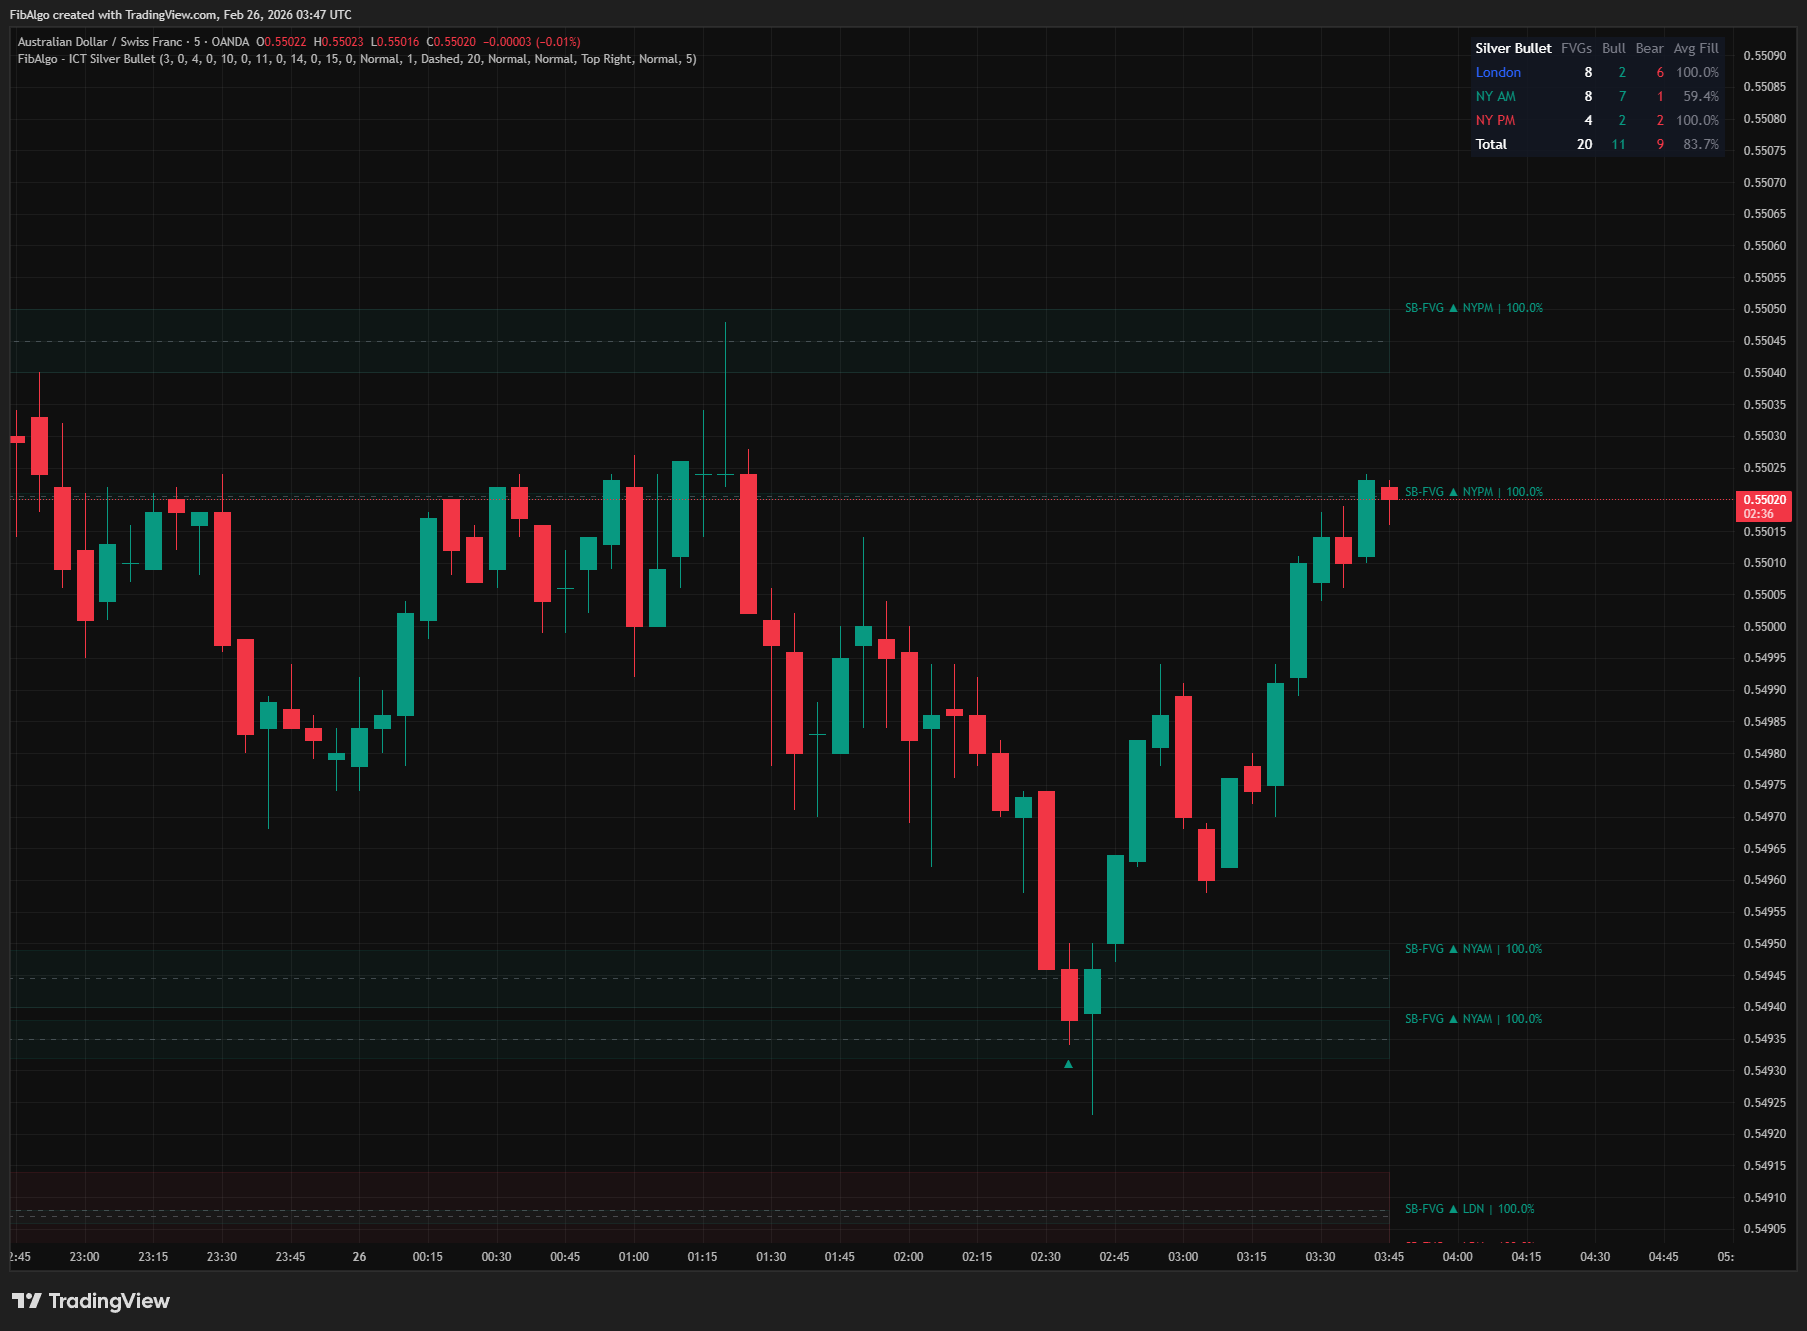
Features
- Three ICT Silver Bullet Windows — London (03:00–04:00 ET), NY AM (10:00–11:00 ET), and NY PM (14:00–15:00 ET) with independent enable/disable toggles. All times are calculated in Eastern Time regardless of chart timezone.
- Custom Window Times — Override default start/end times for each window independently. Configure hour and minute precision for each boundary. Useful for adapting to specific instruments or personal session preferences.
- Window Background Shading — Color-coded semi-transparent boxes highlight the price range during each Silver Bullet window. London (blue), NY AM (green), NY PM (red) — all colors independently configurable with transparency.
- FVG Detection Inside Windows — Identifies standard 3-candle Fair Value Gaps where the middle candle falls within a Silver Bullet window. Only FVGs with directionally confirming middle candles (bullish close for bull FVG, bearish close for bear FVG) qualify.
- CE Midline Visualization — Optional 50% midpoint line for each FVG. Configurable color and style (Solid/Dashed/Dotted). Marks the Consequent Encroachment level — the precision entry point per ICT methodology.
- Real-Time Fill Tracking — Each FVG displays its fill percentage, updating on every bar. Track which FVGs are fresh (low fill) vs. consumed (high fill). Fully filled FVGs optionally fade to near-transparent.
- CE Touch Entry Arrows — Automatic entry signal when price first touches the CE of a Silver Bullet FVG. One-shot per FVG (no re-triggering). Green up-arrows for bullish entries, red down-arrows for bearish entries.
- FVG Extension — Optionally extend FVG boxes and CE lines rightward to the current bar, keeping active zones visible as price action develops.
- History Management — Configurable FVG history count (1–50) and window history by days (1–30). Oldest objects are automatically removed with all associated drawings to stay within TradingView limits.
- Summary Statistics Table — Real-time breakdown of FVG counts, bullish/bearish split, and average fill per window. Provides at-a-glance analytics for each Silver Bullet session.
- 3 Alert Conditions — Window opened, FVG formed, and CE touch entry. Each alert has an independent toggle and includes symbol, timeframe, direction, and window name. Master enable switch for all alerts.
- Full Color Customization — Independent color settings for each window's background, FVG boxes (bull/bear), CE lines, and entry arrows. All visual elements can be independently enabled/disabled.
How to Use
- Identify Active Windows: Enable the window background shading to see when Silver Bullet sessions are active. The colored boxes immediately highlight the relevant time periods on your chart. Focus your analysis on price action within these windows.
- Watch for FVG Formation: During an active Silver Bullet window, look for FVG boxes to appear. These represent institutional gaps created during high-probability time windows. Bullish FVGs (green) form during upward displacement, bearish FVGs (red) during downward displacement.
- Enter at CE Touch: When price retraces to the CE midline of a Silver Bullet FVG, the indicator displays an entry arrow. For bullish FVGs, look for the green up-arrow (▲) as a potential long entry. For bearish FVGs, look for the red down-arrow (▼) as a potential short entry. The CE is the optimal entry level per ICT methodology.
- Monitor Fill Percentage: Use the fill percentage on FVG labels to assess zone freshness. FVGs below 50% fill are relatively fresh and more likely to produce a reaction at the CE. FVGs above 80% fill have been largely consumed and may have less holding power. Fully faded (100% fill) FVGs indicate the gap has been completely filled.
- Compare Windows in the Table: The summary table shows which windows are producing the most FVGs and their fill rates. If NY AM consistently produces more FVGs with lower average fill, that window may be offering better setups in the current market conditions.
- Use on Appropriate Timeframes: Silver Bullet windows are one hour each. Use 1m–15m charts to capture multiple candles within each window for FVG formation. On higher timeframes (1H+), each window contains only one or zero candles, making FVG detection within windows impractical.
- Combine with ICT Framework: Silver Bullet FVGs are most effective when combined with higher-timeframe bias (Daily/4H direction), prior session liquidity sweeps, Market Structure, Premium/Discount zones, and other ICT concepts. The Silver Bullet itself identifies WHERE and WHEN — use other tools to confirm WHY (directional bias).
Limitations
- Silver Bullet windows are fixed one-hour periods. On timeframes of 1H or higher, each window may contain only one candle or zero candles, making FVG detection within windows unreliable. Use this indicator on timeframes of 30m or lower for meaningful results.
- FVG detection requires the middle candle (bar[1]) to be inside the Silver Bullet window. If a window opens mid-candle on higher timeframes, the candle may not register as being inside the window depending on its open time.
- The CE touch entry is a one-shot signal per FVG. If price oscillates around the CE, only the first touch generates an arrow. Subsequent touches are not signaled even if they represent valid re-entry opportunities.
- Custom window times do not support midnight-crossing windows (e.g., 23:00 to 01:00). Both start and end times must be within the same calendar day in ET.
- Fill tracking measures the deepest penetration into the FVG zone. Fill percentage only increases — it never decreases even if price moves away from the zone. A 60% fill means price once reached 60% of the zone, not that it is currently at that level.
- Entry arrows do not confirm trade direction — they only indicate that price has reached the CE of a Silver Bullet FVG. Use higher-timeframe bias, market structure, and other confluence factors to determine whether the setup aligns with the prevailing trend direction.
- Drawing object limits: TradingView allows 500 boxes, 500 lines, and 500 labels. Each window uses 1 box + 1 label. Each FVG uses up to 3 objects (box + CE + label). Each CE touch entry creates 1 additional label. With default settings (20 FVG history, 5 days of windows), usage stays well within limits.
- The summary table counts only FVGs currently in memory (limited by FVG History Count). It does not represent all-time statistics — reducing the history count will reduce the numbers shown in the table.
Tags
#Sessions & Time#Smart Money#Signals