Overview
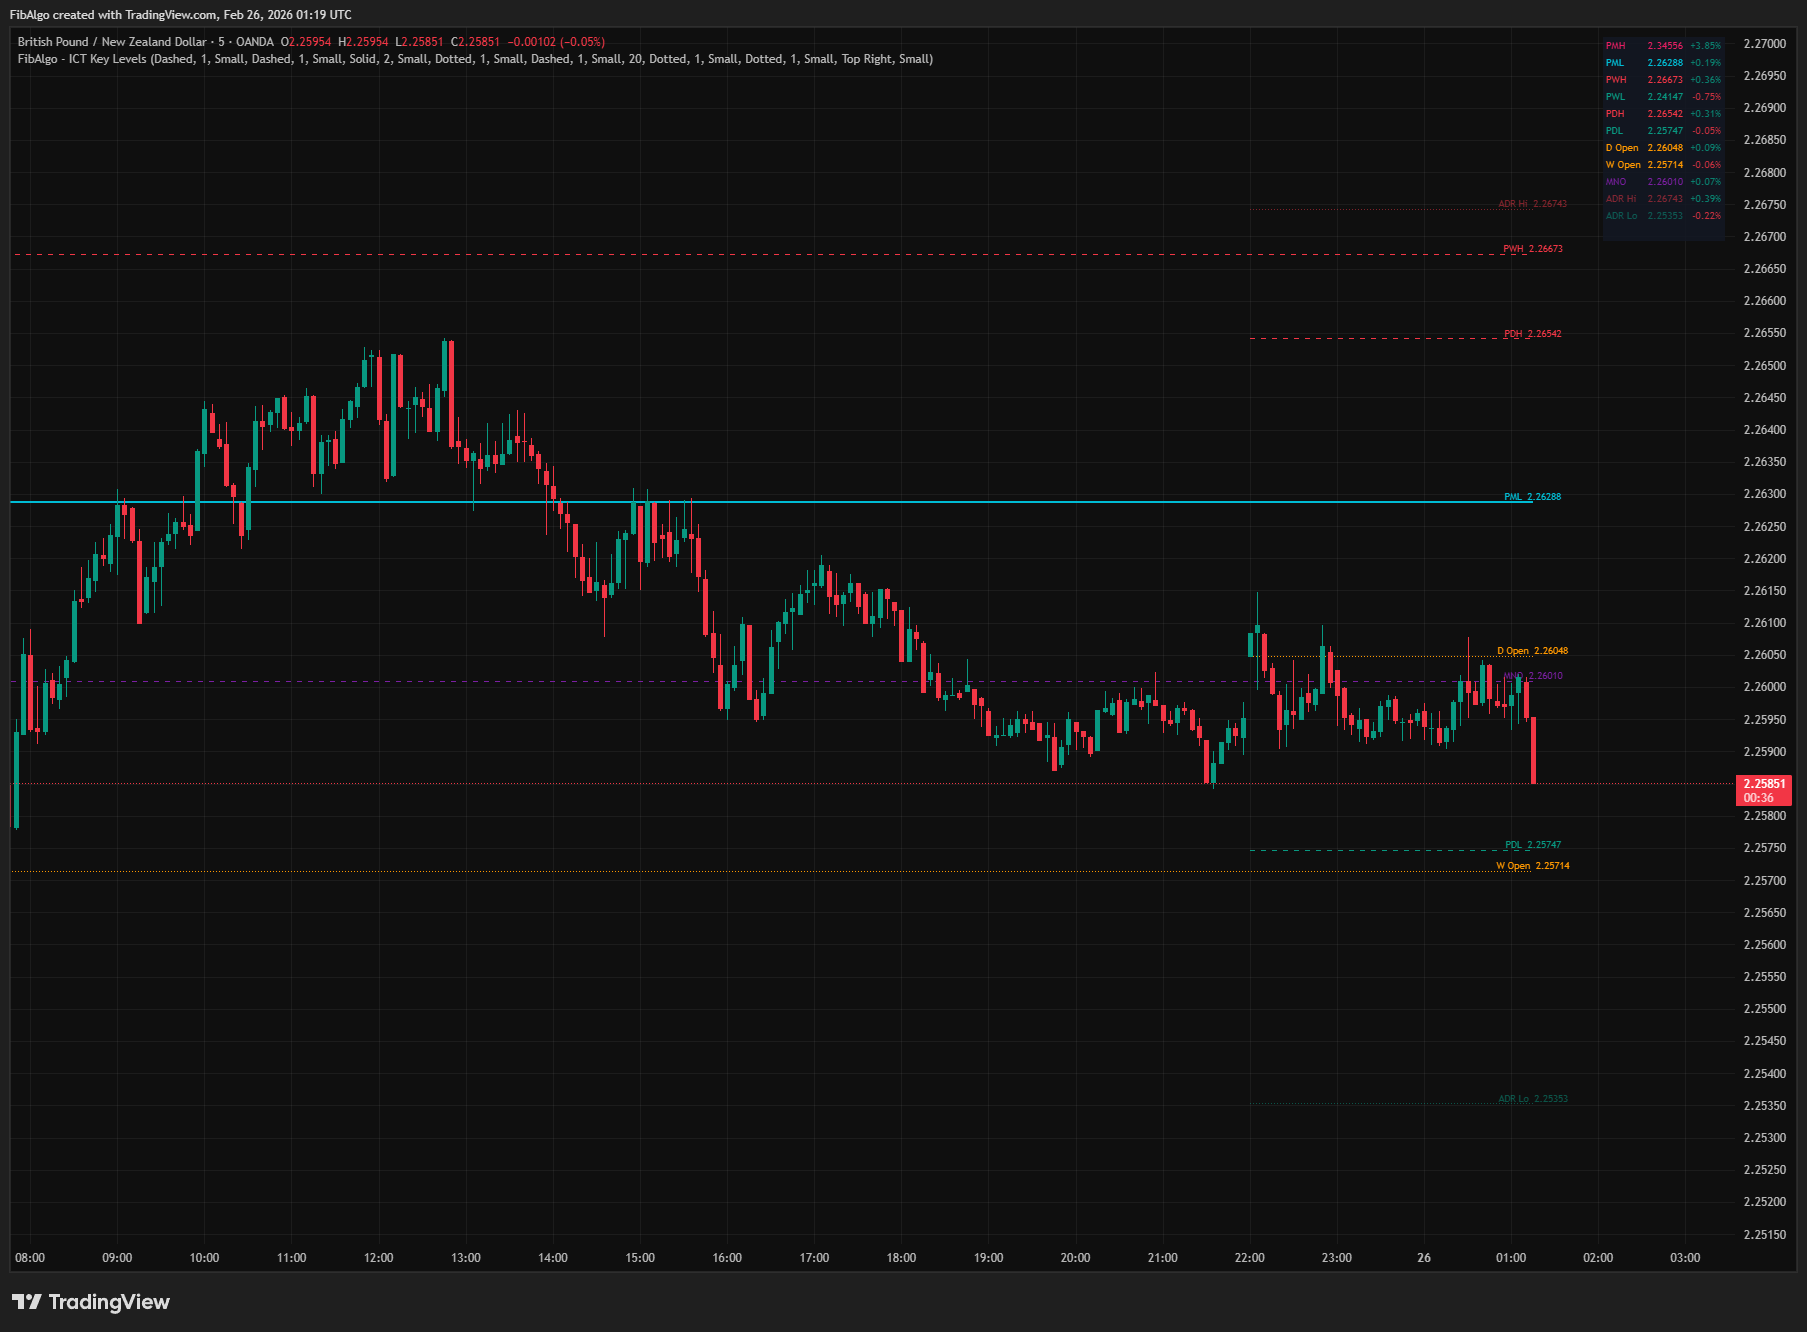
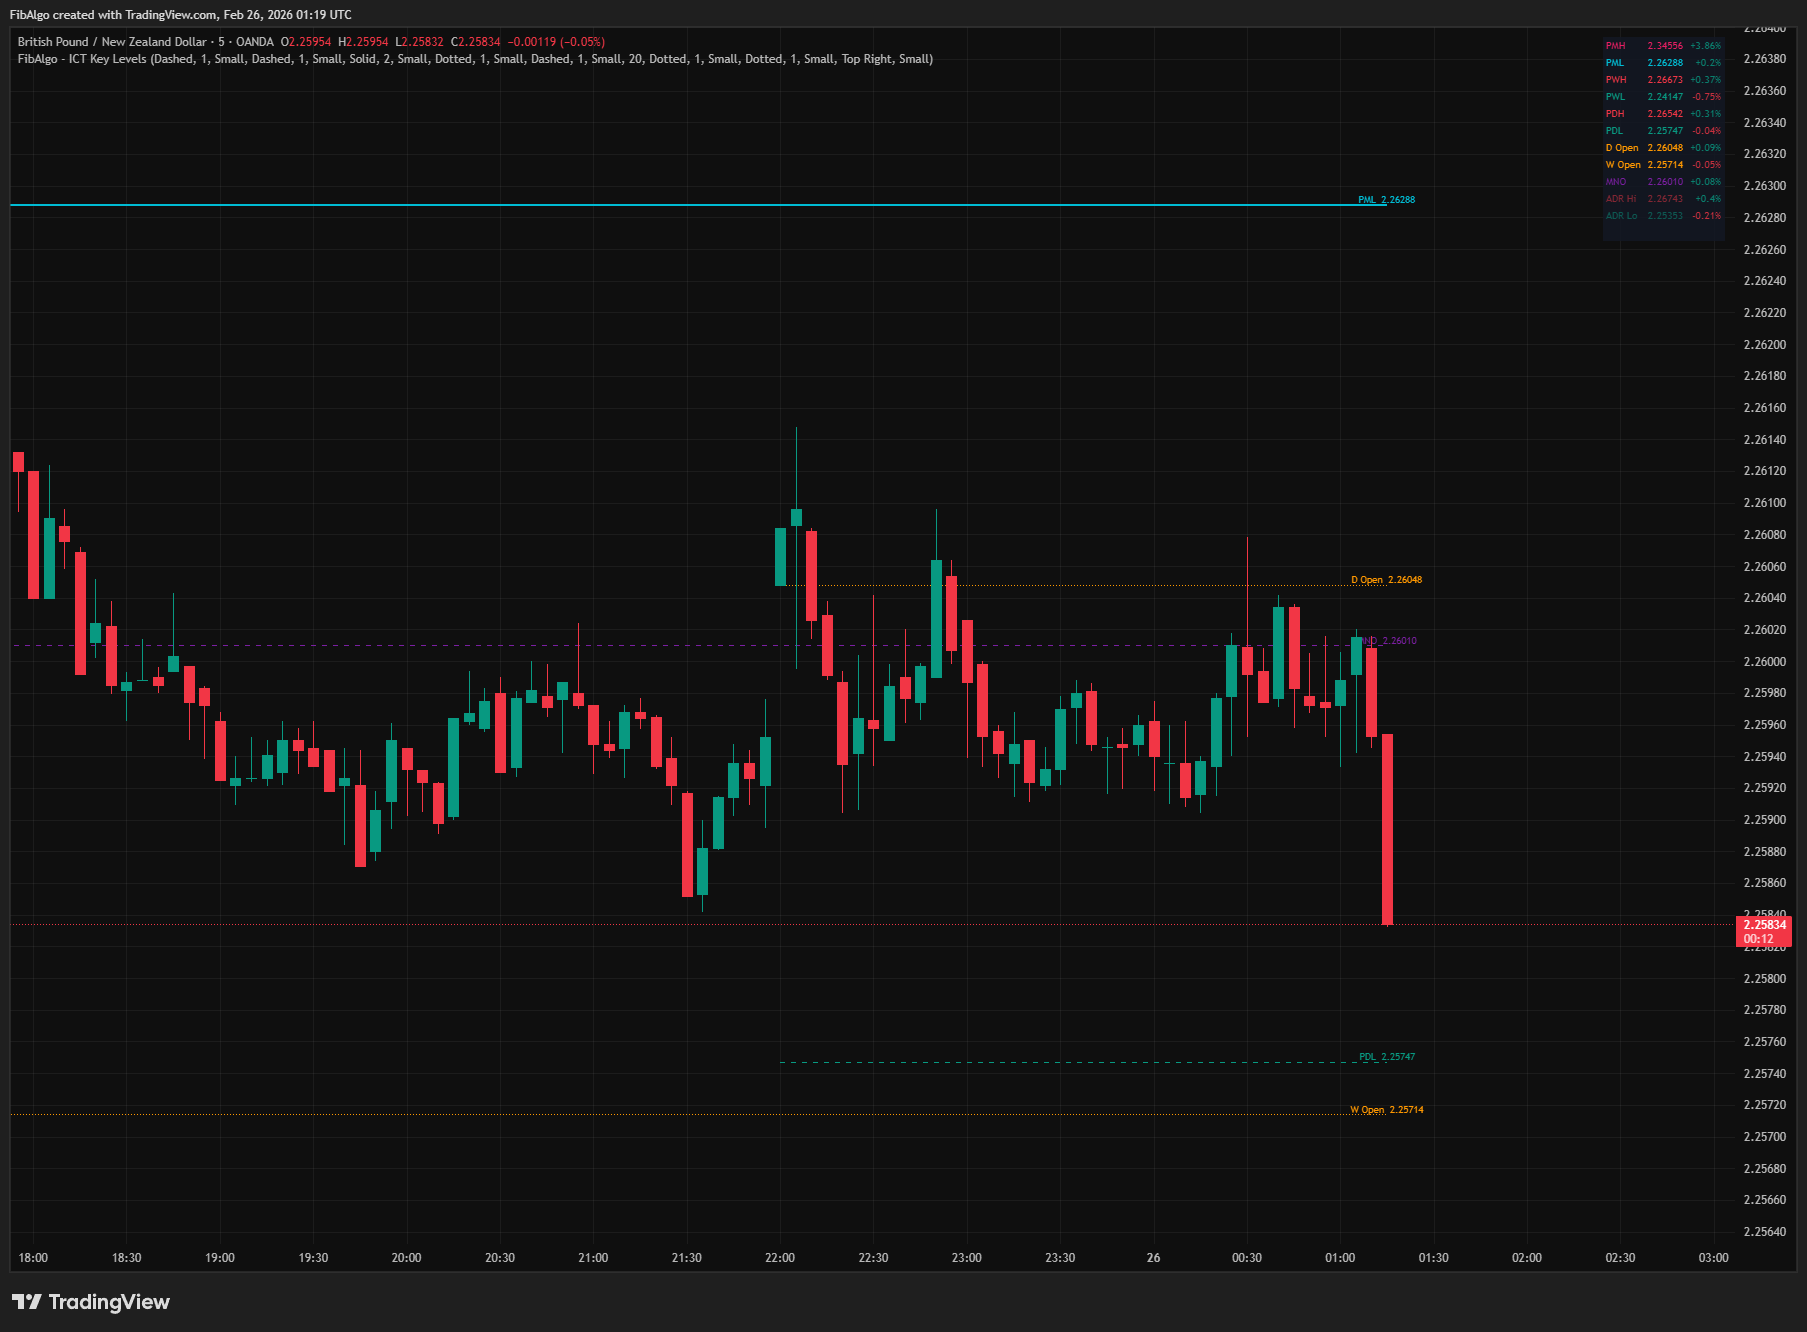
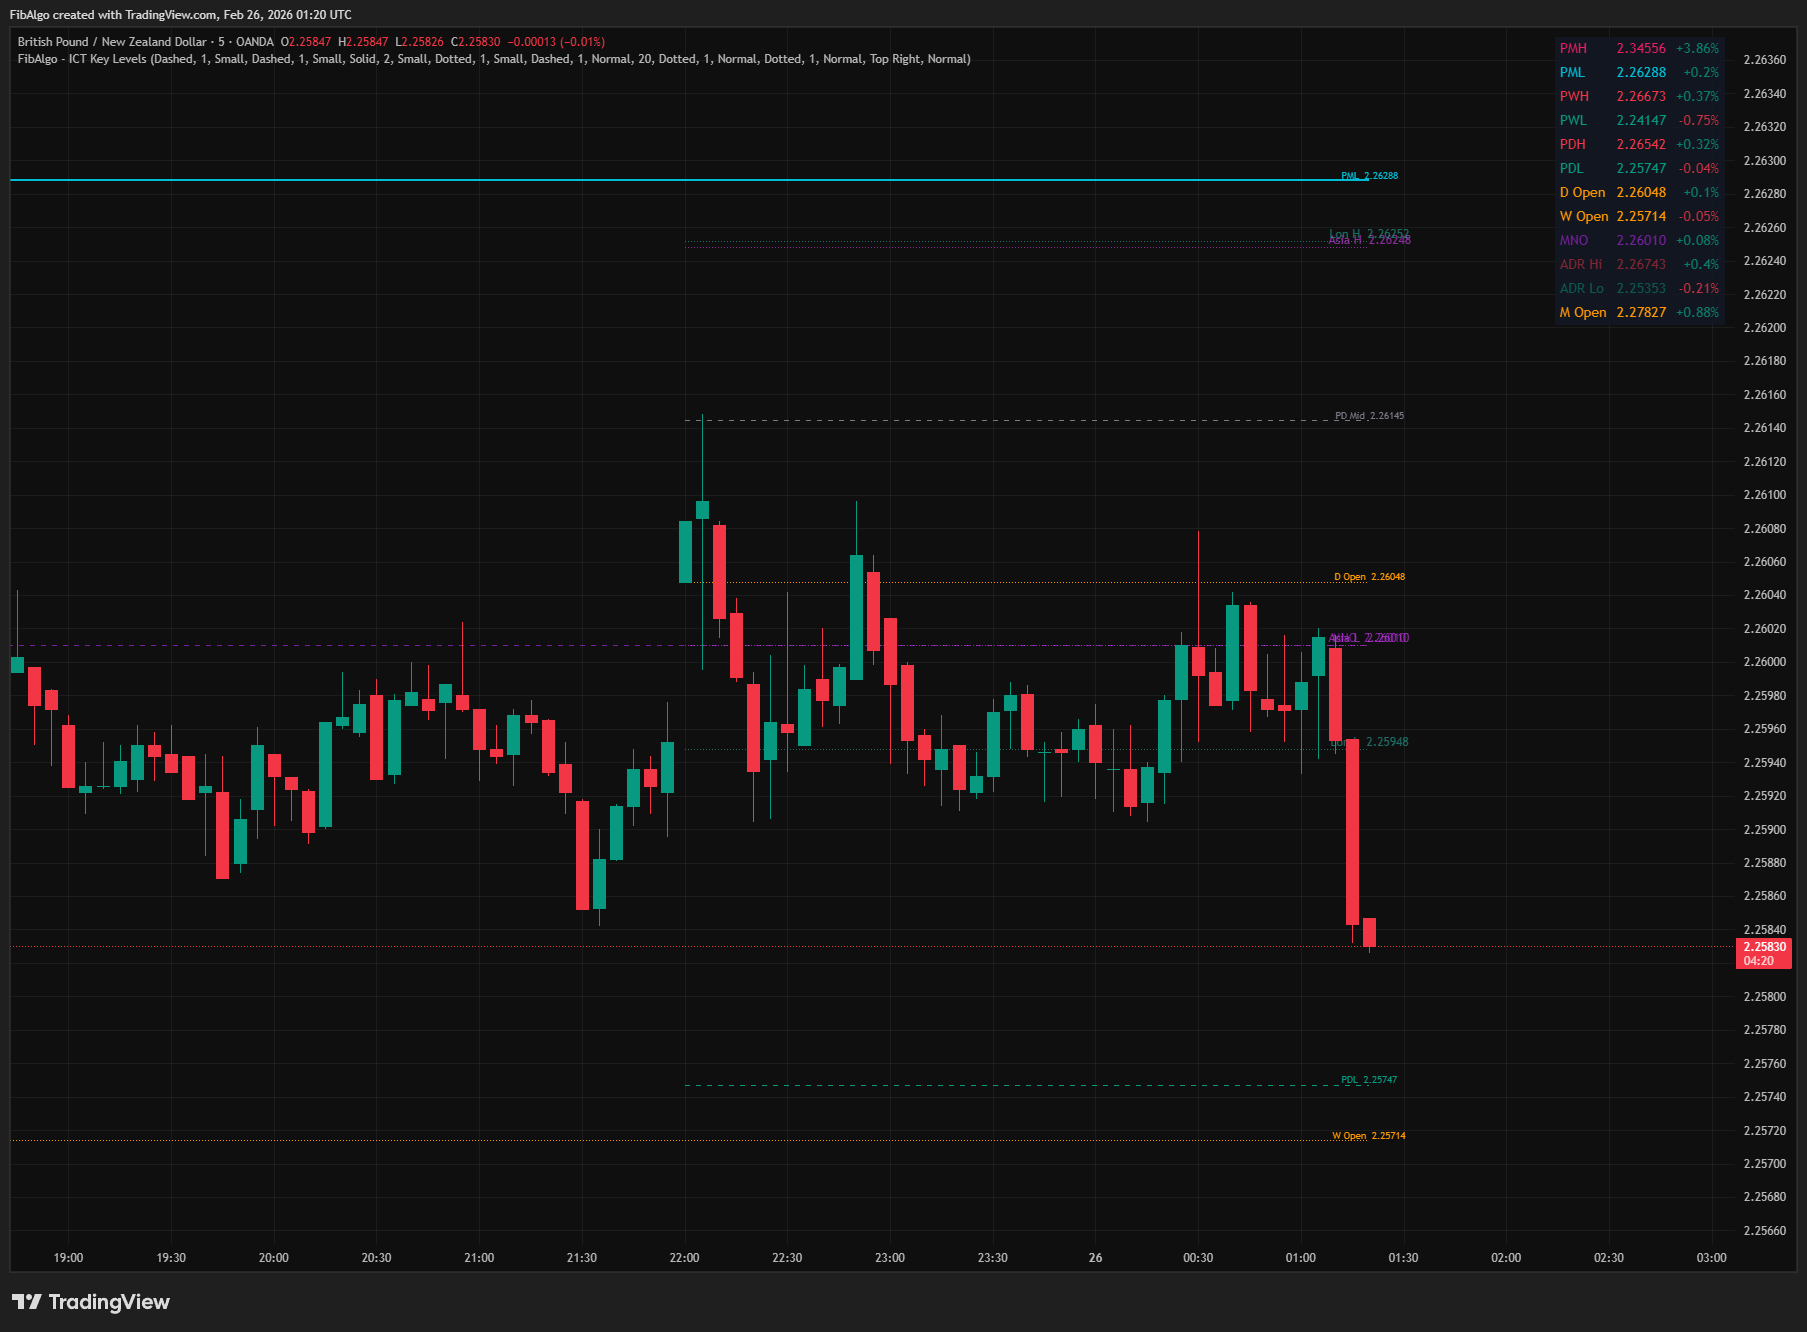
This indicator draws the essential ICT institutional reference levels on your chart: Previous Day High/Low (PDH/PDL), Previous Week High/Low (PWH/PWL), Previous Month High/Low (PMH/PML), Daily/Weekly/Monthly Opens, Midnight Open (NY 00:00 ET), Average Daily Range (ADR) projections, and Previous Session High/Low (Asia, London, NY). All levels update automatically with fully independent styling per group — including colors, line styles, widths, and label sizes. A real-time status table displays each level's price and percentage distance from the current close.
Key Concepts
- PDH/PDL (Previous Day High/Low) — The high and low of the previous trading day. These are the most commonly targeted liquidity levels in ICT methodology. Smart money sweeps these levels to fill institutional orders before reversing.
- PWH/PWL (Previous Week High/Low) — The high and low of the previous trading week. Higher-timeframe liquidity targets. Weekly levels are key draw-on-liquidity targets for swing setups.
- PMH/PML (Previous Month High/Low) — The high and low of the previous month. These are swing-level liquidity targets. Monthly levels carry the most significance for institutional positioning.
- Equilibrium (50% Midpoint) — The midpoint between a previous period's high and low. Optionally displayed for Daily, Weekly, and Monthly ranges. Price often gravitates toward equilibrium before targeting a liquidity pool.
- Daily/Weekly/Monthly Open — The opening price of the current period. Price relative to the open defines bias: above open = bullish, below open = bearish.
- Midnight Open (MNO) — The price at 12:00 AM New York time. ICT uses this as a directional bias tool: price above MNO = bullish for the day, below = bearish. Also acts as dynamic support/resistance.
- Average Daily Range (ADR) — The average high-to-low range over a configurable lookback period (default 20 days). Projected from today's open as ADR High and ADR Low. Helps set realistic targets — price rarely exceeds 1.5x ADR in a single day.
- Previous Session H/L — The high and low of the previous Asian, London, and New York sessions. London targets Asia H/L; New York targets London H/L. These are intraday liquidity sweep levels.
How It Works
1. Previous Period High/Low (Day, Week, Month) The indicator uses higher-timeframe security requests to fetch the previous period's high, low, and open. These levels are drawn as horizontal lines starting from the beginning of the current period (e.g., PDH/PDL lines start at the first bar of the current day). Each period has its own color, style, width, and label size settings. An optional 50% midpoint (equilibrium) line can be displayed for each range. 2. Opening Prices Current Daily, Weekly, and Monthly opens are drawn as reference levels starting from their respective period's first bar. In ICT, the relationship between price and the open of the relevant period defines directional bias. All three periods can be toggled independently. 3. Midnight Open (NY 00:00 ET) At midnight New York time, the indicator captures the opening price and draws a horizontal line starting from that bar. This level persists until the next midnight. On intraday timeframes (up to 1H), the exact midnight bar is detected. On higher timeframes, the daily open proxies as the midnight level. The timezone is hardcoded to America/New_York (ET), ensuring consistent behavior regardless of the user's chart timezone setting. 4. Average Daily Range (ADR) The ADR is calculated as the simple moving average of the daily high-low range over a configurable lookback (default: 20 days, excluding the current day). Two projection lines are drawn from the start of the current day: ADR High (daily open + ADR/2) and ADR Low (daily open − ADR/2). These represent the statistically expected range boundaries for the current day. 5. Previous Session High/Low For intraday traders, the indicator tracks the high and low of three key sessions using New York (ET) time:- Asia — 8:00 PM to 12:00 AM ET
- London — 2:00 AM to 5:00 AM ET
- New York — 9:30 AM to 12:00 PM ET
Features
- Previous Day High/Low (PDH/PDL) — Automatically drawn from the prior day's range. The most important intraday liquidity levels in ICT methodology.
- Previous Week High/Low (PWH/PWL) — Weekly liquidity targets for swing traders. Key draw-on-liquidity levels.
- Previous Month High/Low (PMH/PML) — Monthly institutional liquidity levels. Carry the highest significance for position trading.
- 50% Midpoints — Optional equilibrium lines for each period (PD Mid, PW Mid, PM Mid). Price often rebalances to these levels.
- Daily / Weekly / Monthly Open — Current period opening prices for directional bias. Above open = bullish, below = bearish.
- Midnight Open (NY 00:00 ET) — ICT's daily bias reference. Exact detection on intraday timeframes, daily open proxy on higher timeframes. Uses America/New_York timezone — works correctly from any chart timezone.
- Average Daily Range (ADR) — Projected from daily open as ADR High and ADR Low. Configurable lookback period (1–100 days, default 20). Sets realistic daily range expectations.
- Previous Session H/L — Asia (8PM–12AM ET), London (2AM–5AM ET), NY (9:30AM–12PM ET). Previous session highs and lows serve as intraday liquidity sweep targets. All session detection is timezone-safe.
- Period-Aware Lines — Lines start from the beginning of their relevant period (e.g., PDH starts at the first bar of the current day, PWH starts at the first bar of the current week). This keeps the chart clean and contextually accurate.
- Independent Styling Per Group — Each level group (PD, PW, PM, Opens, MNO, ADR, Sessions) has its own color, line style (Solid/Dashed/Dotted), line width, and label size controls. Full visual independence across all 7 groups.
- Configurable Label Sizes — Each group has an independent Label Size setting (Tiny/Small/Normal). Allows fine-grained control over visual hierarchy.
- Line Extension Toggle — Choose between lines ending at the current bar (default) or extending to the right edge of the chart.
- Real-Time Status Table — Shows all active levels with name, price, and percentage distance from close. Configurable position (any corner) and text size (Tiny/Small/Normal).
- Comprehensive Alert System — 7 alert categories with a master enable toggle: PDH/PDL Touch, PWH/PWL Touch, PMH/PML Touch, Opens Cross (Daily/Weekly/Monthly), Midnight Open Cross, ADR Hi/Lo Touch, Session H/L Touch. All alerts include symbol and timeframe information.
- Full Customization — 9 organized settings groups with independent controls for every visual element.
How to Use
- Liquidity Sweep Targets: PDH, PDL, PWH, PWL, PMH, PML are the levels where institutional orders rest. Watch for price to sweep a level (wick through) then reverse. This is the classic ICT liquidity grab pattern.
- Directional Bias with Opens: If price is above the Daily Open and Midnight Open, the day has bullish bias. If below both, bearish. Confluence between multiple opens strengthens the bias.
- ADR for Realistic Targets: If price has already moved 80% of ADR from the open, the remaining potential is limited. Don't chase entries late in the day's range. ADR levels also serve as profit-taking zones.
- Session H/L for Intraday: Enable Asia, London, and NY session levels for day trading. London sweeps Asia H/L, then NY sweeps London H/L. These cycles repeat daily and form the basis of ICT's session-to-session model.
- Confluence Zones: When multiple levels align (e.g., PDL near PWL near ADR Low), that area becomes a high-probability reaction zone. Look for Order Blocks, FVGs, or OTE entries at confluence.
- Higher-Timeframe Context: Use PMH/PML and PWH/PWL for daily/weekly bias. Use PDH/PDL, ADR, and session levels for intraday execution. Layer the timeframes for top-down ICT analysis.
- Combine with ICT Tools: Key Levels define WHERE institutional liquidity sits. Pair with Market Structure (trend direction), Order Blocks (precise entry), Fair Value Gaps (rebalancing), Premium/Discount (range position), and Killzones (timing) for complete analysis.
Limitations
- Previous Day/Week/Month data requires at least one completed period to be available. On the first day/week/month of the chart, these levels will be absent.
- Midnight Open detection requires intraday timeframes (up to 1H) for exact precision. On daily and higher timeframes, the daily open is used as a proxy.
- Previous Session H/L tracking works on intraday timeframes only. On daily or higher charts, session data is not available and these levels will not appear.
- ADR projection assumes a symmetrical range from the daily open. Actual price movement may be asymmetric (larger move in one direction).
- Session times are fixed to ET (America/New_York). They represent standard ICT session windows and are not user-adjustable.
- Lines are clamped to a maximum of 500 bars from the current bar to prevent historical buffer overflow errors.
- This indicator displays reference levels — it does not generate buy/sell signals. Combine with ICT Market Structure, Order Blocks, Fair Value Gaps, and Premium/Discount zones for a complete trading framework.
Tags
#Support & Resistance#Sessions & Time#Smart Money