Overview
FibAlgo - Wyckoff Selling & Buying Climax detects the two most dramatic events in Wyckoff methodology: the Selling Climax (SC) and the Buying Climax (BC). These events mark the culmination of extreme selling or buying pressure where institutions absorb panic-driven public orders, often signaling the beginning of a new trading range. The indicator also identifies the Automatic Rally (AR) or Automatic Reaction that follows each climax, automatically drawing the resulting trading range boundaries. A multi-factor strength score grades each climax event.
Key Concepts
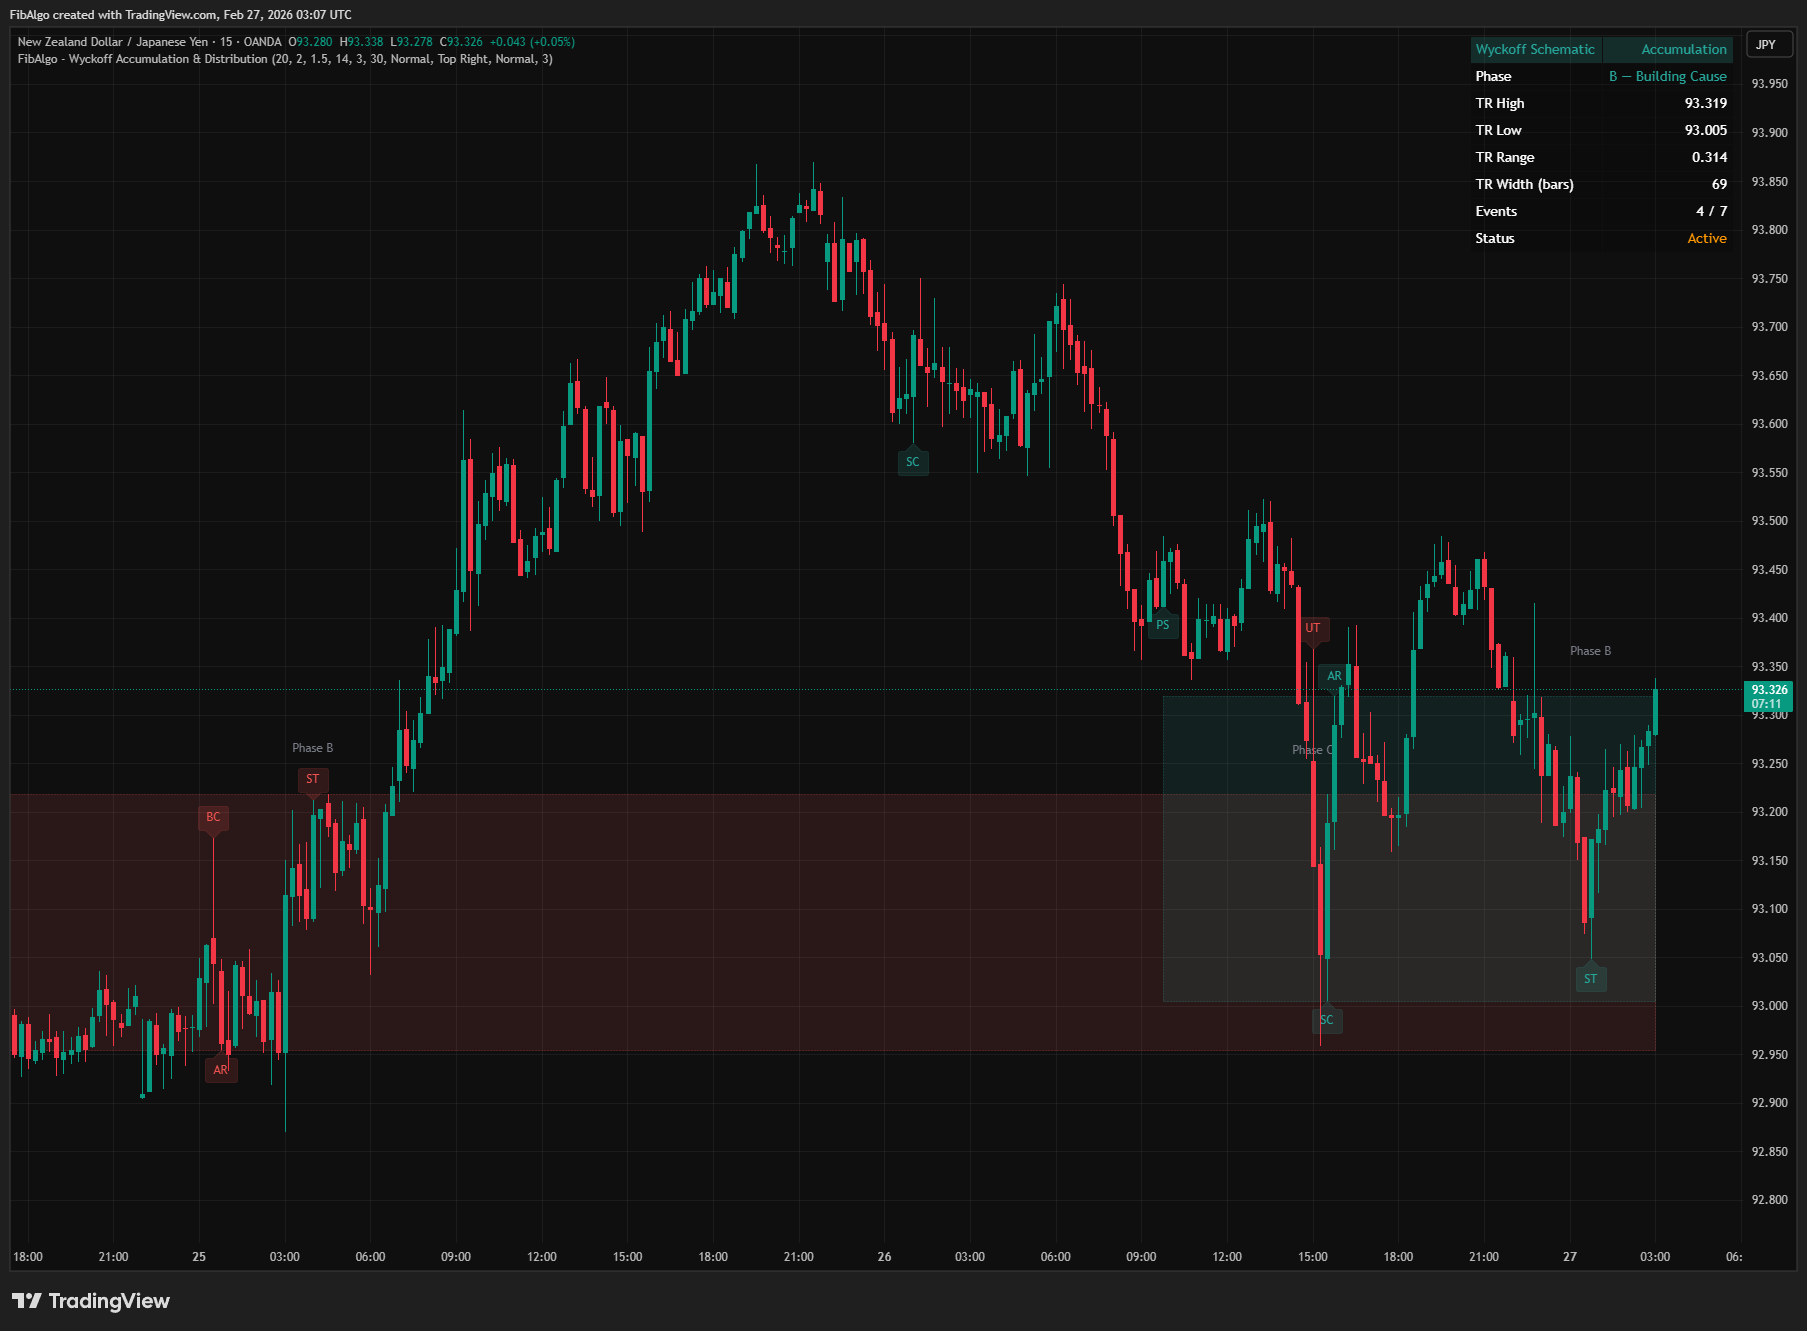
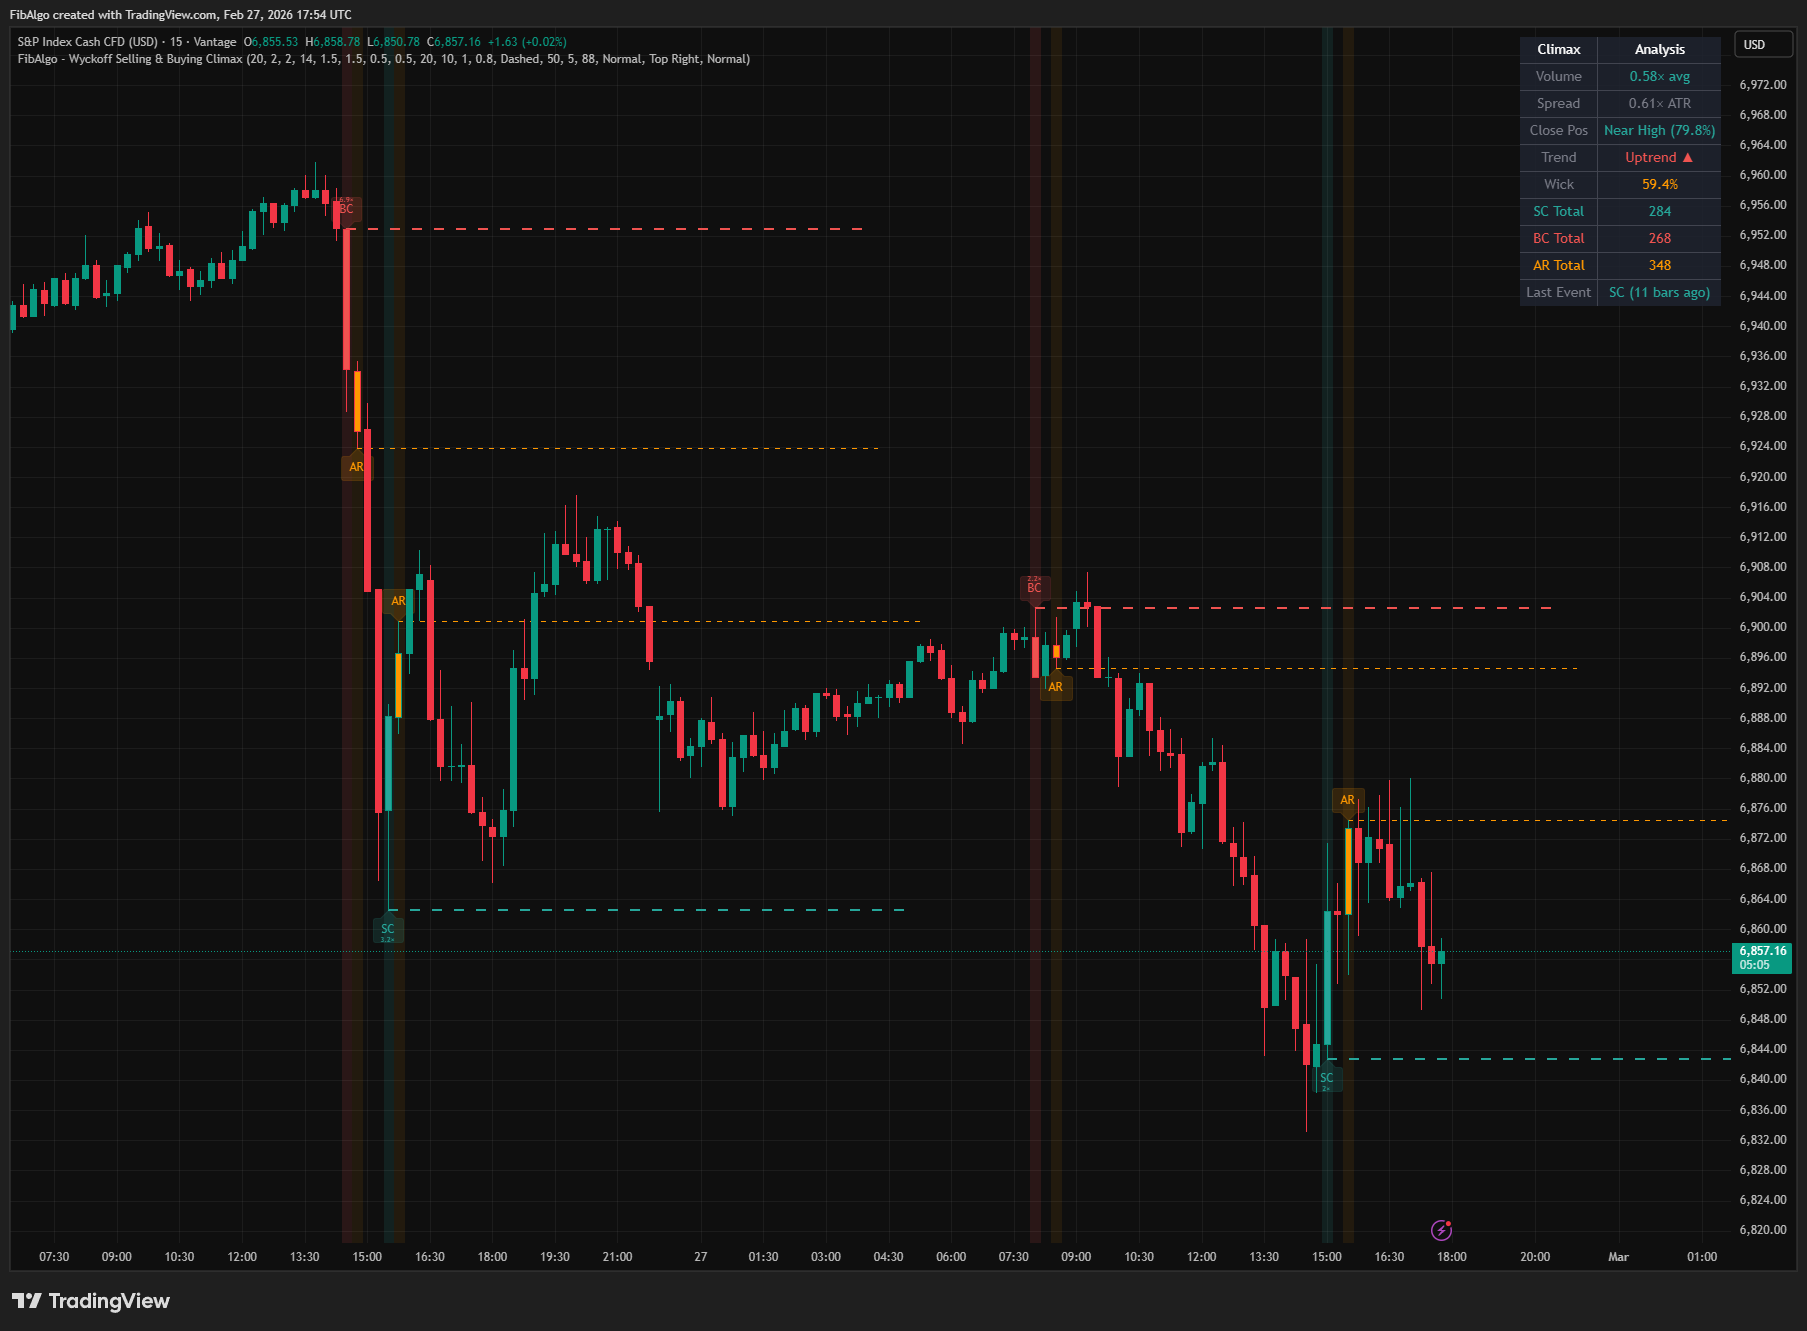
- Selling Climax (SC) — The point of maximum selling pressure at the end of a downtrend. Panicky selling by the public is absorbed by large institutional interests near a bottom. The bar shows extreme volume, wide spread, but the close is well off the low — indicating buyers stepped in. The SC low defines the lower boundary of the potential accumulation trading range.
- Buying Climax (BC) — The point of maximum buying pressure at the end of an uptrend. Urgent public buying is absorbed by institutional selling near a top. The bar shows extreme volume, wide spread, but the close is well off the high — indicating sellers stepped in. The BC high defines the upper boundary of the potential distribution trading range.
- Automatic Rally (AR) — The first significant counter-move after a Selling Climax. Intense selling pressure has diminished and a wave of buying plus short covering pushes prices up easily. The AR high defines the upper boundary of the trading range. AR volume is typically moderate — lighter than the climax itself.
- Automatic Reaction — The first significant counter-move after a Buying Climax. Buying pressure diminishes while heavy supply continues, causing a swift decline. The AR low defines the lower boundary of the trading range.
- Trading Range Formation — The SC low (or BC high) and the subsequent AR extreme together define the initial boundaries of the new trading range where accumulation or distribution will take place. This TR is the foundation for all subsequent Wyckoff analysis.
- Climax Strength Scoring — Each climax is graded (Strong/Moderate/Weak) based on the magnitude of the volume spike, bar spread relative to ATR, and the close position within the bar. Stronger climaxes carry higher reversal significance.
How It Works
1. Selling Climax Detection A Selling Climax requires all of the following conditions simultaneously:- Prior downtrend confirmed via negative linear regression slope over the Trend Lookback period (default 20 bars)
- Extreme volume — exceeding the Volume MA (default 20-period) multiplied by the SC Volume Spike Multiplier (default 2.0×)
- Wide spread — bar range exceeding the ATR (default 14-period) multiplied by the SC Spread Multiplier (default 1.5×)
- Close well off the low — close position above the SC Close Position Threshold (default 0.5) OR a long lower wick exceeding 50% of the bar range, indicating institutional absorption
- Prior uptrend confirmed via positive linear regression slope
- Extreme volume exceeding the BC Volume Spike Multiplier (default 2.0×) times the volume average
- Wide spread exceeding the BC Spread Multiplier (default 1.5×) times ATR
- Close well off the high — close position below the BC Close Position Threshold (default 0.5) OR a long upper wick exceeding 50% of the bar range, indicating supply entering from above
- After SC: looks for an up bar with close near high, spread ≥ AR Minimum Spread (default 1.0× ATR), and volume ≥ AR Minimum Volume (default 0.8× average)
- After BC: looks for a down bar with close near low, meeting the same spread and volume criteria
- SC low — support line (thicker, climax color)
- AR high after SC — resistance line (thinner, AR color)
- BC high — resistance line (thicker, climax color)
- AR low after BC — support line (thinner, AR color)
- Volume component (0-40 pts) — how far above the minimum threshold the volume spike reaches
- Spread component (0-30 pts) — how wide the bar spread is relative to the ATR requirement
- Close/wick component (0-30 pts) — for SC, the better of close position within the bar (absorption) or lower wick ratio; for BC, the better of (1 - close position) (rejection) or upper wick ratio
Features
- Selling Climax Detection — Identifies extreme selling pressure bars with volume spikes, wide spreads, and institutional absorption (close well off the low or long lower wick)
- Buying Climax Detection — Identifies extreme buying pressure bars with volume spikes, wide spreads, and supply rejection (close well off the high or long upper wick)
- Automatic Rally/Reaction Detection — Detects the first significant counter-move after each climax within a configurable window, completing the trading range pair
- Trading Range Boundary Lines — Automatically draws support and resistance lines at SC low, AR high, BC high, and AR low to define the expected trading range
- Climax Strength Scoring — Grades each climax (Strong/Moderate/Weak) based on volume magnitude, spread width, and close position for reliability assessment
- Volume Spike Markers — Small markers showing the exact volume multiple on climax bars for quick quantification
- Separate SC and BC Thresholds — Independent volume spike and spread multipliers for selling and buying climaxes, allowing asymmetric sensitivity tuning
- Wick Analysis — Detects long lower wicks (SC) and long upper wicks (BC) as alternative absorption/rejection signals beyond close position alone
- TR Line Management — Configurable line style, extension length, and maximum number of TR pairs with automatic old-line cleanup
- Background and Bar Coloring — Optional background tinting and candle coloring on climax and AR bars for instant visual identification
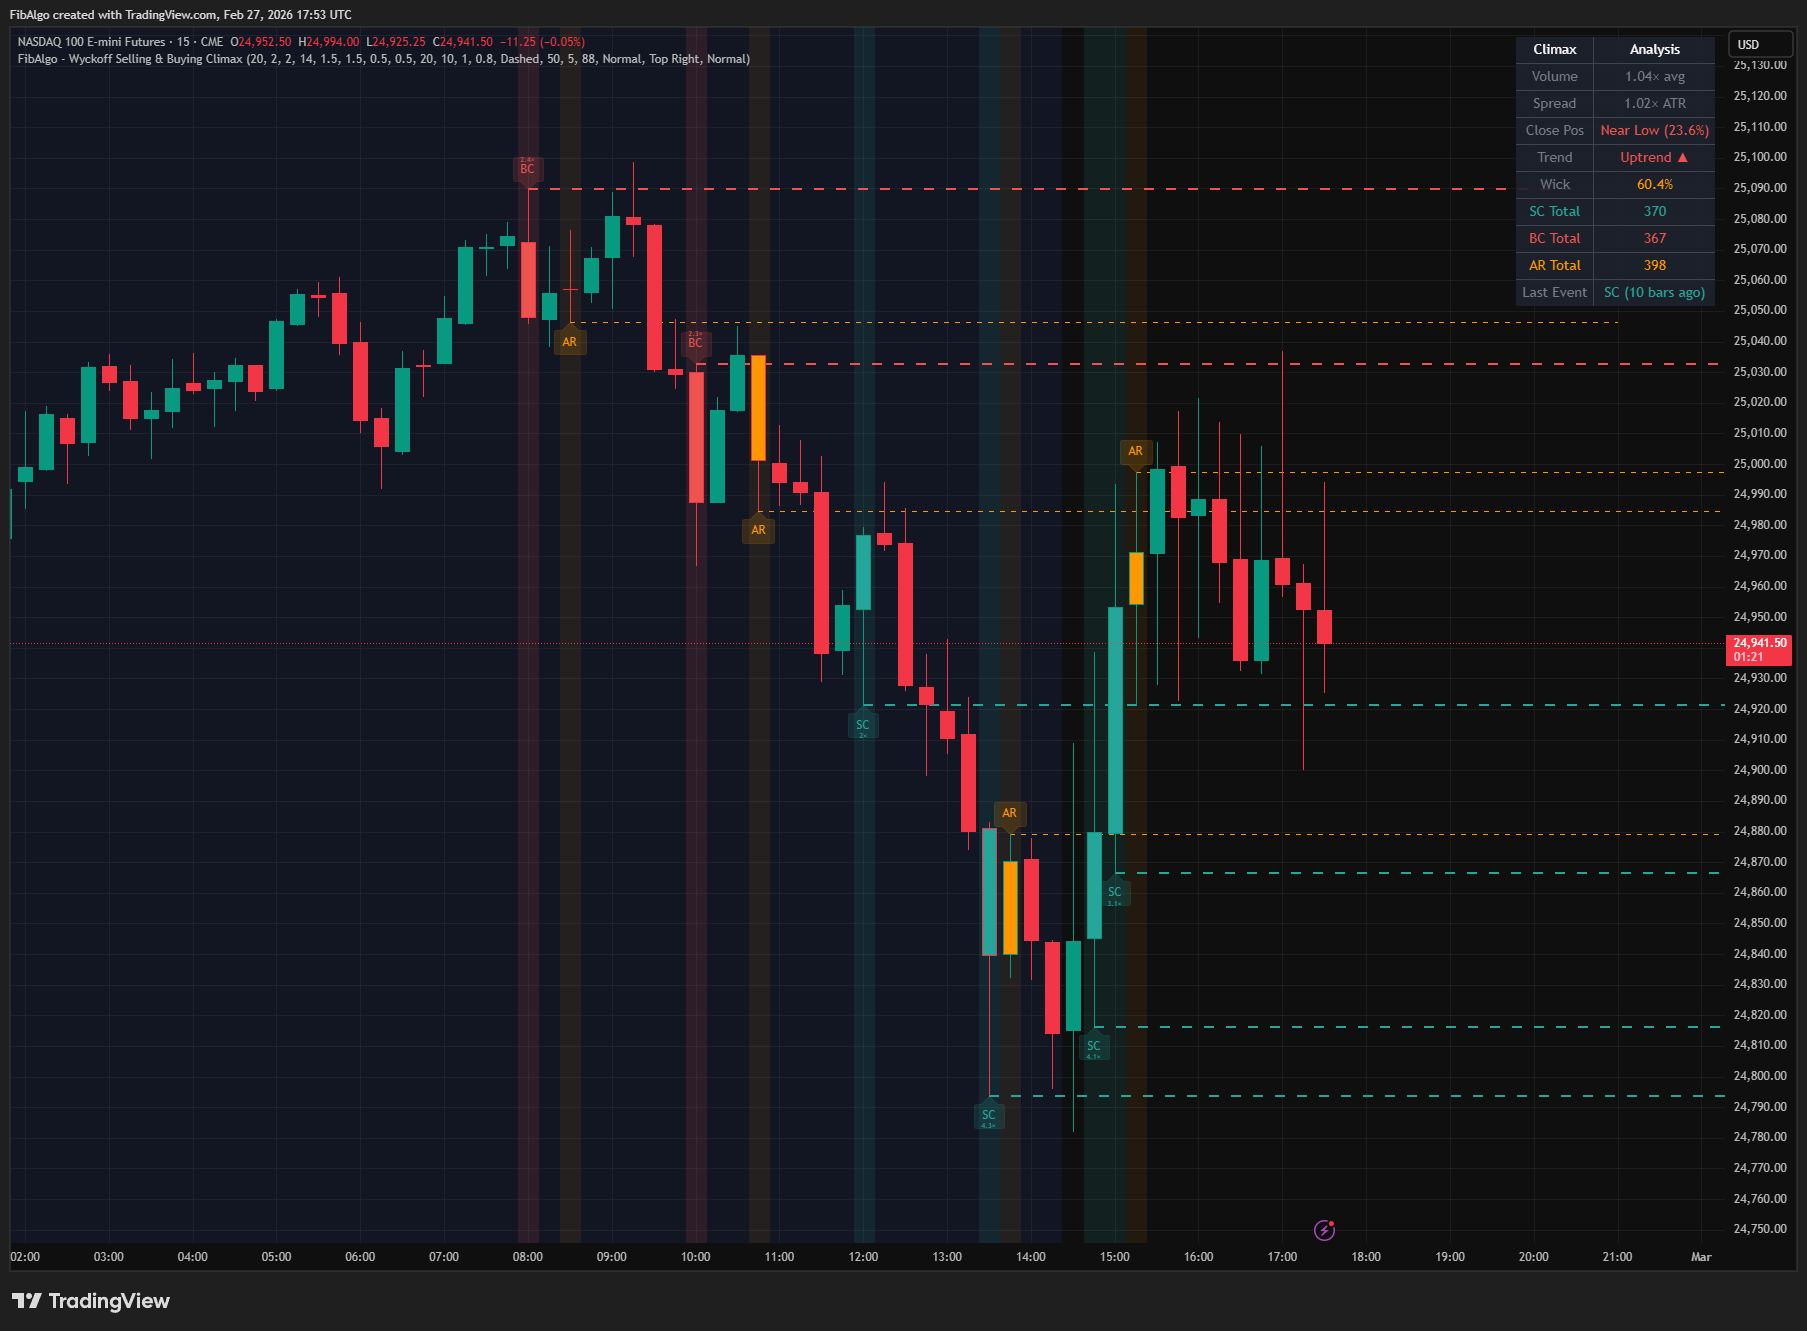
- Info Table — Detailed real-time metrics including Volume Ratio, Spread/ATR, Close Position, Trend, Wick Ratio, event counts, and last climax age
- Comprehensive Alert System — Individual alerts for SC, BC, and AR events with detailed messages including price, volume ratio, spread, strength grade, and critical levels
- Full Customization — 32 inputs across 6 groups covering climax detection, AR detection, trading range, visual style, display, and alerts
How to Use
- Add the indicator to your chart. It works on all timeframes but is most effective on 15-minute to daily charts where climax volume dynamics are clearly visible.
- Watch for SC events after extended downtrends — these suggest institutional accumulation at low prices. The SC low becomes a key support level.
- When an AR follows the SC, the trading range is established. Expect price to oscillate between the SC low (support) and the AR high (resistance) during the accumulation phase.
- Watch for BC events after extended uptrends — these suggest institutions are distributing holdings to eager public buyers. The BC high becomes a key resistance level.
- Use the Climax Strength grade to filter events. Strong climaxes (75%+) carry more reversal significance than Weak ones.
- Volume spike markers give immediate visual feedback on how extreme the bar's volume was relative to its average.
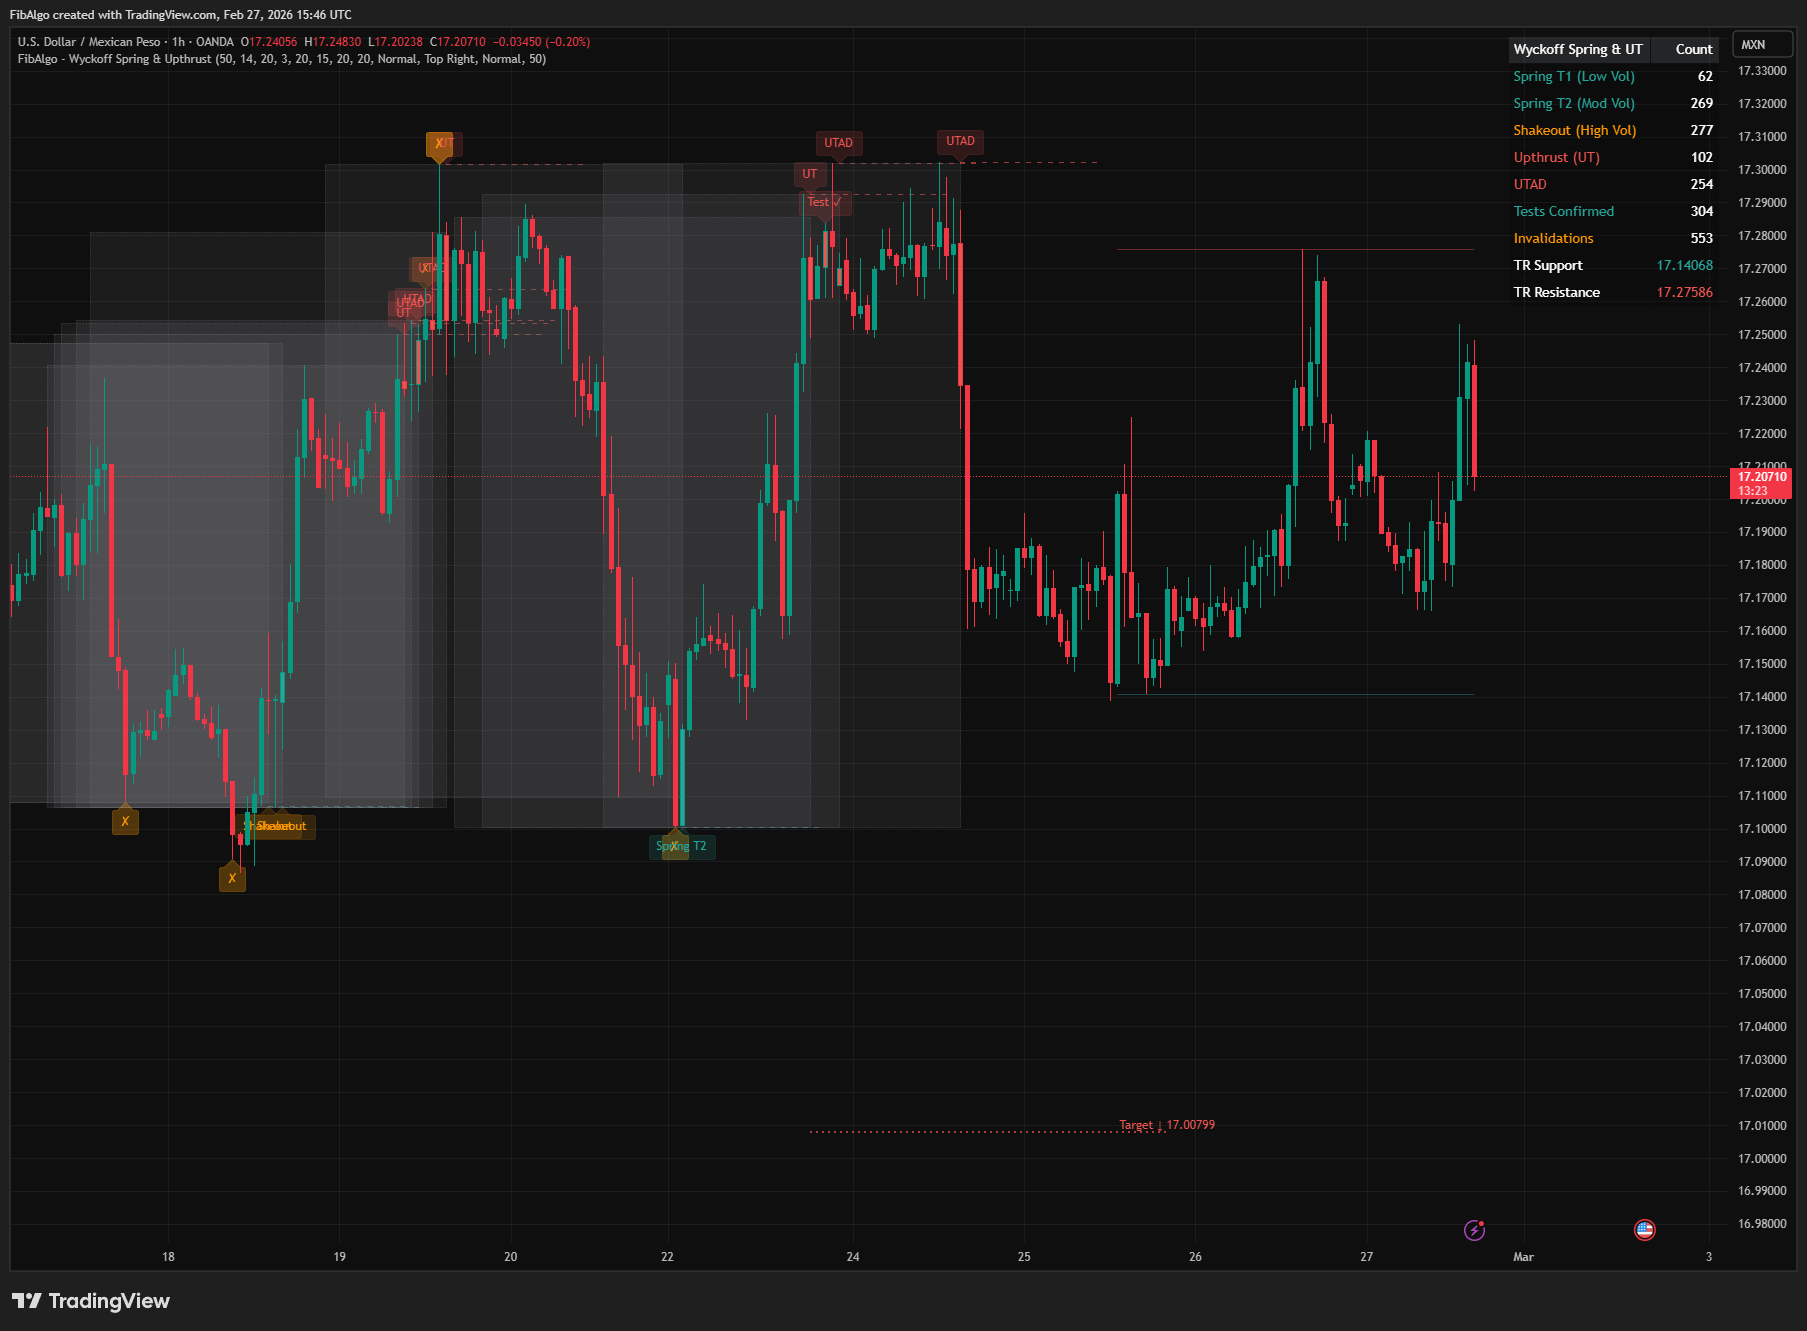
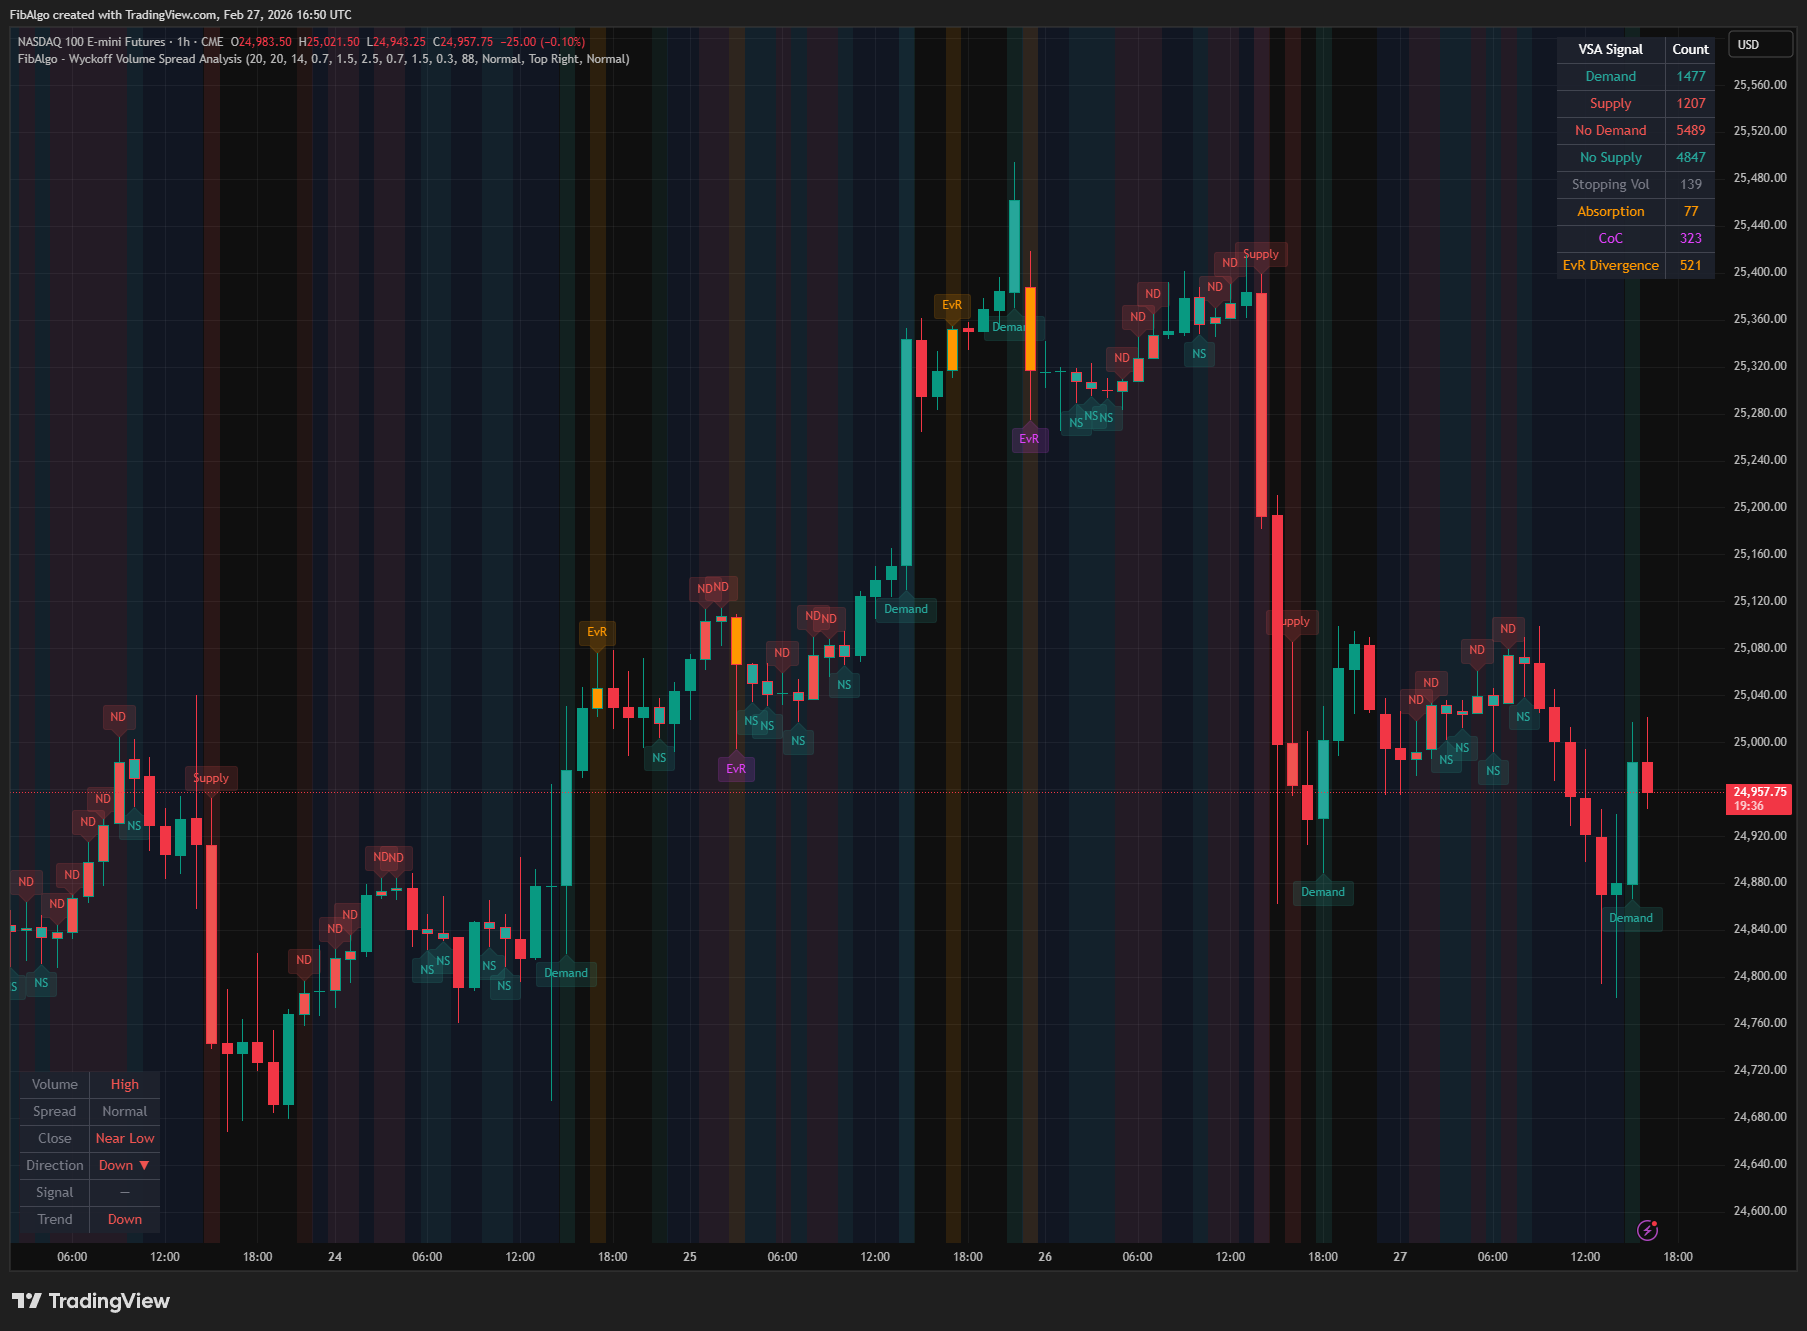
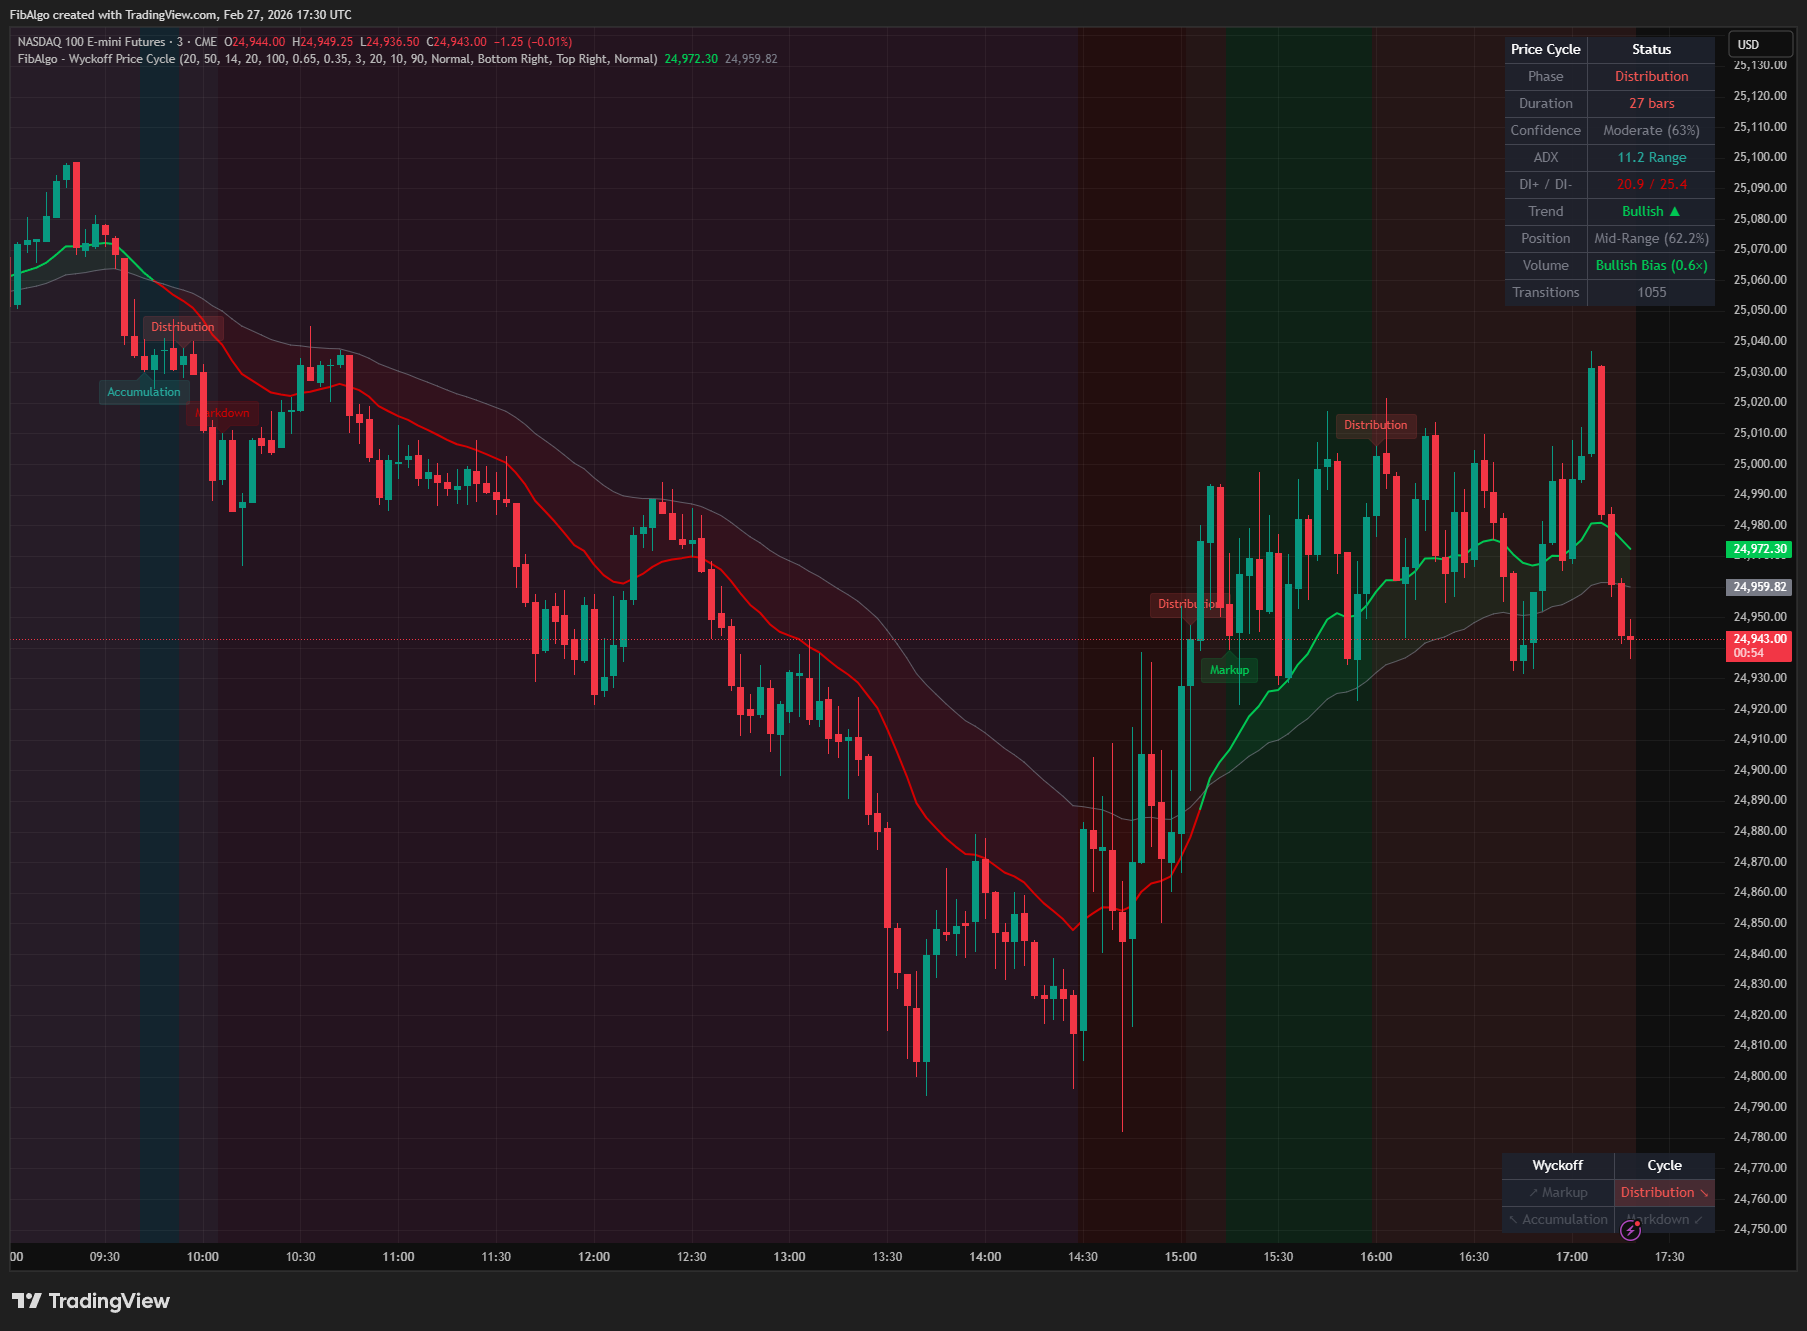
- Combine with other Wyckoff indicators: after a SC, look for Spring/Upthrust signals (#2) within the trading range; use VSA (#3) to analyze bar-by-bar volume behavior; check the Price Cycle (#4) for phase confirmation.
- Adjust the Volume Spike Multiplier higher (2.5-3.0×) for less noise on volatile instruments, or lower (1.5-1.8×) for calmer markets or smaller timeframes.
- Increase the Trend Lookback on higher timeframes for more reliable trend context, or decrease it on lower timeframes for faster response.
- Watch the Info Table for real-time volume and spread conditions — when volume approaches the climax threshold during a trending market, a climax may be imminent.
Limitations
- This indicator does not generate buy or sell signals. It identifies climax events and trading range boundaries for educational and analytical purposes based on Wyckoff methodology.
- Climax detection is inherently a lagging identification — the climax bar is confirmed at bar close, not in real time during the bar formation.
- Volume data reliability varies by instrument and exchange. Forex spot volume is typically tick volume and may not accurately represent institutional activity.
- Not every extreme volume bar is a true climax. Some may be news-driven spikes without institutional accumulation/distribution. Use the strength score and subsequent price action (AR confirmation) to validate.
- The AR detection window has a finite length. In rare cases, the automatic rally/reaction may occur outside this window and go undetected.
- TR boundary lines are initial estimates. In practice, secondary tests (STs) and springs may create lower TR boundaries than the original SC low.
- Past climax events do not guarantee future reversal behavior.
- Maximum 500 labels and 500 lines are supported by Pine Script. Old TR lines are automatically cleaned up, but many climax events on low timeframes could approach label limits.
Tags
#Wyckoff Method#Volume Based#Signals