Overview
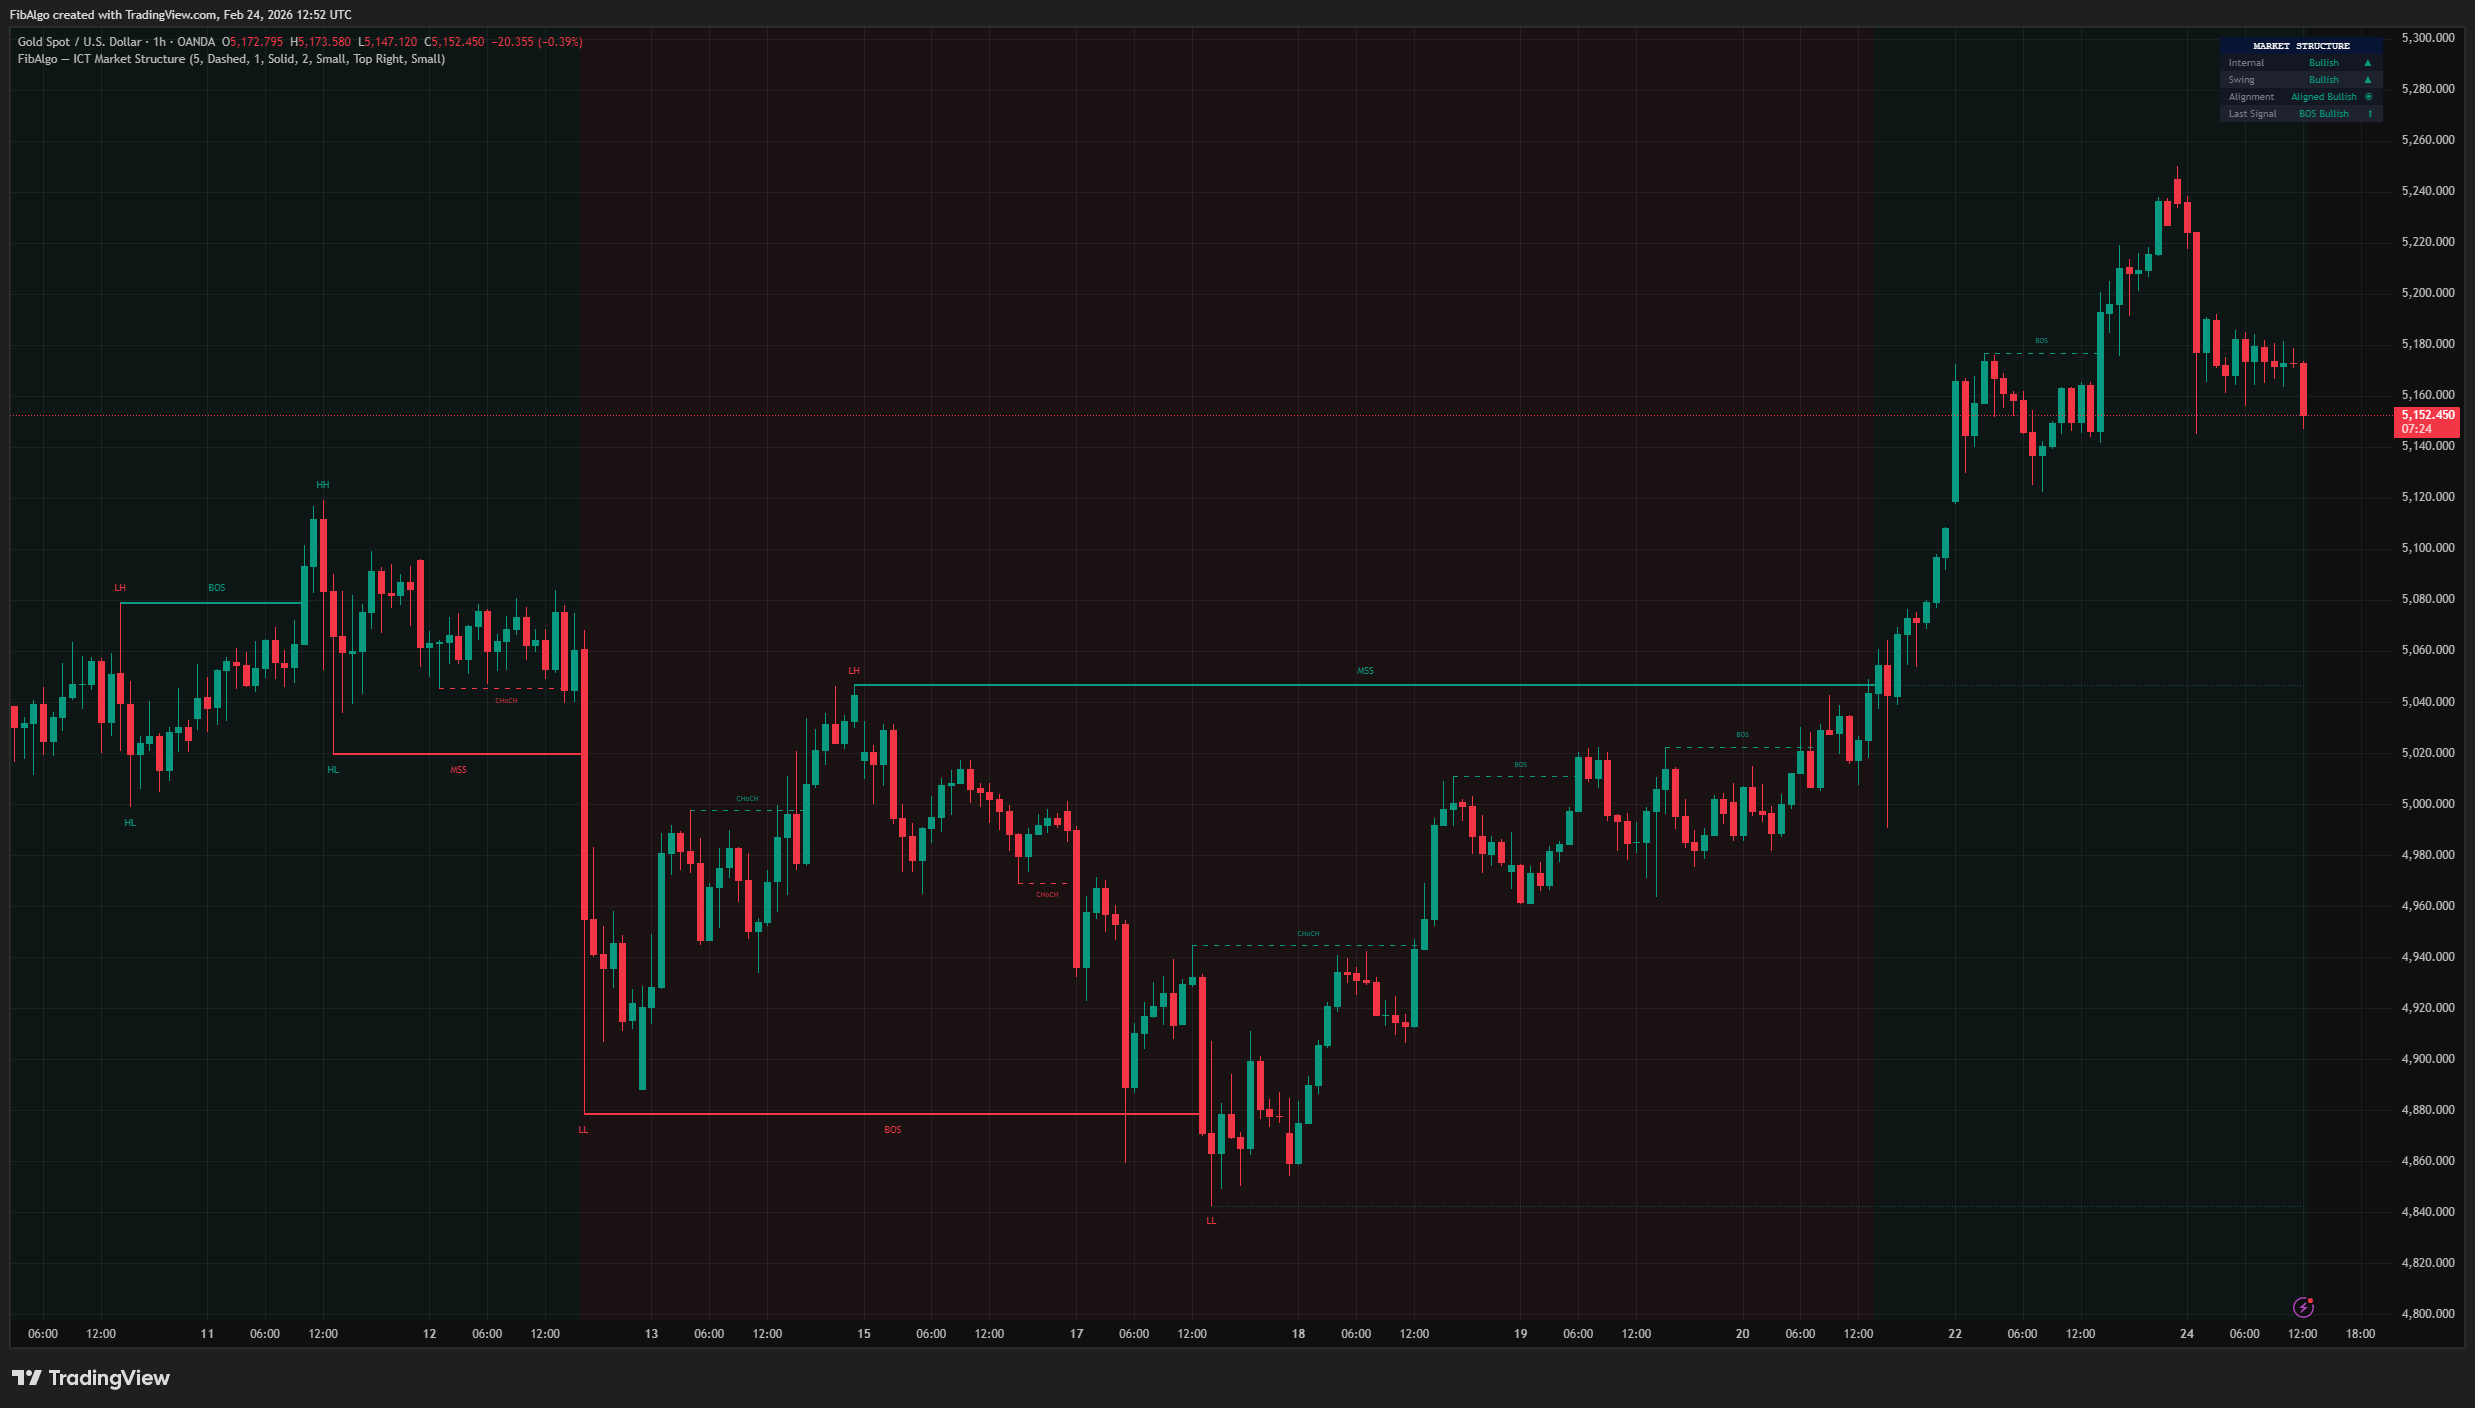
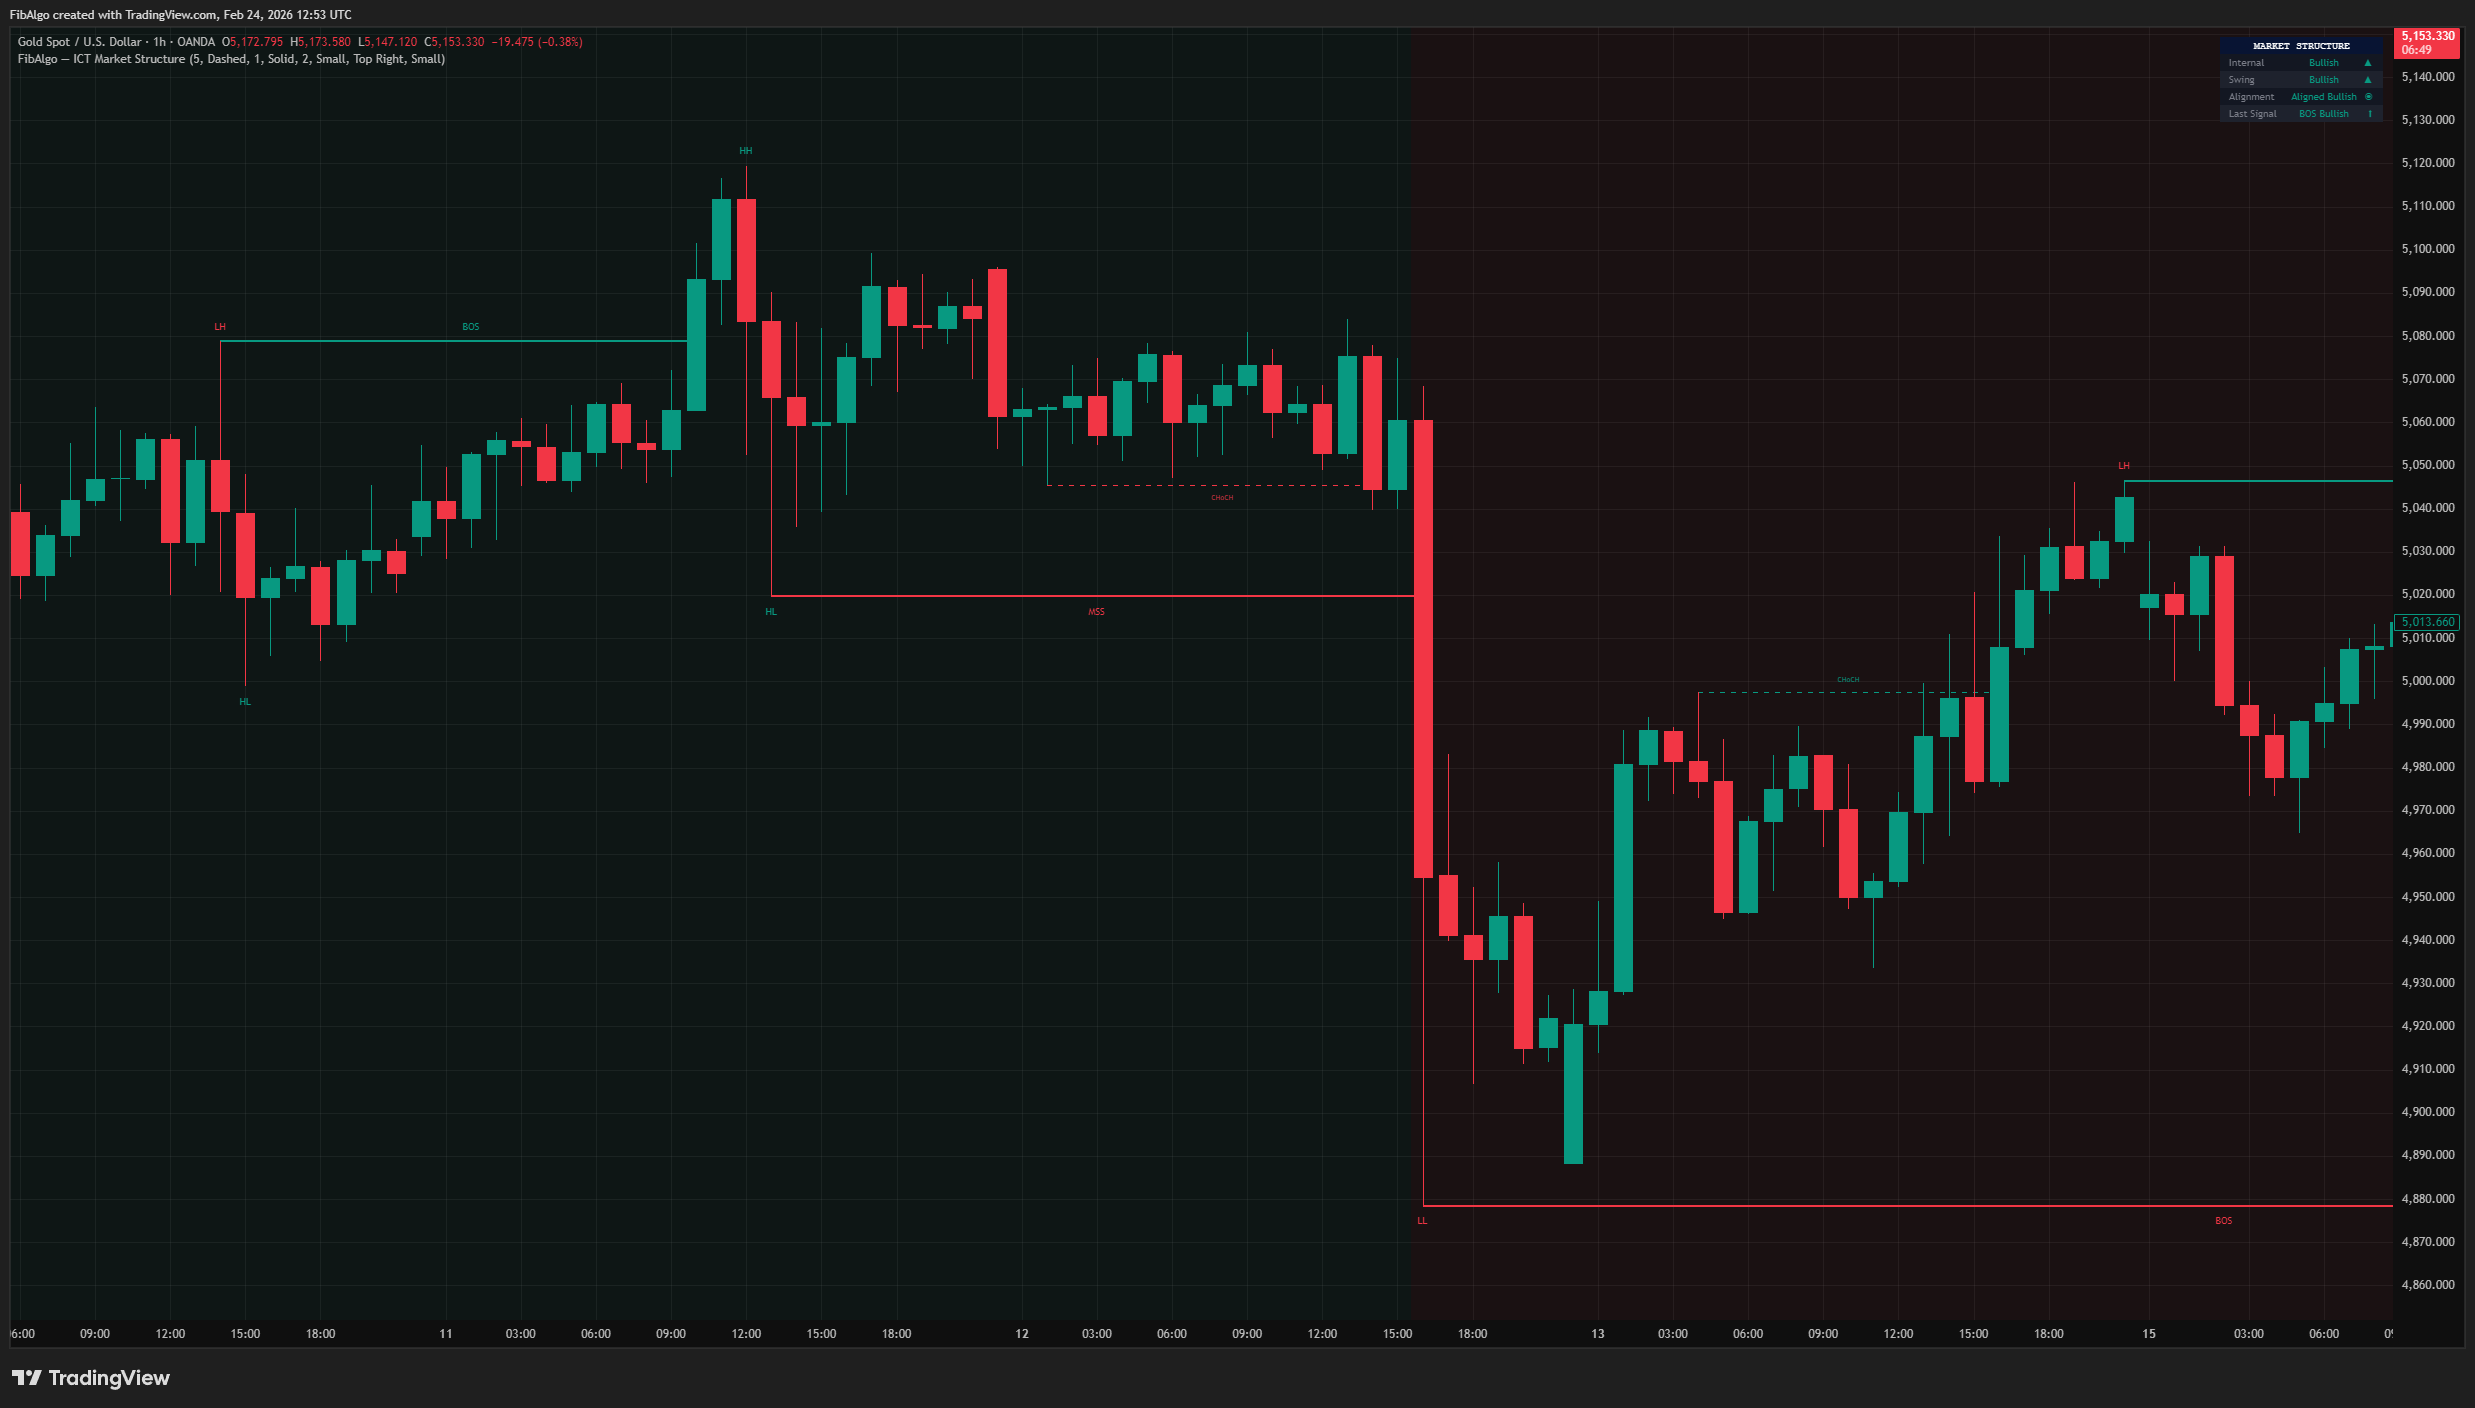
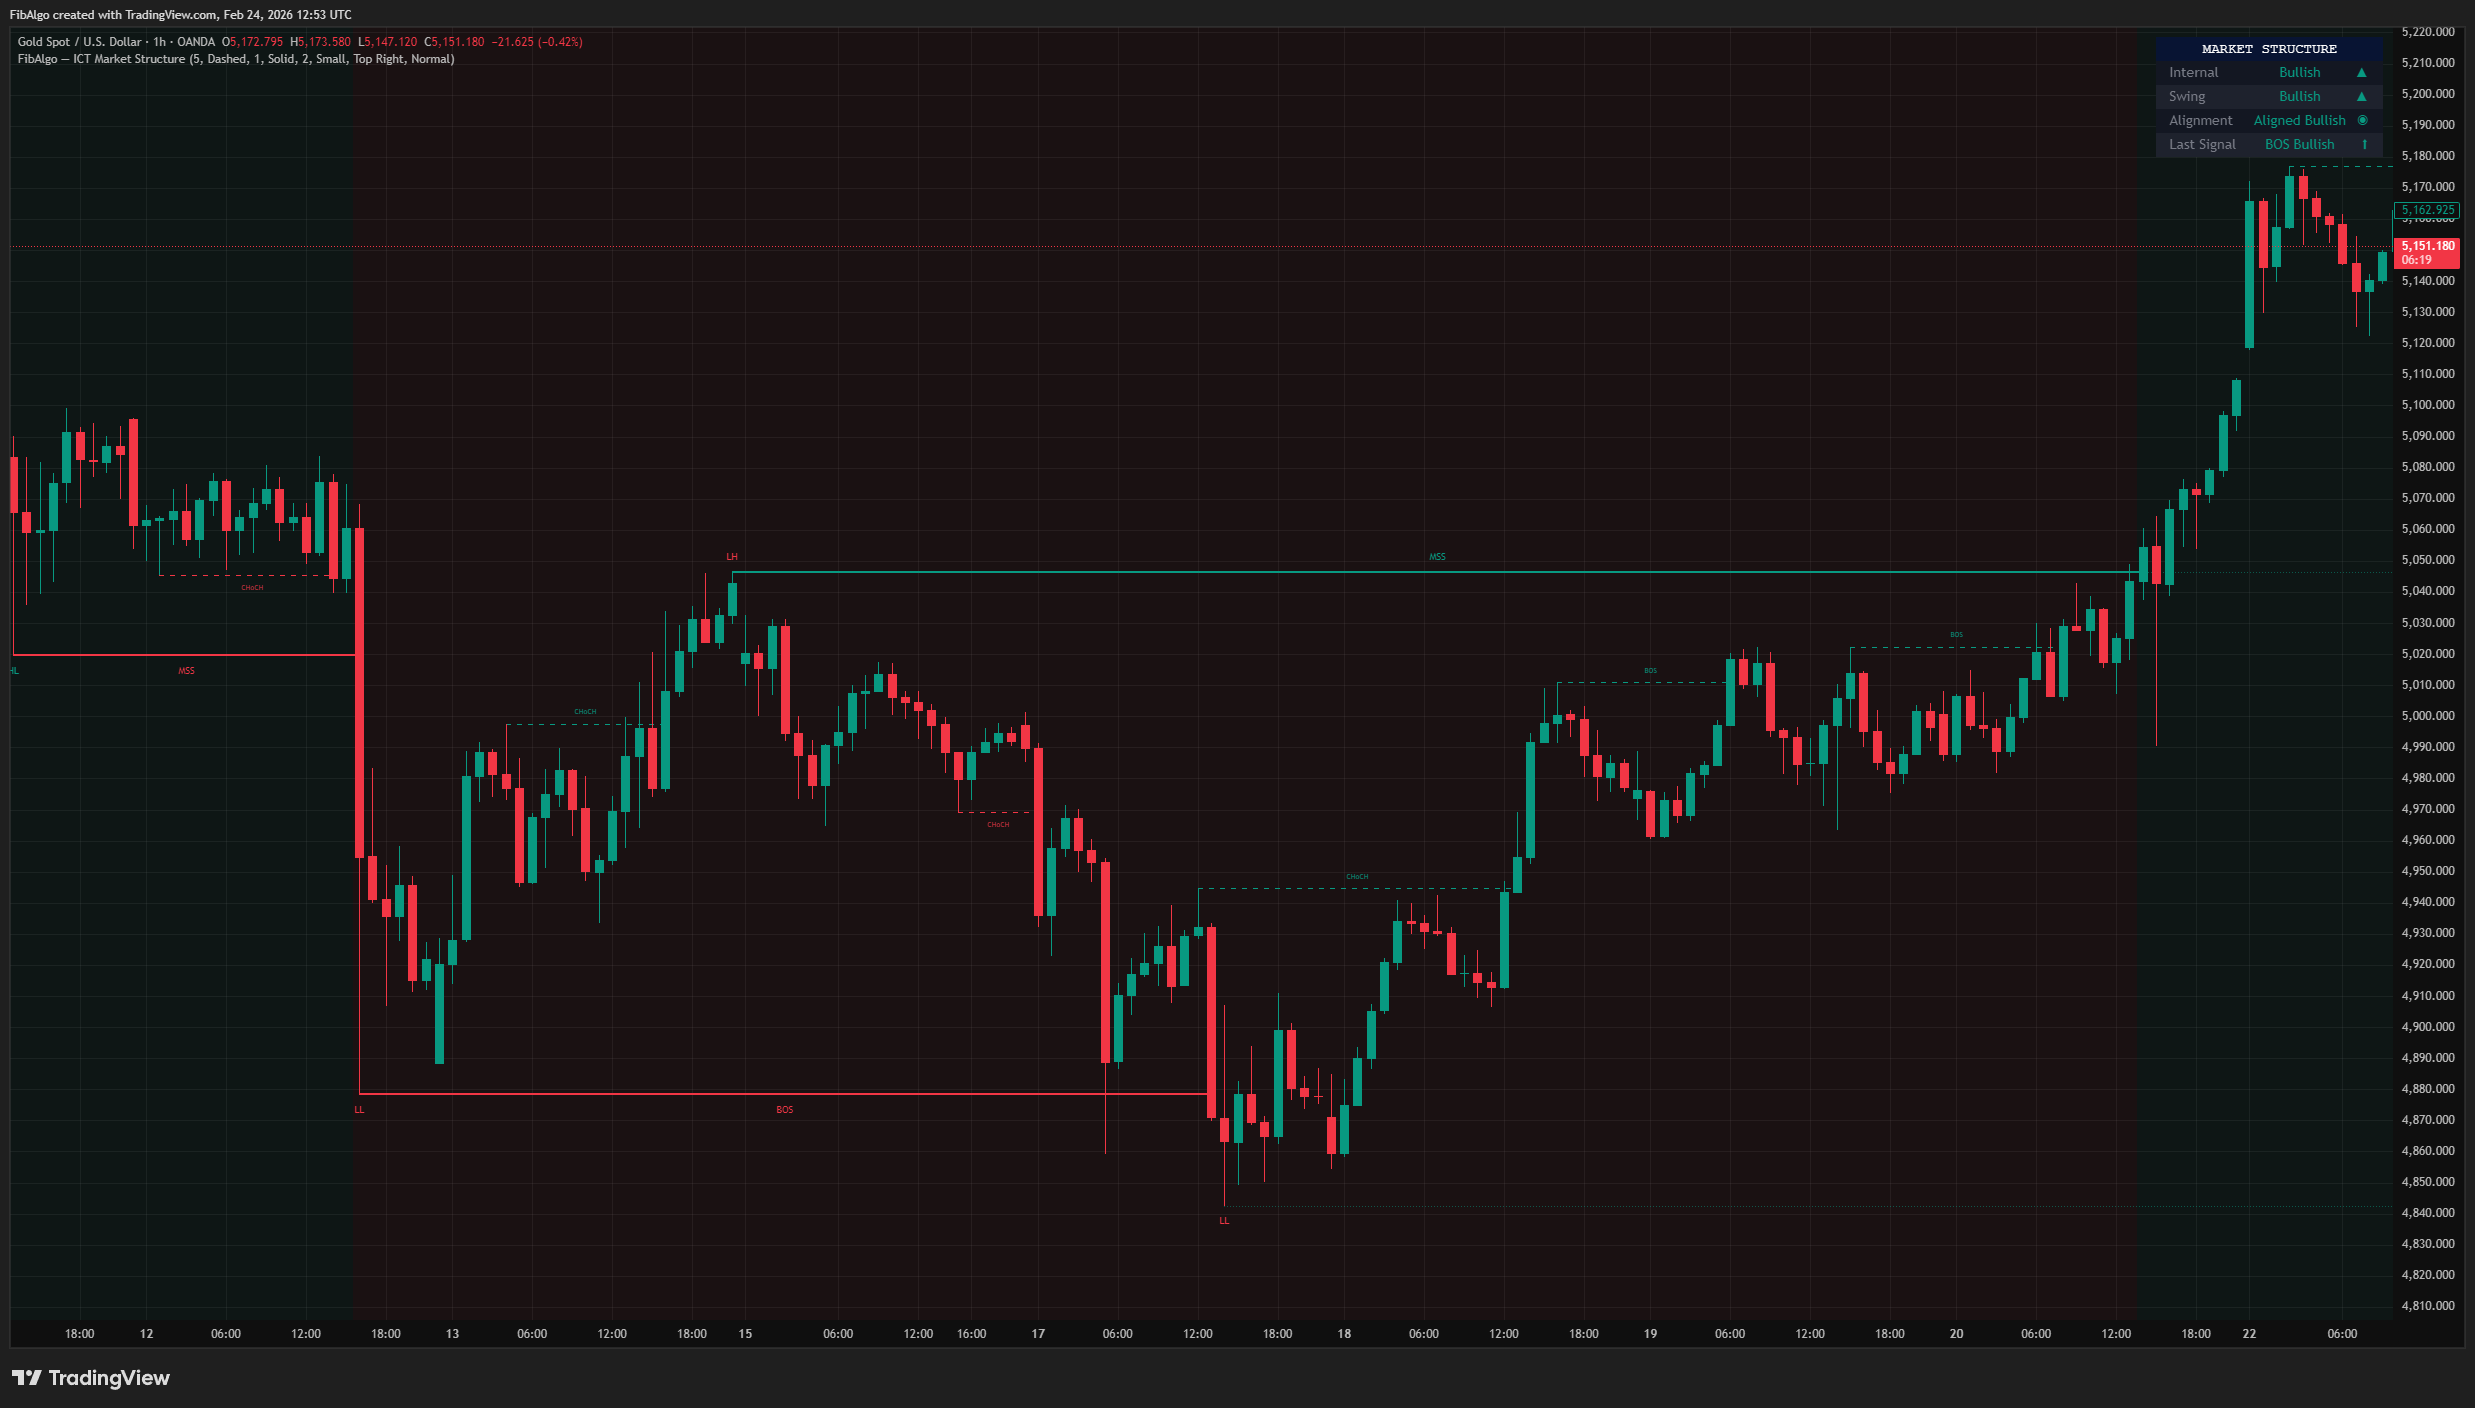
This indicator provides a comprehensive visualization of ICT (Inner Circle Trader) Market Structure concepts. It identifies Break of Structure (BOS), Change of Character (CHoCH), and Market Structure Shift (MSS) events across two independent structural layers — Internal and Swing — giving traders a clear, multi-layered view of trend direction and potential reversals.
Key Concepts
- Break of Structure (BOS) — A continuation signal. In a bullish trend, a new swing high exceeding the previous swing high confirms the trend is intact. In a bearish trend, a new swing low below the previous swing low confirms continuation.
- Change of Character (CHoCH) — An internal reversal signal. When price breaks the opposing swing point within the current trend (e.g., breaking below the last swing low during a bullish internal trend), it signals a potential change in short-term direction.
- Market Structure Shift (MSS) — A swing-level reversal signal. Similar to CHoCH but occurring at the higher-degree swing structure, representing a more significant trend reversal with higher conviction.
- Swing Point Classification (HH/HL/LH/LL) — Each confirmed swing pivot is classified relative to its predecessor: Higher High (HH), Higher Low (HL), Lower High (LH), or Lower Low (LL), providing immediate visual context of the trend's health.
How It Works
The indicator operates on two independent structural layers, each using pivot-based swing detection:
1. Internal Structure Uses the base Swing Length parameter to detect short-term pivots. When a new pivot is confirmed, it sets a key level. The break signal fires in real-time the moment price closes beyond that level — producing BOS (continuation) or CHoCH (reversal) signals. This layer captures quick shifts in momentum. 2. Swing Structure Uses a 3x multiplier of the Swing Length for higher-degree pivot detection. Like Internal Structure, break signals fire in real-time when price closes beyond the established swing level. This layer generates BOS (continuation) and MSS (reversal) signals at the major structural level. MSS events carry more weight as they represent confirmed trend reversals at the macro level.Detection Logic
- Swing highs and lows are confirmed using a left/right bar lookback (Swing Length parameter). These confirmed pivots establish the key structural levels.
- Break detection is real-time: when the current candle's close crosses above a pivot high level or below a pivot low level, the signal fires immediately on that breakout candle — no additional confirmation delay.
- In a bullish trend: close above the last pivot high = BOS Up (continuation); close below the last pivot low = CHoCH/MSS Down (reversal).
- In a bearish trend: close below the last pivot low = BOS Down (continuation); close above the last pivot high = CHoCH/MSS Up (reversal).
- Each level can only trigger once. A new pivot must form to establish a fresh level for the next potential break.
- When both Internal and Swing signals fire at the same price level, only the Swing signal is displayed to avoid visual clutter.
- The first swing point in the classification sequence is skipped to avoid false labeling.
Features
- Dual-Layer Structure — Internal and Swing structure tracked independently with separate visual styles.
- BOS / CHoCH / MSS Labels — Horizontal lines with text labels at the exact broken level, connecting the origin bar to the break bar.
- HH / HL / LH / LL Classification — Swing point labels at each confirmed major pivot.
- Active Level Lines — Dotted horizontal lines showing the current swing high and low being tracked. When these levels break, a new BOS or MSS is triggered.
- Trend Background — Subtle background color indicating the current swing trend direction.
- Dashboard — Optional info panel showing Internal trend, Swing trend, Alignment status, and Last Signal with directional icons (disabled by default).
- Full Customization — Independent colors for each signal type (BOS Up/Down, CHoCH Up/Down, MSS Up/Down), line styles, line widths, and label sizes.
- Alert System — Six configurable alerts: BOS Bullish/Bearish, CHoCH Bullish/Bearish, MSS Bullish/Bearish. Each includes price level, symbol, and timeframe.
How to Use
- Trend Identification: When both Internal and Swing structures are aligned (both Bullish or both Bearish), the trend is strong. Conflicting signals may indicate a transition or consolidation phase.
- Entry Timing: Look for MSS or CHoCH events as potential reversal entry signals. BOS events confirm the trend is continuing and can be used for trend-following entries.
- Active Levels: The dotted active lines show you exactly which levels need to break for the next structural event. Monitor these as key decision points.
- Multi-Timeframe: Apply the indicator on multiple timeframes. Use a higher timeframe for bias (Swing Structure) and a lower timeframe for entries (Internal Structure).
- Swing Length: Lower values (2-3) create more sensitive, frequent signals. Higher values (8-15) produce fewer but more significant structural events.
Limitations
- Pivot establishment requires a lookback period (Swing Length bars for Internal, 3x Swing Length bars for Swing). However, once a level is set, the break signal fires in real-time on the actual breakout candle.
- This indicator identifies structure — it does not generate buy/sell signals. It should be combined with other analysis tools (order blocks, fair value gaps, liquidity levels, etc.) for complete trade setups.
- Performance on very low timeframes (1-minute or less) may produce excessive signals. Adjust the Swing Length parameter accordingly.
- The first few swing points on any chart will not be classified (HH/HL/LH/LL) as there is no prior reference point for comparison.
Tags
#Market Structure#Smart Money#Price Action