Overview
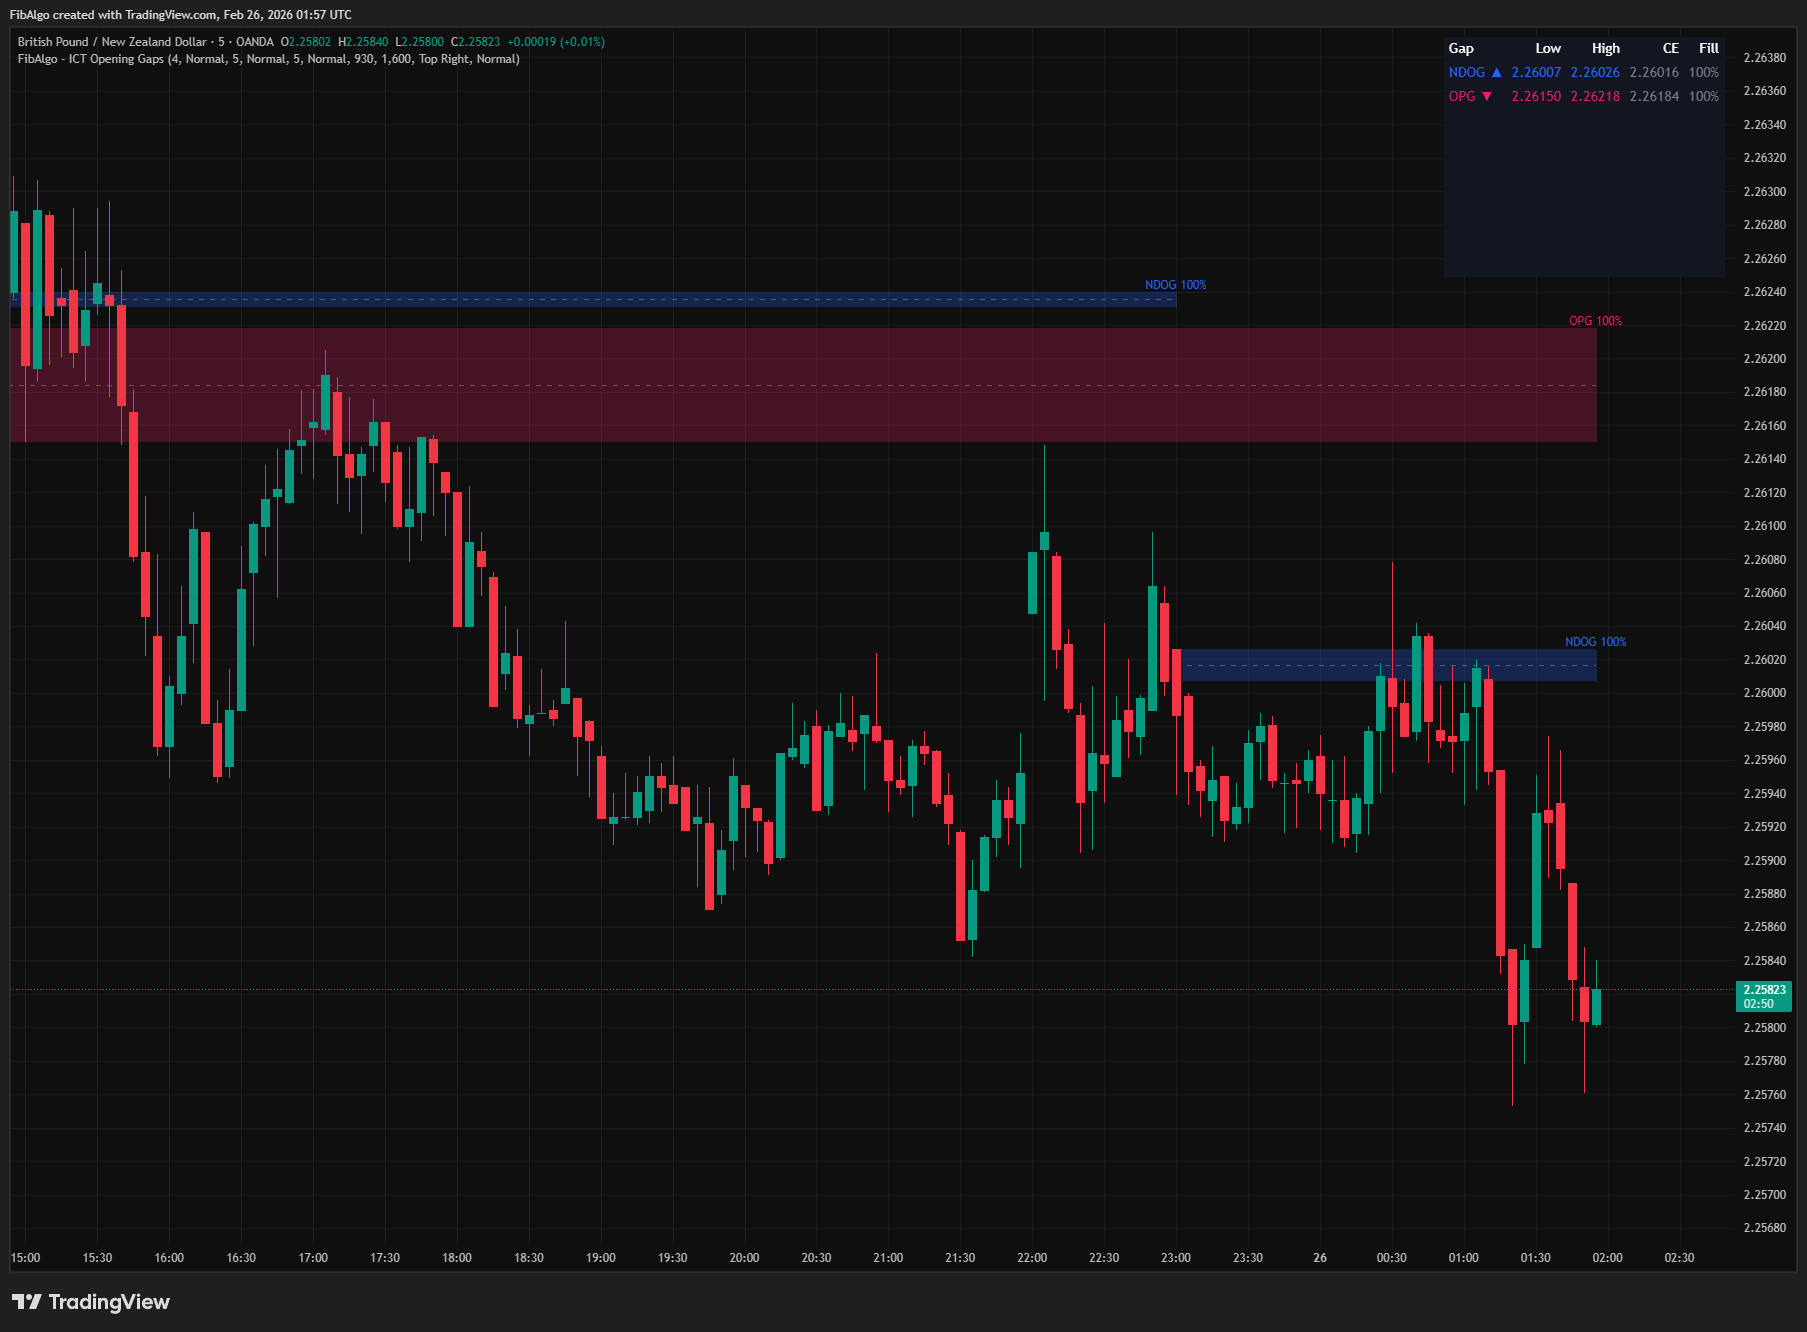
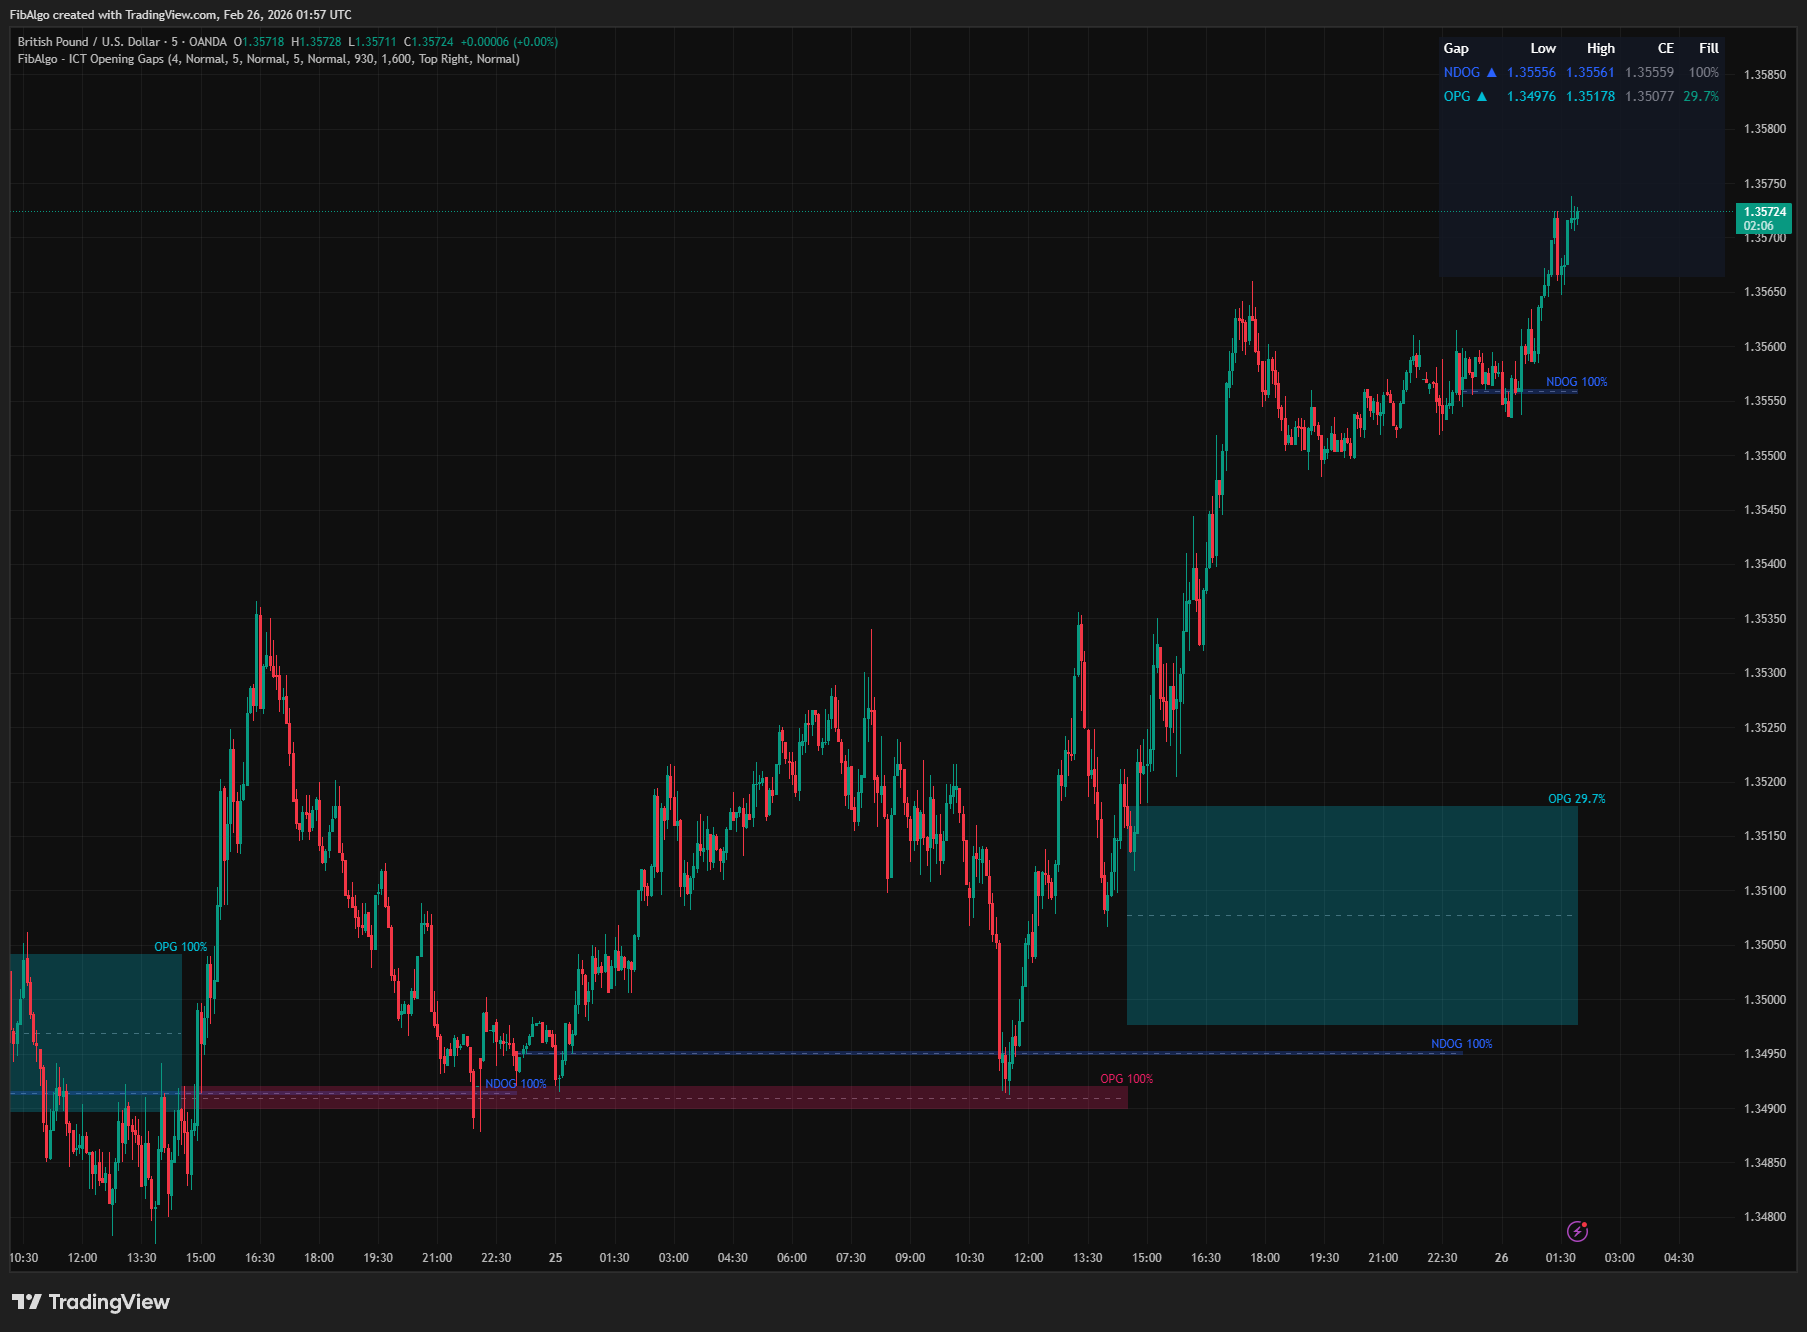
This indicator automatically detects and draws the three key ICT opening gap types: New Week Opening Gap (NWOG), New Day Opening Gap (NDOG), and Opening Price Gap (OPG). Each gap is displayed as a colored zone with a Consequent Encroachment (CE) midline. The indicator tracks gap fill progress in real time and shows historical gaps with configurable depth. A status table summarizes the latest gap from each type.
Key Concepts
- NWOG (New Week Opening Gap) — The price gap between Friday's close (5:00 PM ET) and Sunday's open (6:00 PM ET). This gap represents the change in institutional positioning over the weekend. Price often revisits the NWOG during the week, and it acts as a magnet level, support, or resistance.
- NDOG (New Day Opening Gap) — The price gap between the previous day's close (5:00 PM ET) and the current day's open (6:00 PM ET) in futures markets. This gap reflects overnight institutional activity and tends to fill during the following session. ICT treats these as key reference zones for intraday trading.
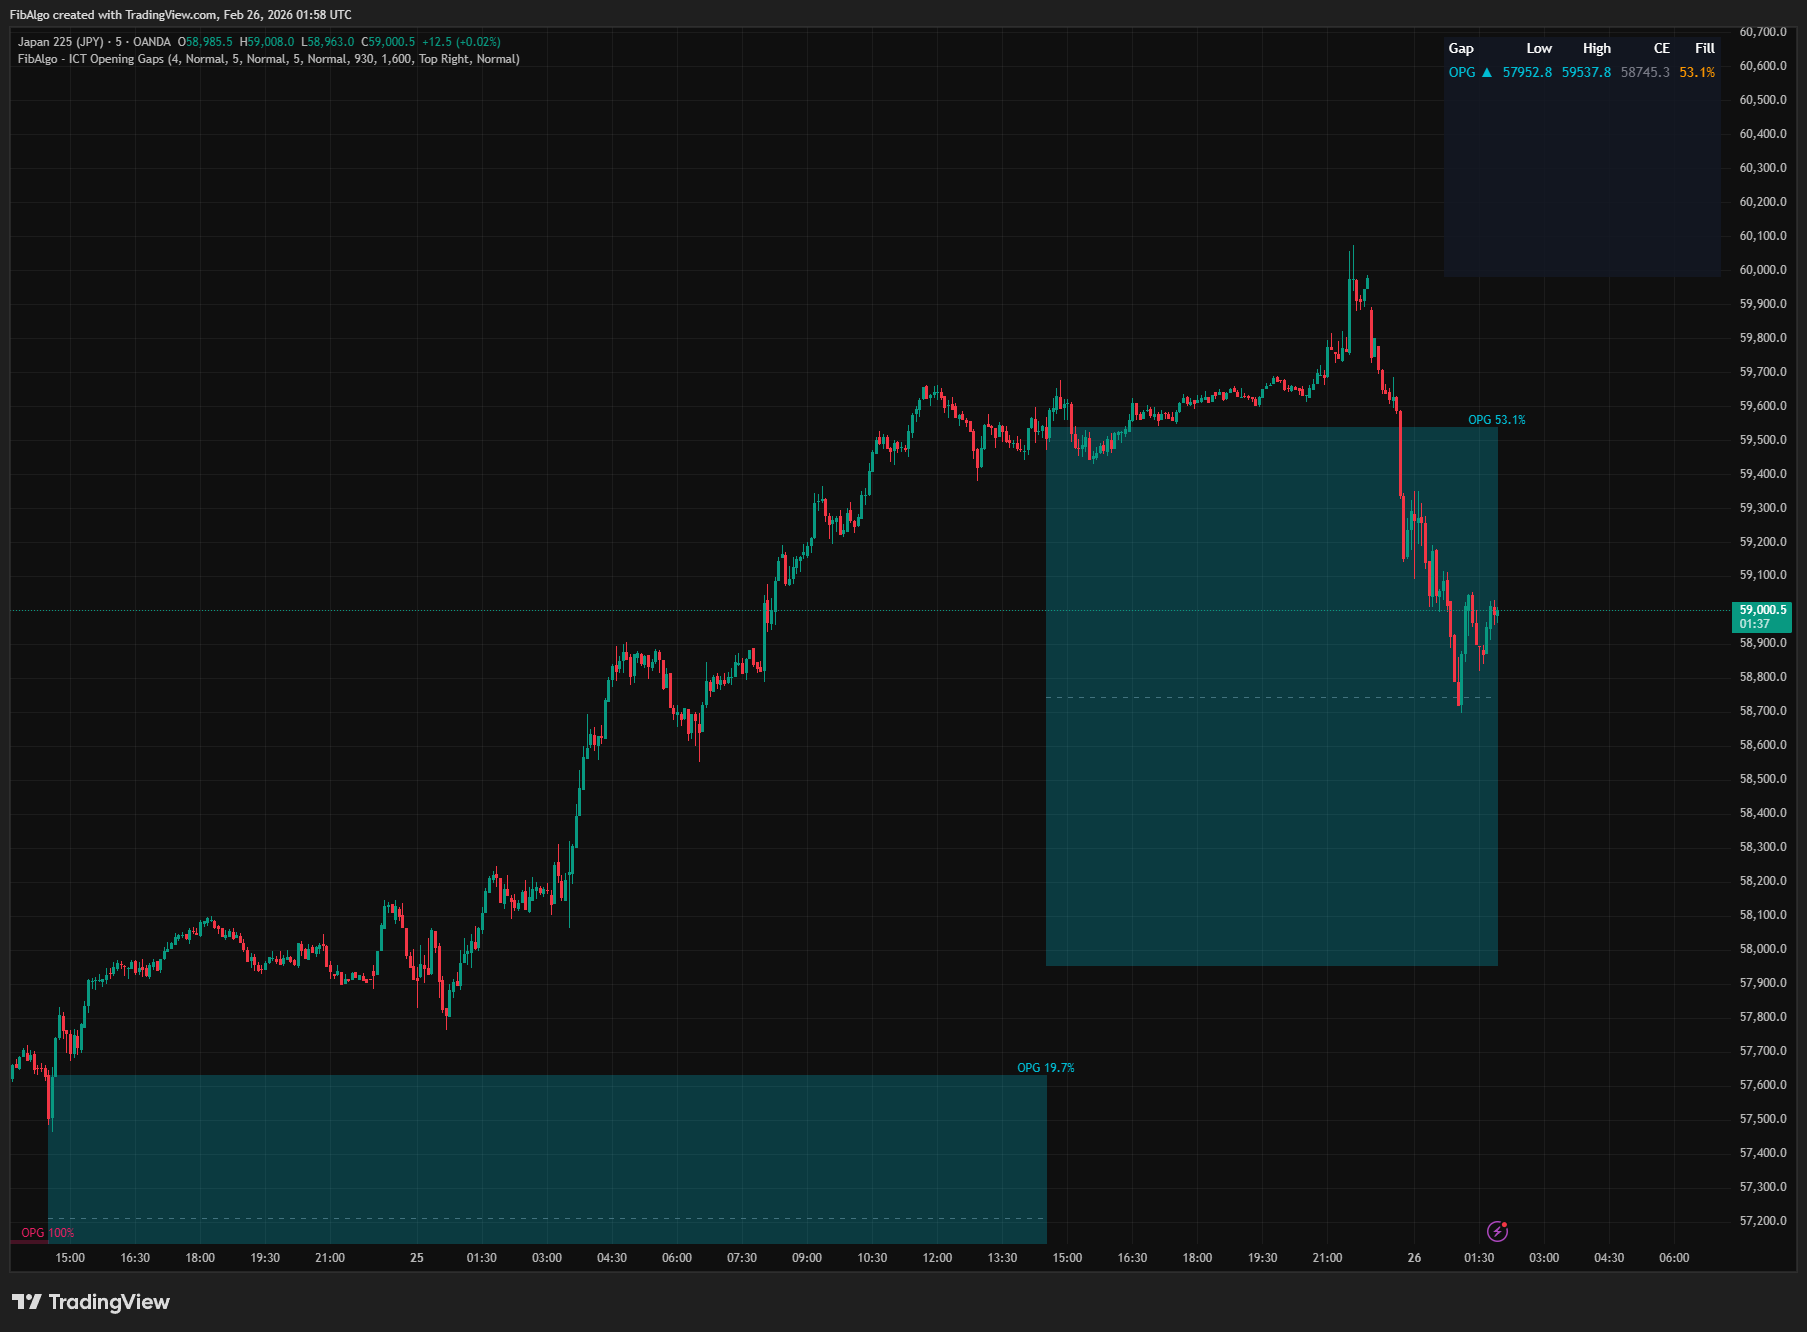
- OPG (Opening Price Gap) — The gap between Regular Trading Hours (RTH) close and the next RTH open. This is the traditional "opening gap" seen on equity and futures charts. RTH times are user-configurable (default: 9:30 AM – 4:00 PM ET).
- Consequent Encroachment (CE) — The 50% midpoint of any gap zone. In ICT methodology, the CE level is where price is most likely to react within a gap. It acts as a "fair value" reference within the gap range.
- Gap Fill Tracking — The indicator measures how much of each gap has been filled as price moves through it. A gap is considered 50% filled at the CE level and 100% filled when price has traded through the entire zone.
How It Works
1. NWOG (New Week Opening Gap) The indicator captures Friday's close at 5:00 PM ET and detects Sunday's open at 6:00 PM ET. The gap between these two prices is drawn as a colored box — green for a bullish gap (Sunday open above Friday close) and red for a bearish gap. If the gap is smaller than 1 tick, it is not drawn. Multiple historical NWOGs can be displayed simultaneously (configurable from 1 to 20). 2. NDOG (New Day Opening Gap) For intraday timeframes, the indicator tracks the close at 5:00 PM ET (end of the ICT True Day) and the open at 6:00 PM ET (start of the new True Day). The gap between these two prices forms the NDOG zone. On daily or higher timeframes, the indicator uses the previous bar's close versus the current bar's open. NDOGs appear daily and are the most frequent gap type. 3. OPG (Opening Price Gap) The OPG tracks the gap between the RTH close and RTH open. RTH start and end times are configurable in settings (default: 9:30 AM and 4:00 PM ET for US equities/futures). The indicator detects the transition from non-RTH to RTH and compares the new RTH open with the previous RTH close. This gap type is relevant for instruments with clearly defined regular trading hours. 4. Consequent Encroachment Each gap zone has an optional CE line drawn at the 50% level. The CE is the midpoint between the gap's high and low edges. It serves as the primary reaction level within any gap — price reaching the CE has effectively "encroached" upon the gap's fair value. CE lines use a dashed style for visual distinction. 5. Gap Fill Tracking The indicator continuously tracks how much of each gap has been filled:- Fill tracking begins from the bar AFTER the gap is detected — the detection bar itself is excluded to prevent false initial readings
- For bullish gaps: fill is measured from the top down (how far price has dropped into the gap)
- For bearish gaps: fill is measured from the bottom up (how far price has risen into the gap)
- Fill percentage is persistent — it only increases, never decreases. Once a gap reaches 60% fill, it stays at 60% even if price moves away. This reflects the ICT principle that a gap fill is a permanent event
- Fill percentage is displayed on the label (optional) and shown in the summary table
- Alerts trigger once per gap at 50% fill and 100% fill — each alert fires exactly once per gap instance to avoid duplicates
Features
- NWOG Detection — Automatic detection of the Friday close to Sunday open gap. Bullish/bearish color-coded. Configurable history depth (1–20 weeks).
- NDOG Detection — Daily gap between 5:00 PM and 6:00 PM ET (True Day transition). Works on all intraday timeframes. Falls back to close-to-open on daily+ charts.
- OPG Detection — RTH close to RTH open gap. Configurable RTH session times (default 9:30–16:00 ET). Adapts to any market's trading hours.
- Consequent Encroachment Lines — Dashed midline on every gap zone showing the 50% level. Togglable per gap type with independent color control.
- Gap Fill Tracking — Persistent, real-time fill percentage for every gap. Fill only increases (never resets). Detection bar is excluded. Displayed on labels and in the summary table.
- Historical Gap Display — Show multiple past gaps per type (1–20). Older gaps that exceed the history limit are automatically cleaned up.
- Bullish/Bearish Coloring — Each gap type has independent bullish and bearish colors. Bullish = gap up, bearish = gap down.
- Extend Mode — Choose between extending gap zones to the current bar or keeping them at their natural width (until the next gap of the same type).
- Per-Group Label Size — Each gap type has an independent Label Size setting (Tiny/Small/Normal).
- Summary Table — Displays latest gap of each type with direction, price range, CE level, and fill status. Configurable position and text size.
- Comprehensive Alerts — 6 alert types: New NWOG Formed, New NDOG Formed, New OPG Formed, CE Level Touch, Gap 50% Filled, Gap Fully Filled (100%). All alerts include symbol and timeframe.
- Timezone-Safe — All session detection uses America/New_York timezone functions. Works correctly regardless of the user's chart timezone setting.
How to Use
- Weekly Bias with NWOG: At the start of each week, note the NWOG direction and its CE level. If price is above the NWOG, weekly bias is bullish. The NWOG CE often acts as a key level for weekly reversals or continuations.
- Daily Bias with NDOG: The NDOG gap direction suggests daily bias. A bullish NDOG indicates buyers stepped in overnight. Price will frequently revisit the NDOG zone during the session — the CE is the primary target.
- OPG for RTH Trading: The opening gap at RTH open is a classic gap-fill target. Incomplete gaps tend to fill during the first few hours of RTH. Watch for price to retrace into the OPG zone and react at the CE level.
- CE as Entry/Exit: When price enters a gap zone, the CE level (50% midpoint) is the most significant reaction point. Use CE as a target for gap-fill trades or as a support/resistance level for reversals.
- Fill Tracking for Trade Management: Monitor fill percentage to gauge whether a gap-fill trade has more room to run. A gap at 80% fill has limited remaining potential. A fresh gap (0%) offers the most trade opportunity.
- Confluence with Other ICT Tools: Gaps often align with other ICT concepts. An NDOG zone that overlaps with an Order Block or FVG creates a high-probability reaction zone. Combine with Market Structure for direction and Killzones for timing.
- Multiple Timeframe Approach: Use NWOG for weekly context, NDOG for daily bias, and OPG for RTH execution. Layering these gap types provides a top-down perspective on institutional positioning.
Limitations
- NWOG requires at least one completed trading week to detect the first gap. On the first week of chart data, no NWOG will appear.
- NDOG detection on intraday timeframes uses the ICT True Day (5PM–5PM ET cycle). On daily and higher timeframes, it falls back to the simple close-to-open gap.
- OPG detection requires intraday timeframes. On daily or higher charts, OPGs are not detected.
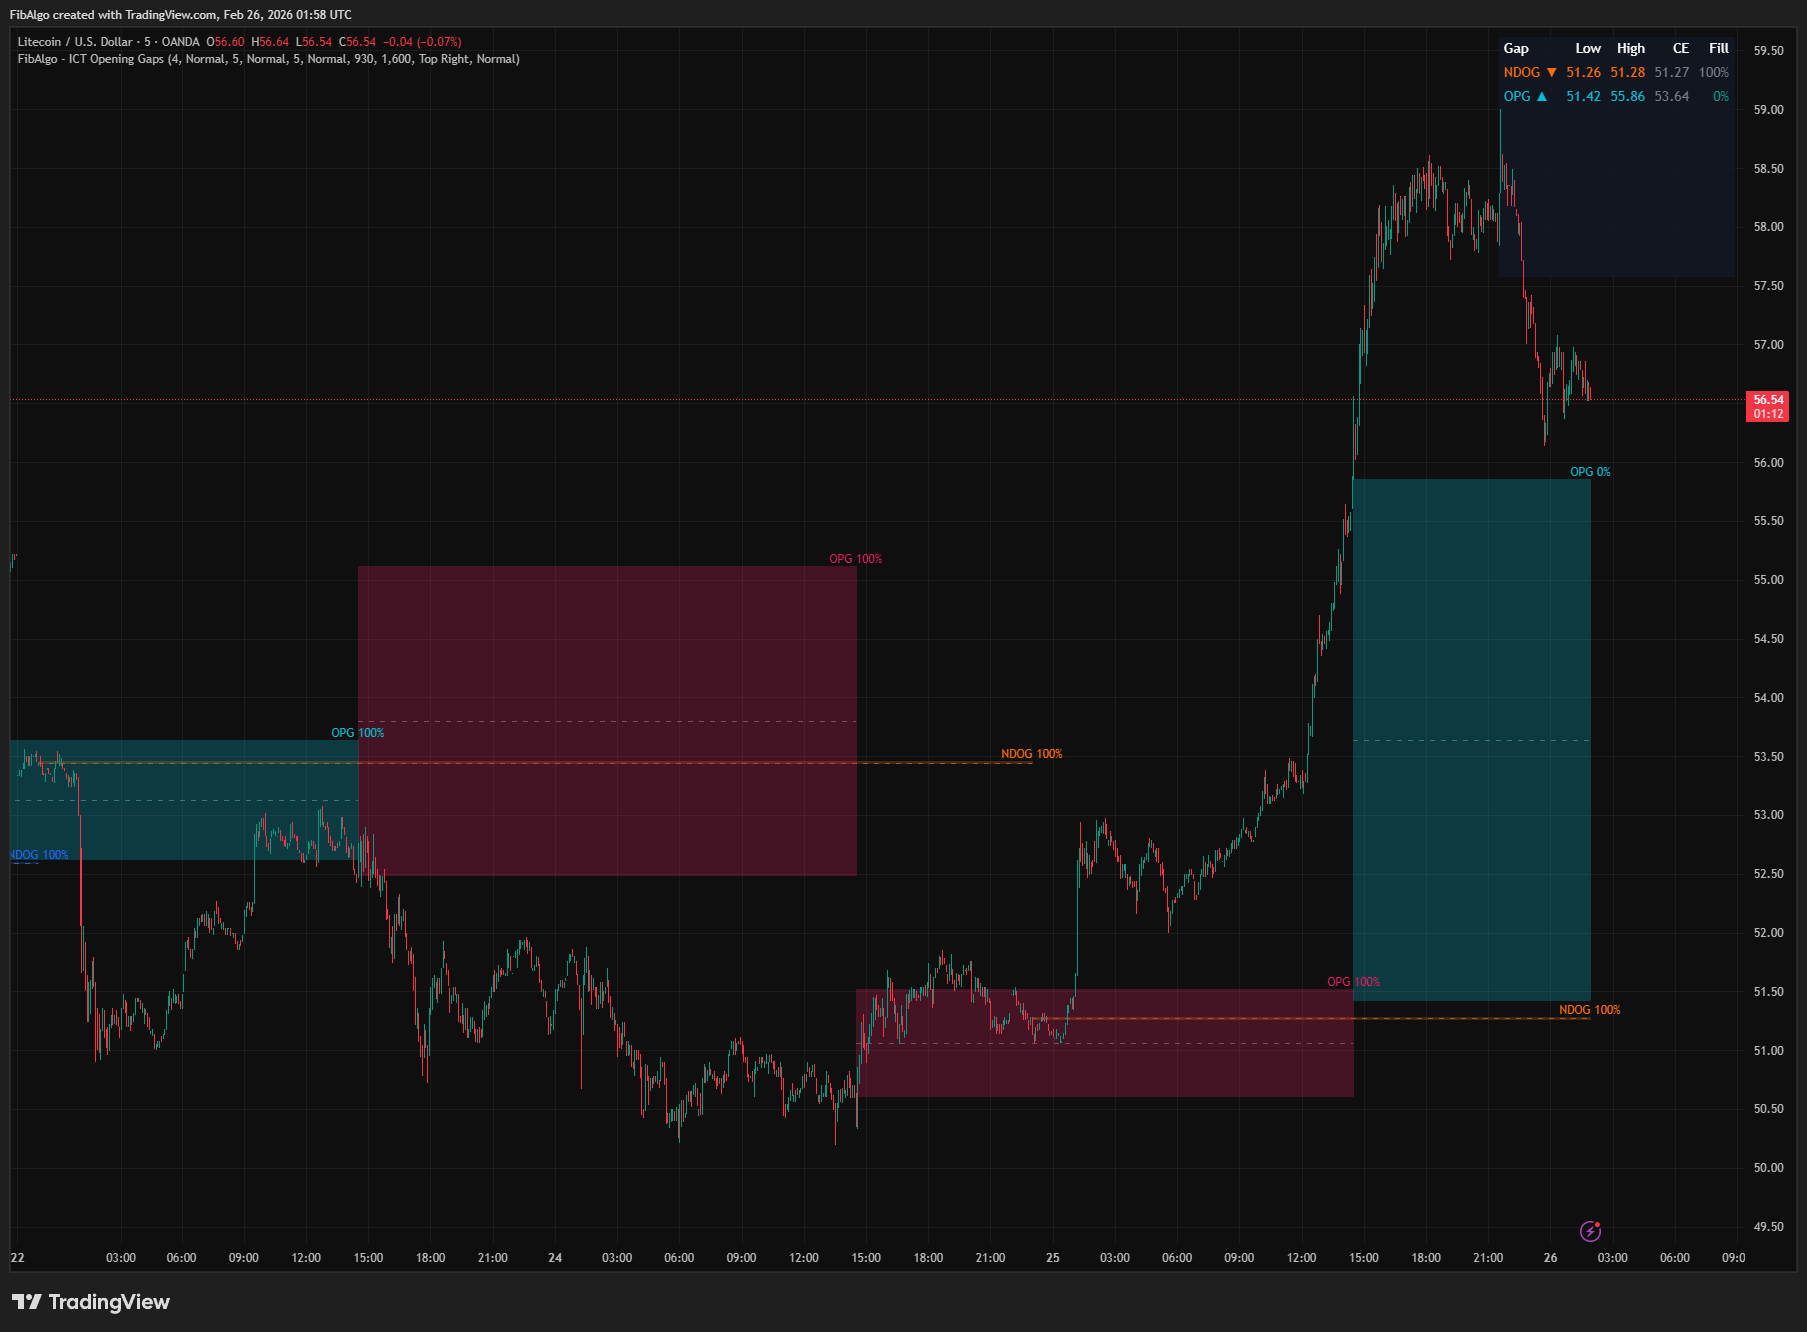
- Gap detection relies on the America/New_York timezone. The ICT True Day concept (5PM–6PM ET transition) applies primarily to US futures. For instruments that trade continuously (e.g., crypto), NDOG gaps may not form meaningfully.
- RTH times for OPG are user-configurable but default to US equity/futures hours. Adjust for your market (e.g., European indices).
- Fill percentage tracking begins from the bar after the gap's detection bar. The detection bar itself is excluded to prevent instant false fill readings. Historical fill data from before the indicator was applied is not available.
- This indicator displays gap reference zones — it does not generate buy/sell signals. Use in conjunction with ICT Market Structure, Order Blocks, Fair Value Gaps, and Key Levels for a complete trading framework.
Tags
#Smart Money#Price Action#Sessions & Time