Overview
FibAlgo - ICT Dealing Range automatically identifies significant dealing ranges on any chart and divides them into Premium, Discount, and Equilibrium zones based on ICT methodology. The indicator maps Internal Range Liquidity (IRL) by detecting Fair Value Gaps within each range and marks External Range Liquidity (ERL) at the range boundaries with Buy Side Liquidity (BSL) and Sell Side Liquidity (SSL) labels. It provides Optimal Trade Entry (OTE) zones, quarter levels, range break detection, and a real-time info table.
Key Concepts
- Dealing Range — The price range between a significant swing high and swing low where institutional activity occurs. Identified automatically using configurable pivot detection.
- Premium Zone — The upper 50% of the dealing range, above the Equilibrium level. Institutional sellers are expected to operate in this zone.
- Discount Zone — The lower 50% of the dealing range, below the Equilibrium level. Institutional buyers are expected to operate in this zone.
- Equilibrium (EQ) — The exact 50% midpoint of the range. Serves as the dividing line between premium and discount territory.
- Optimal Trade Entry (OTE) — ICT's preferred retracement zone at 62%–79% of the range. Buy OTE sits in the discount zone (21–38%), Sell OTE sits in the premium zone (62–79%).
- Internal Range Liquidity (IRL) — Liquidity targets inside the dealing range, primarily Fair Value Gaps. When price moves from External Range Liquidity, it seeks IRL targets.
- External Range Liquidity (ERL) — Liquidity resting outside the range boundaries. Buy Side Liquidity (BSL) above the range high, Sell Side Liquidity (SSL) below the range low.
How It Works
1. Range Detection The indicator uses pivot-based swing detection to identify significant swing highs and swing lows. When a new pivot high and pivot low pair is confirmed, they define a Dealing Range. A minimum size filter in ATR units ensures only significant ranges are tracked. 2. Zone Calculation Each dealing range is divided into key levels:- Premium zone — upper half (above 50%)
- Discount zone — lower half (below 50%)
- Equilibrium — 50% midpoint
- Buy OTE — 21.4% to 38.2% (62–79% retracement from high)
- Sell OTE — 61.8% to 78.6% (62–79% retracement from low)
- Quarter levels — 25% and 75%
- BSL — at the range high, indicating resting buy stop orders above.
- SSL — at the range low, indicating resting sell stop orders below.
Features
- Automatic Range Detection — Identifies dealing ranges from pivot swings with configurable sensitivity.
- Premium / Discount Zones — Color-coded fill divides the range at the Equilibrium level.
- Equilibrium Line — Dashed line at the 50% midpoint with an end-label.
- Dual OTE Zones — Buy OTE (21–38%) in discount and Sell OTE (62–79%) in premium, based on 62%–79% Fibonacci retracement.
- Quarter Levels — Dotted lines at 25% and 75% of the range for additional reference.
- IRL Detection — Fair Value Gaps within active ranges are automatically identified and displayed as Internal Range Liquidity targets.
- IRL Mitigation Tracking — IRL zones that are fully mitigated turn gray with a dotted border.
- ERL Labels — BSL and SSL labels at range boundaries identify External Range Liquidity targets with detailed tooltips.
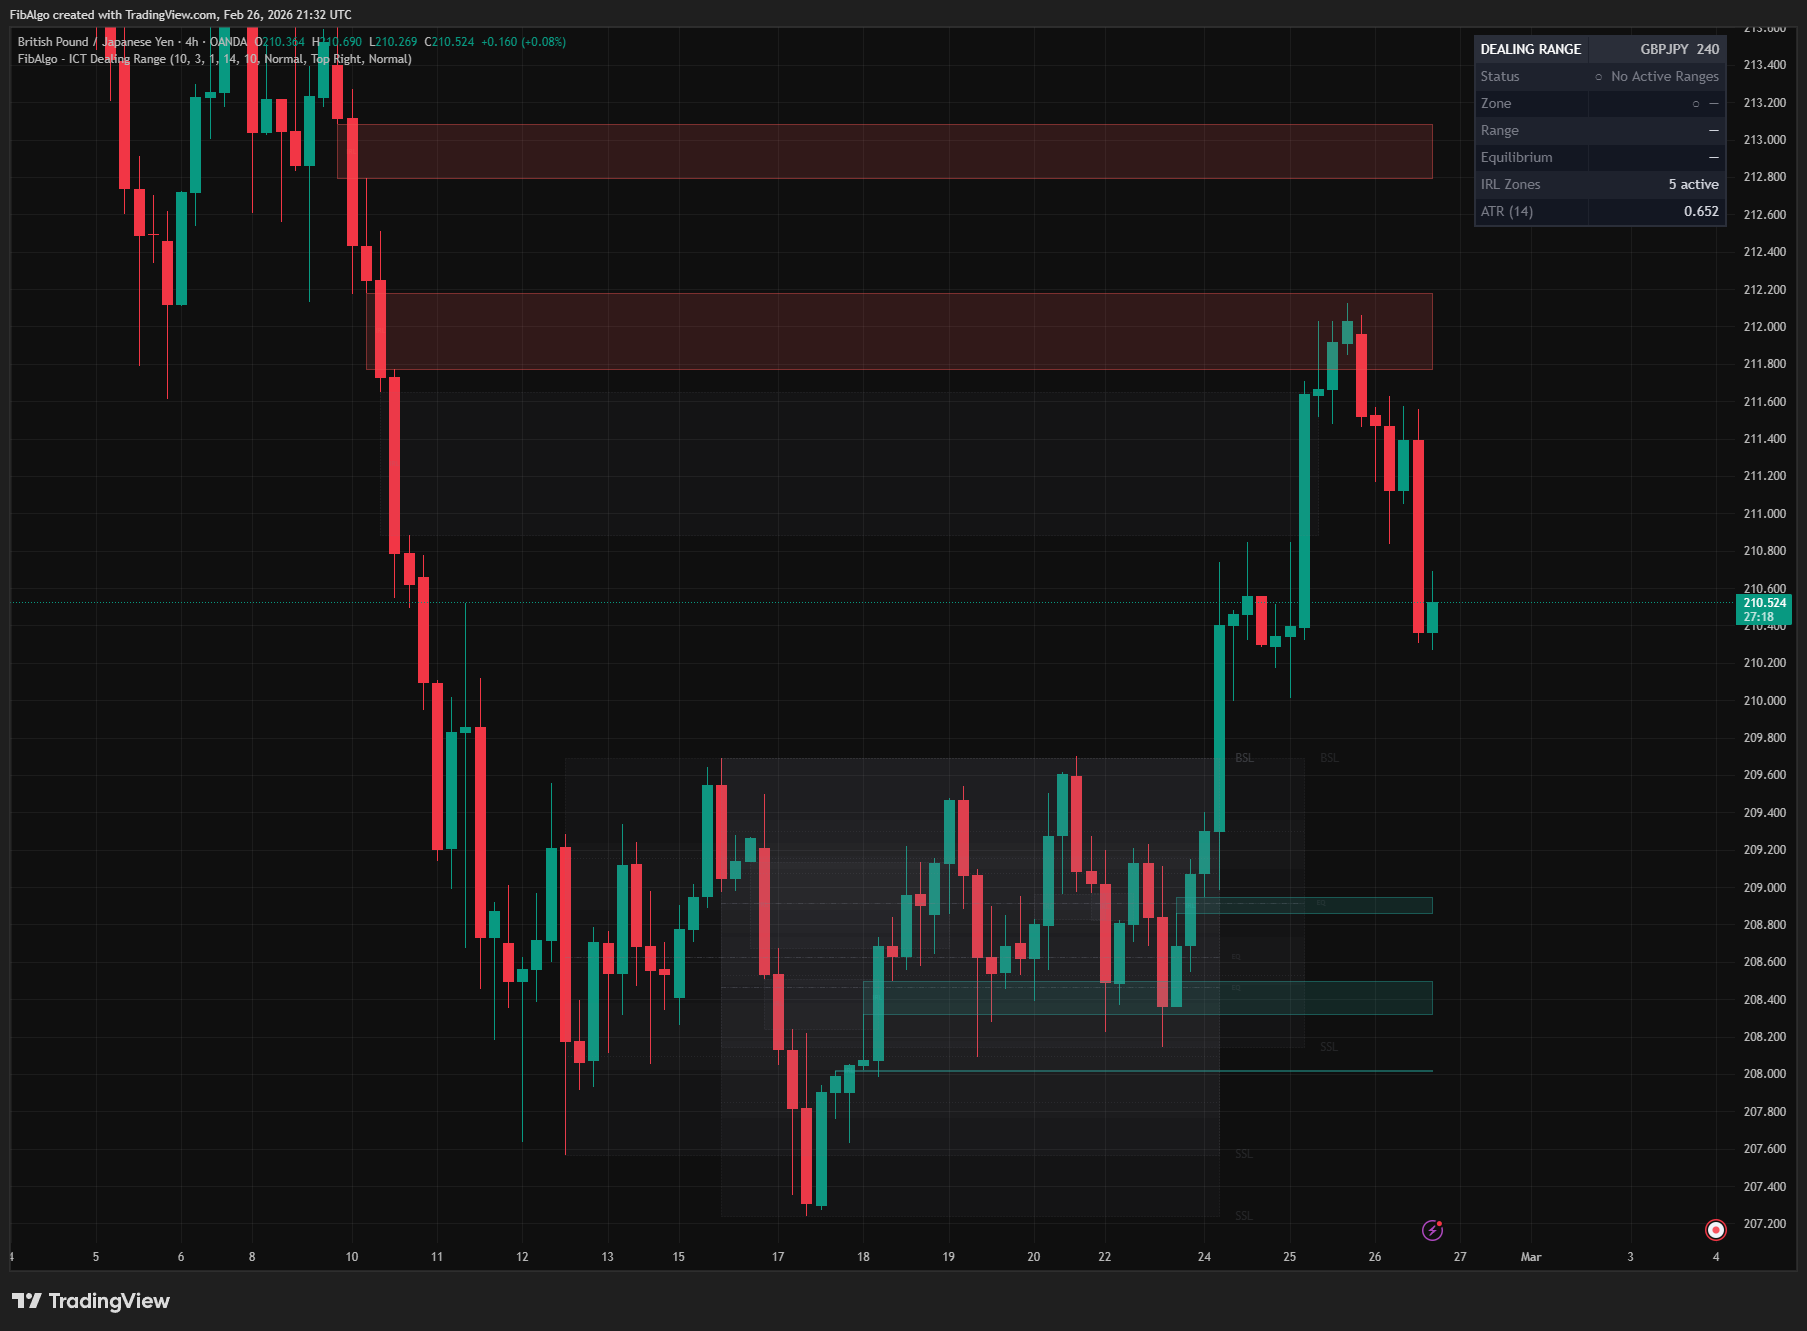
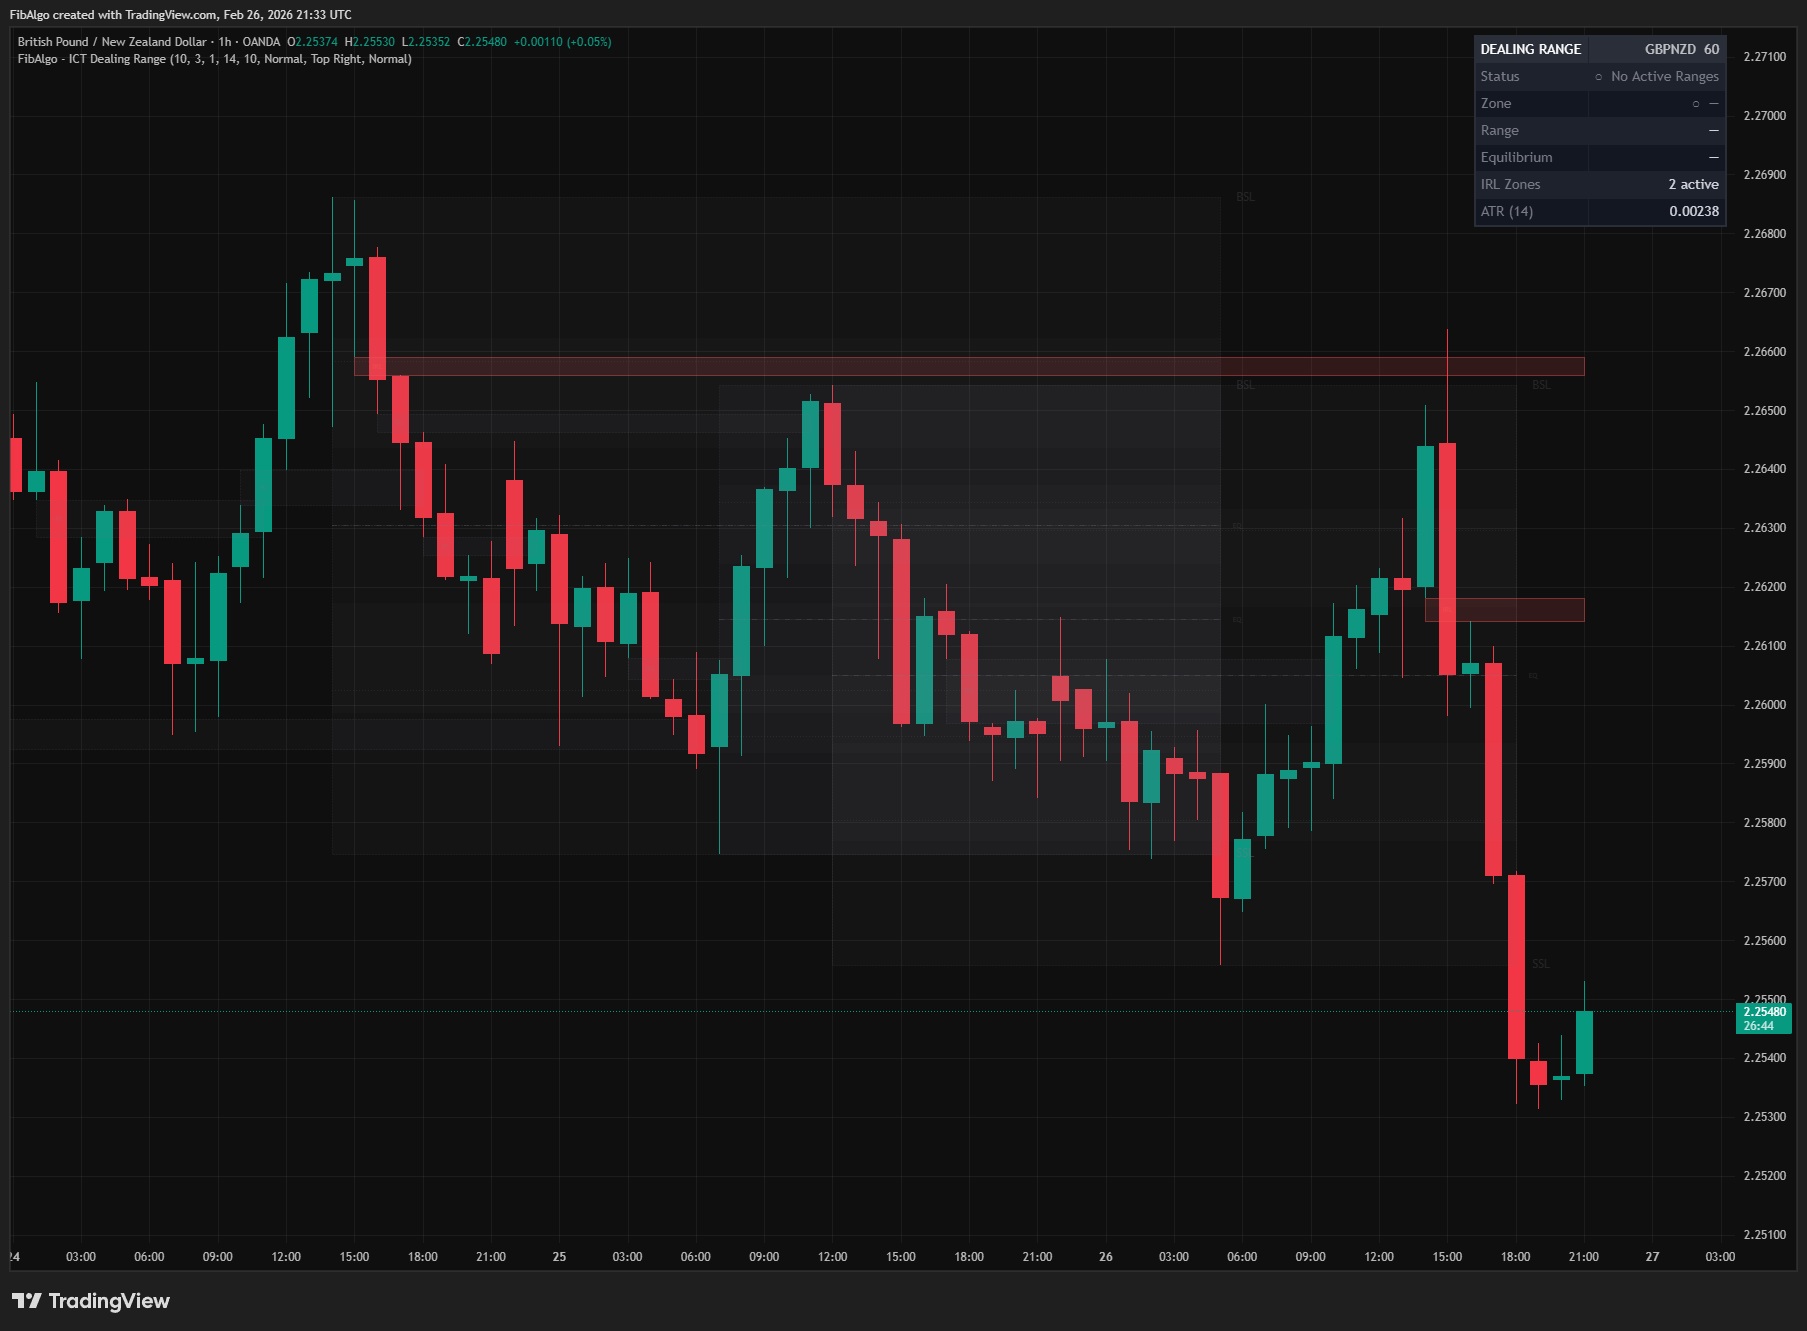
- Range Break Visual — Broken ranges are grayed out with dotted borders to clearly distinguish active from invalidated ranges.
- Multiple Ranges — Displays up to 10 simultaneous dealing ranges (default 3) for multi-range context.
- Min Range Size Filter — ATR-based minimum size filter prevents insignificant small ranges from cluttering the chart.
- Premium / Discount Alert — Alerts when price crosses the Equilibrium level between premium and discount zones.
- Range Break Alert — Alerts when price breaks above or below the dealing range (ERL swept).
- New Range Alert — Alerts when a new dealing range is identified, including range and EQ levels.
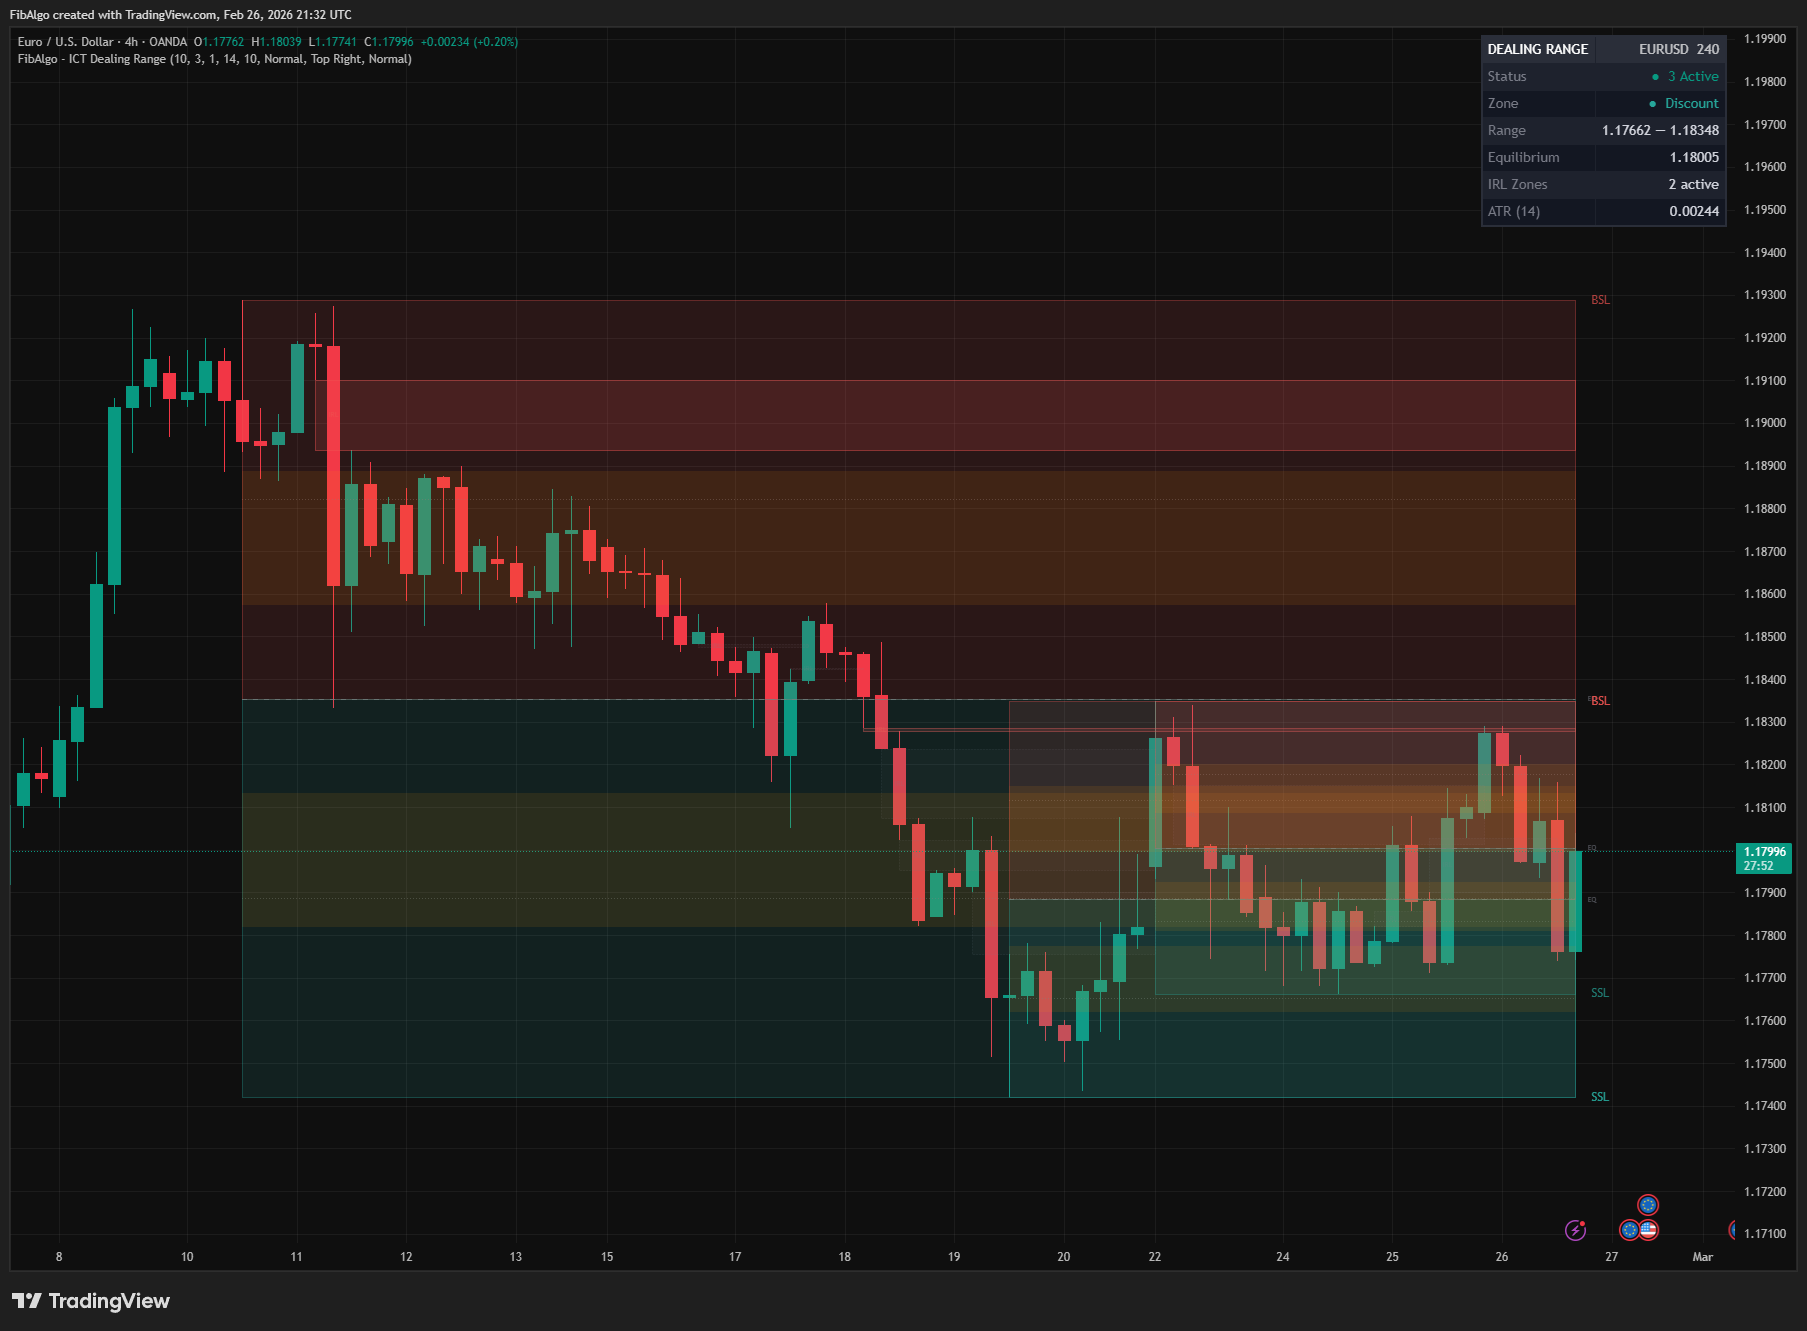
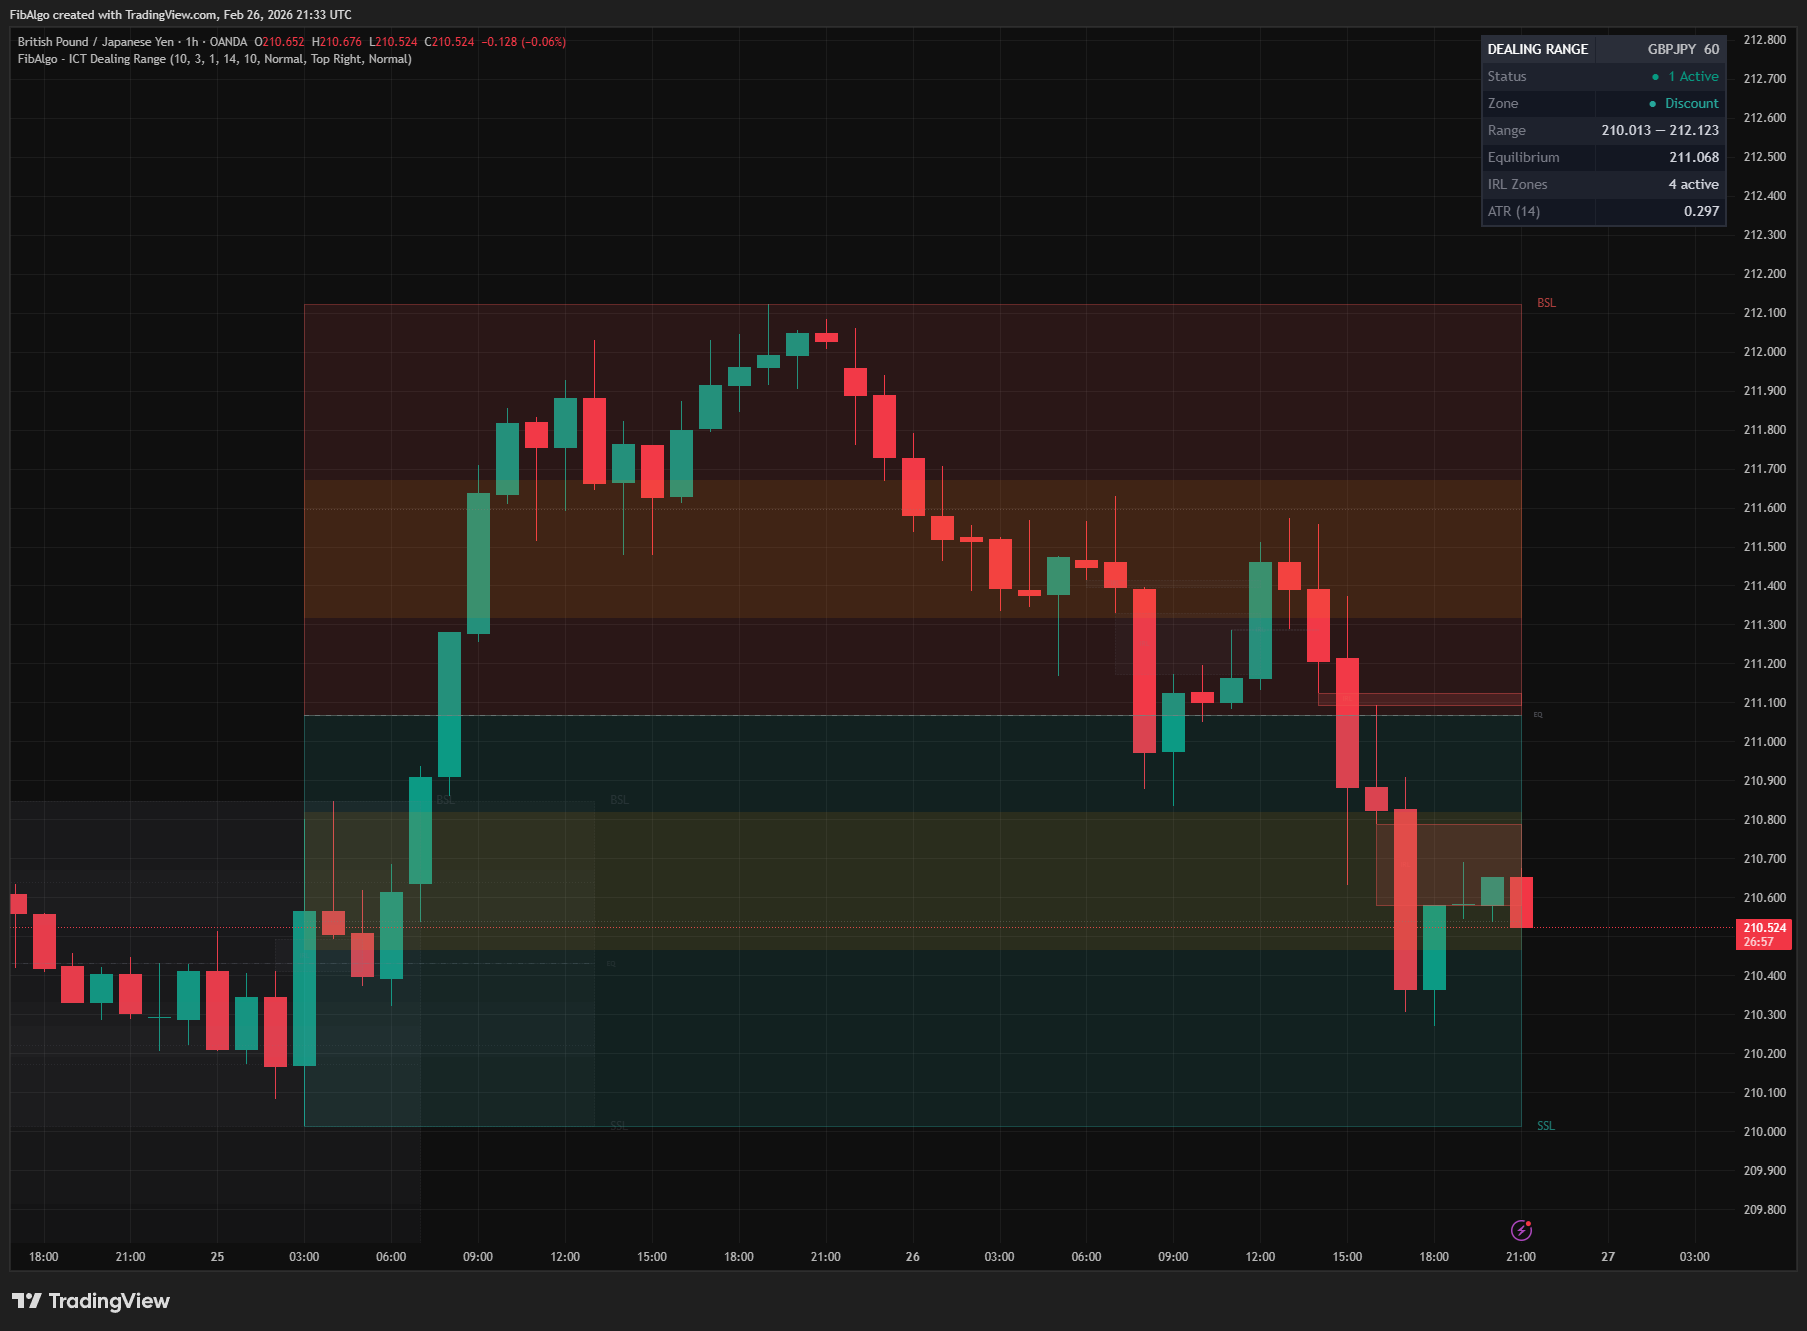
- Info Table — Real-time dashboard showing status, current zone, range boundaries, equilibrium, active IRL count, and ATR.
How to Use
- Add the indicator to your chart. A dealing range will appear once sufficient swing highs and lows are detected.
- The Premium zone (red) is above the Equilibrium; the Discount zone (green) is below. Look for sell setups in premium and buy setups in discount.
- The OTE zones highlight the optimal 62%–79% retracement areas within each half of the range.
- FVGs that form inside the range are labeled IRL — these are internal draw-on-liquidity targets.
- BSL and SSL labels mark external liquidity beyond the range boundaries — these are the breakout targets.
- When a range breaks (turns gray), the dealing range has been invalidated and a new range will likely form.
- Use the info table to quickly check which zone price is in without visual inspection.
- Increase Pivot Length for higher-timeframe ranges; decrease it for shorter-term ranges.
Limitations
- This indicator does not generate buy or sell signals. It is a structural analysis tool that visualizes dealing range zones, IRL, and ERL based on ICT methodology.
- Pivot-based detection has inherent lag equal to the Pivot Length setting. Larger pivot lengths produce more significant ranges but with more delay.
- IRL detection is limited to Fair Value Gaps. Other IRL forms (order blocks, breaker blocks) are not included to keep the indicator focused.
- Only FVGs that fall entirely within the dealing range boundaries are classified as IRL. Partially overlapping gaps are excluded.
- Historical ranges are limited by the Max Dealing Ranges setting. Older ranges are automatically removed.
- Pine Script drawing limits apply (500 boxes, 500 lines, 500 labels).
Tags
#Smart Money#Support & Resistance#Liquidity