Overview
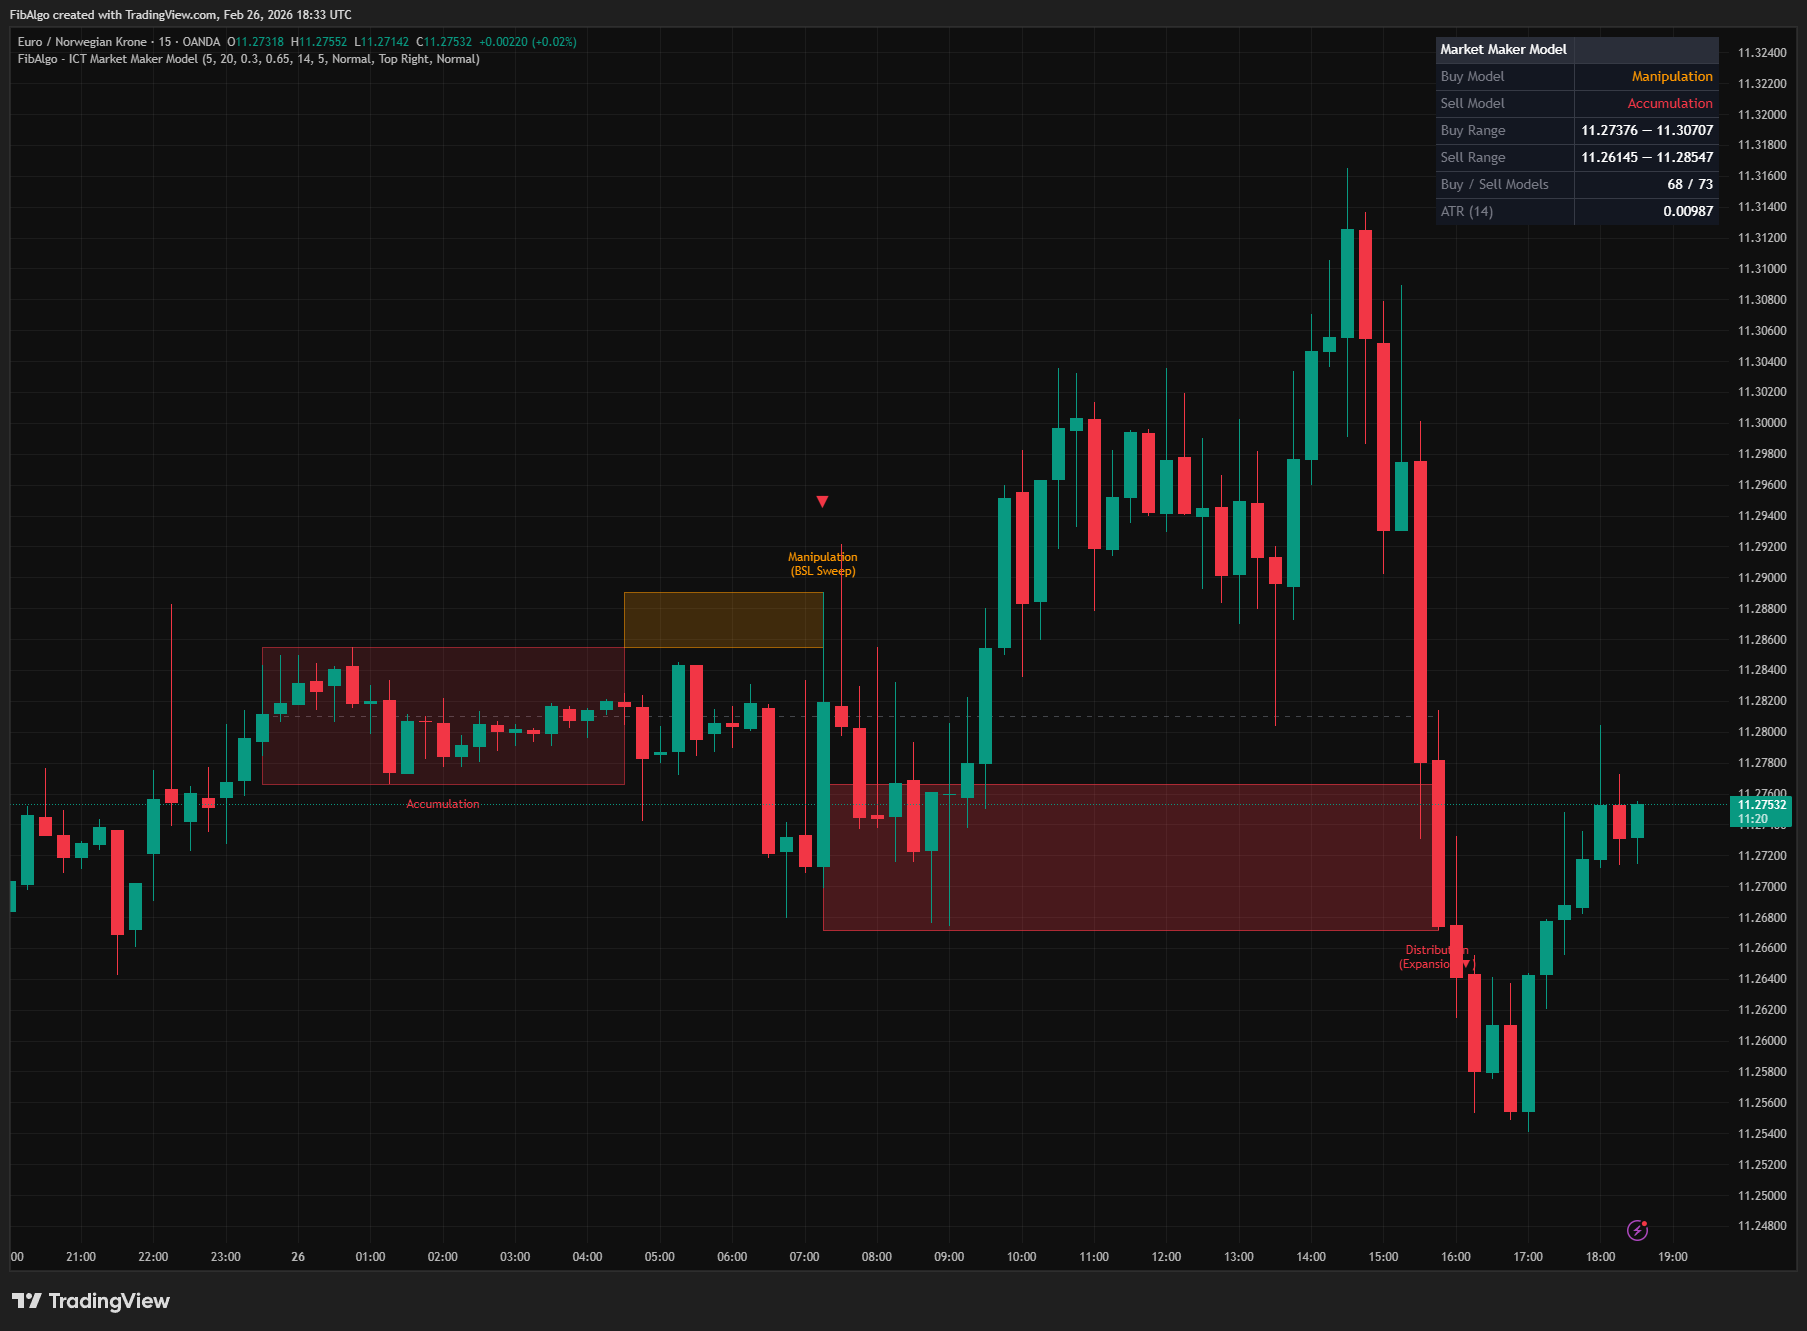
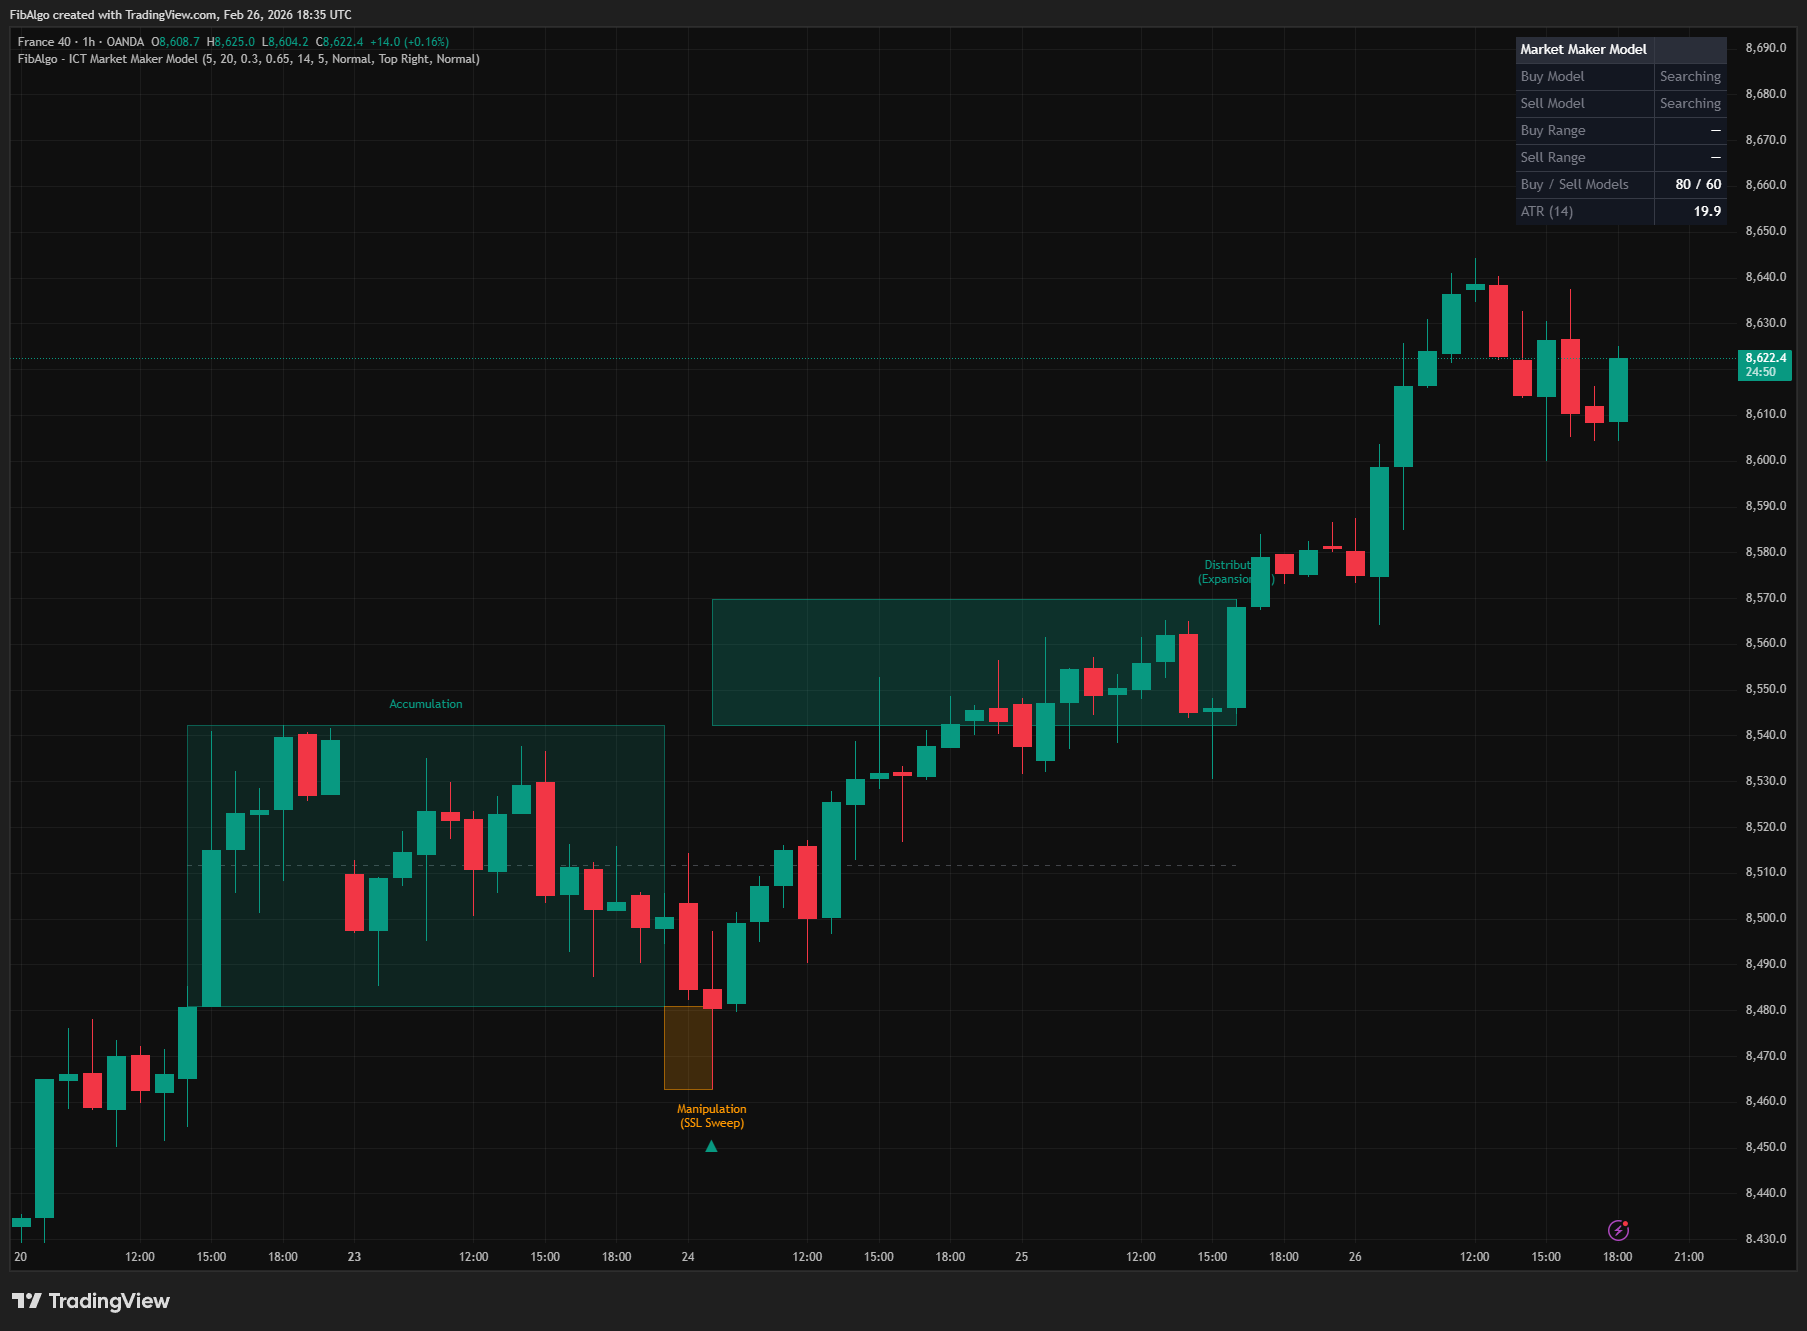
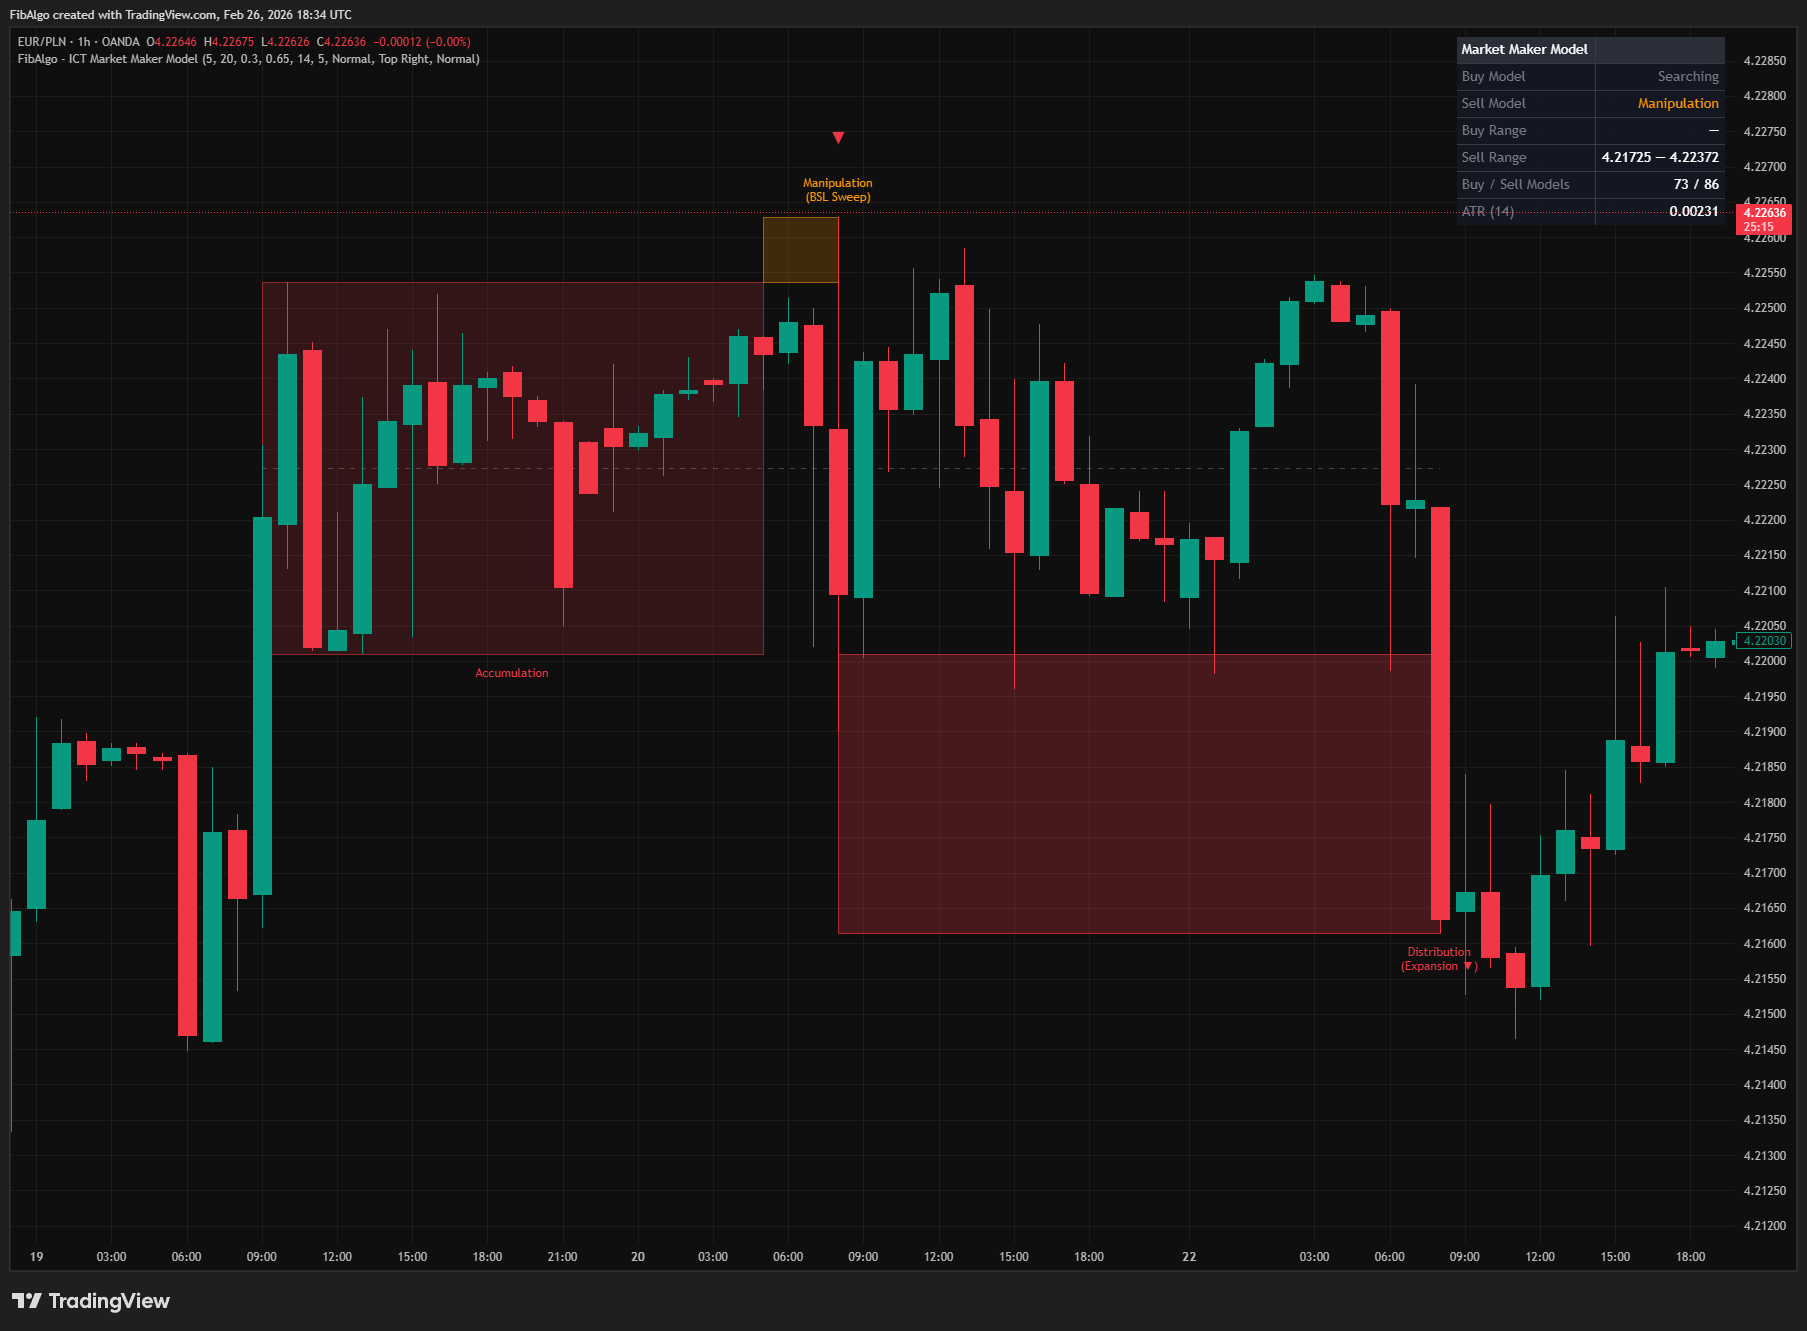
This indicator automatically detects and visualizes ICT's Market Maker Model (MMM) — the three-phase institutional price cycle of Accumulation → Manipulation → Distribution/Expansion. It identifies both the Buy Model (SSL sweep followed by bullish expansion) and the Sell Model (BSL sweep followed by bearish expansion), drawing phase-specific boxes, labels, directional arrows, and an equilibrium midline for each completed pattern. A real-time info table tracks the current state of each model.
Key Concepts
- Market Maker Model (MMM) — ICT's framework for how market makers (institutions) engineer price delivery through a three-phase cycle. The model describes how institutional participants build positions quietly, create a false move to generate liquidity, and then drive price in their intended direction. This cycle is analogous to ICT's Power of Three (PO3) / AMD framework.
- Accumulation Phase — A period of consolidation where institutions build positions within a tight price range. Price moves sideways as smart money accumulates orders without alerting retail participants. This indicator detects accumulation as a price range that stays within a configurable ATR-based threshold over a minimum number of bars.
- Manipulation Phase (The Raid) — A deliberate stop hunt where price sweeps beyond the accumulation range to trigger retail stop-loss orders and generate liquidity for institutional positioning. In the Buy Model, this manifests as an SSL (Sell-Side Liquidity) sweep below the accumulation low. In the Sell Model, a BSL (Buy-Side Liquidity) sweep above the accumulation high. Detection requires the sweep to exceed a configurable ATR-based threshold beyond the range boundary.
- Distribution / Expansion Phase — The real institutional move following manipulation. Price expands aggressively in the intended direction, confirmed by a displacement candle — a large-bodied candle with a body-to-range ratio exceeding the configurable threshold and range exceeding 80% of ATR. For the Buy Model, a bullish displacement candle closing above the accumulation high confirms expansion. For the Sell Model, a bearish displacement candle closing below the accumulation low.
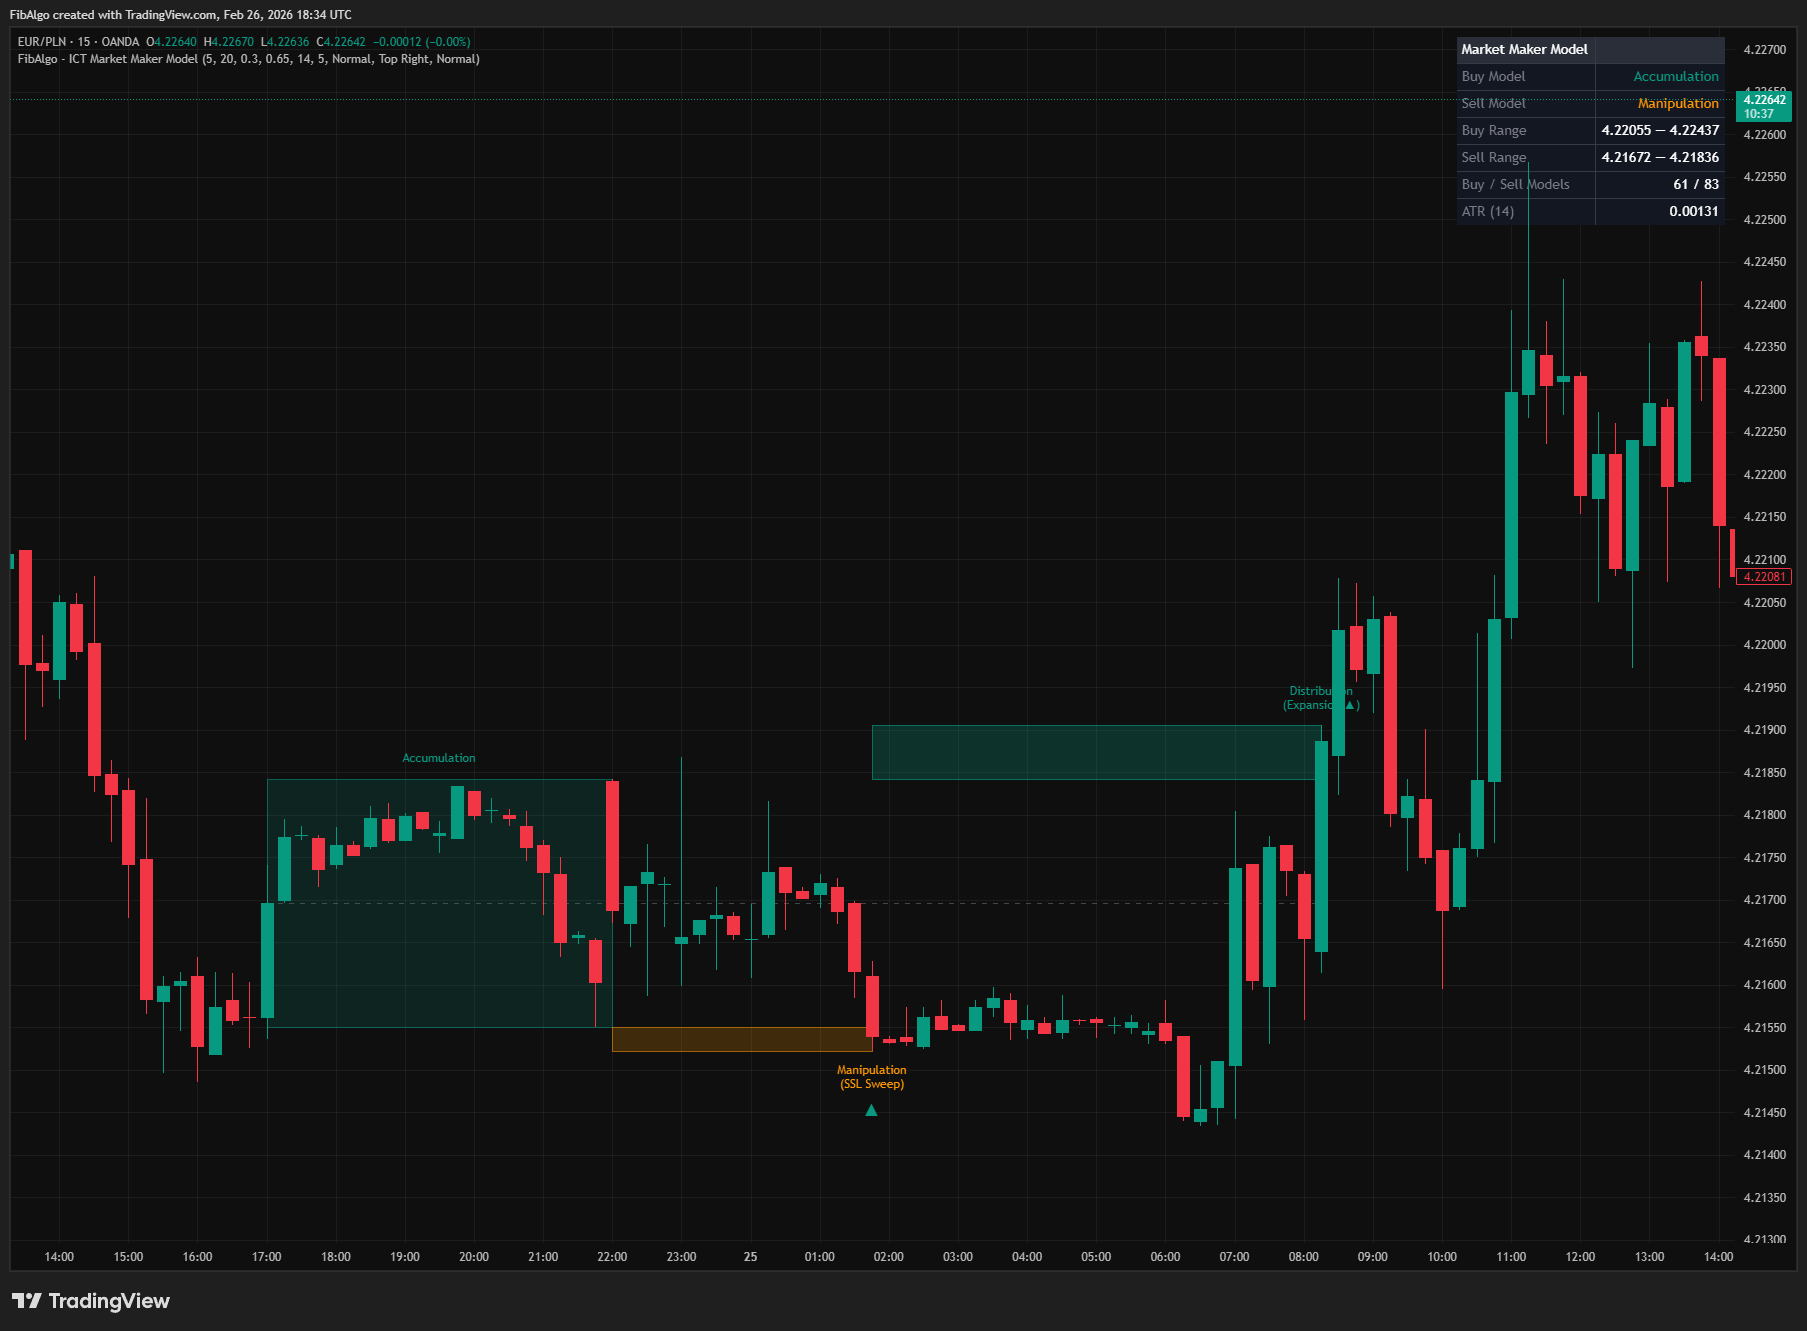
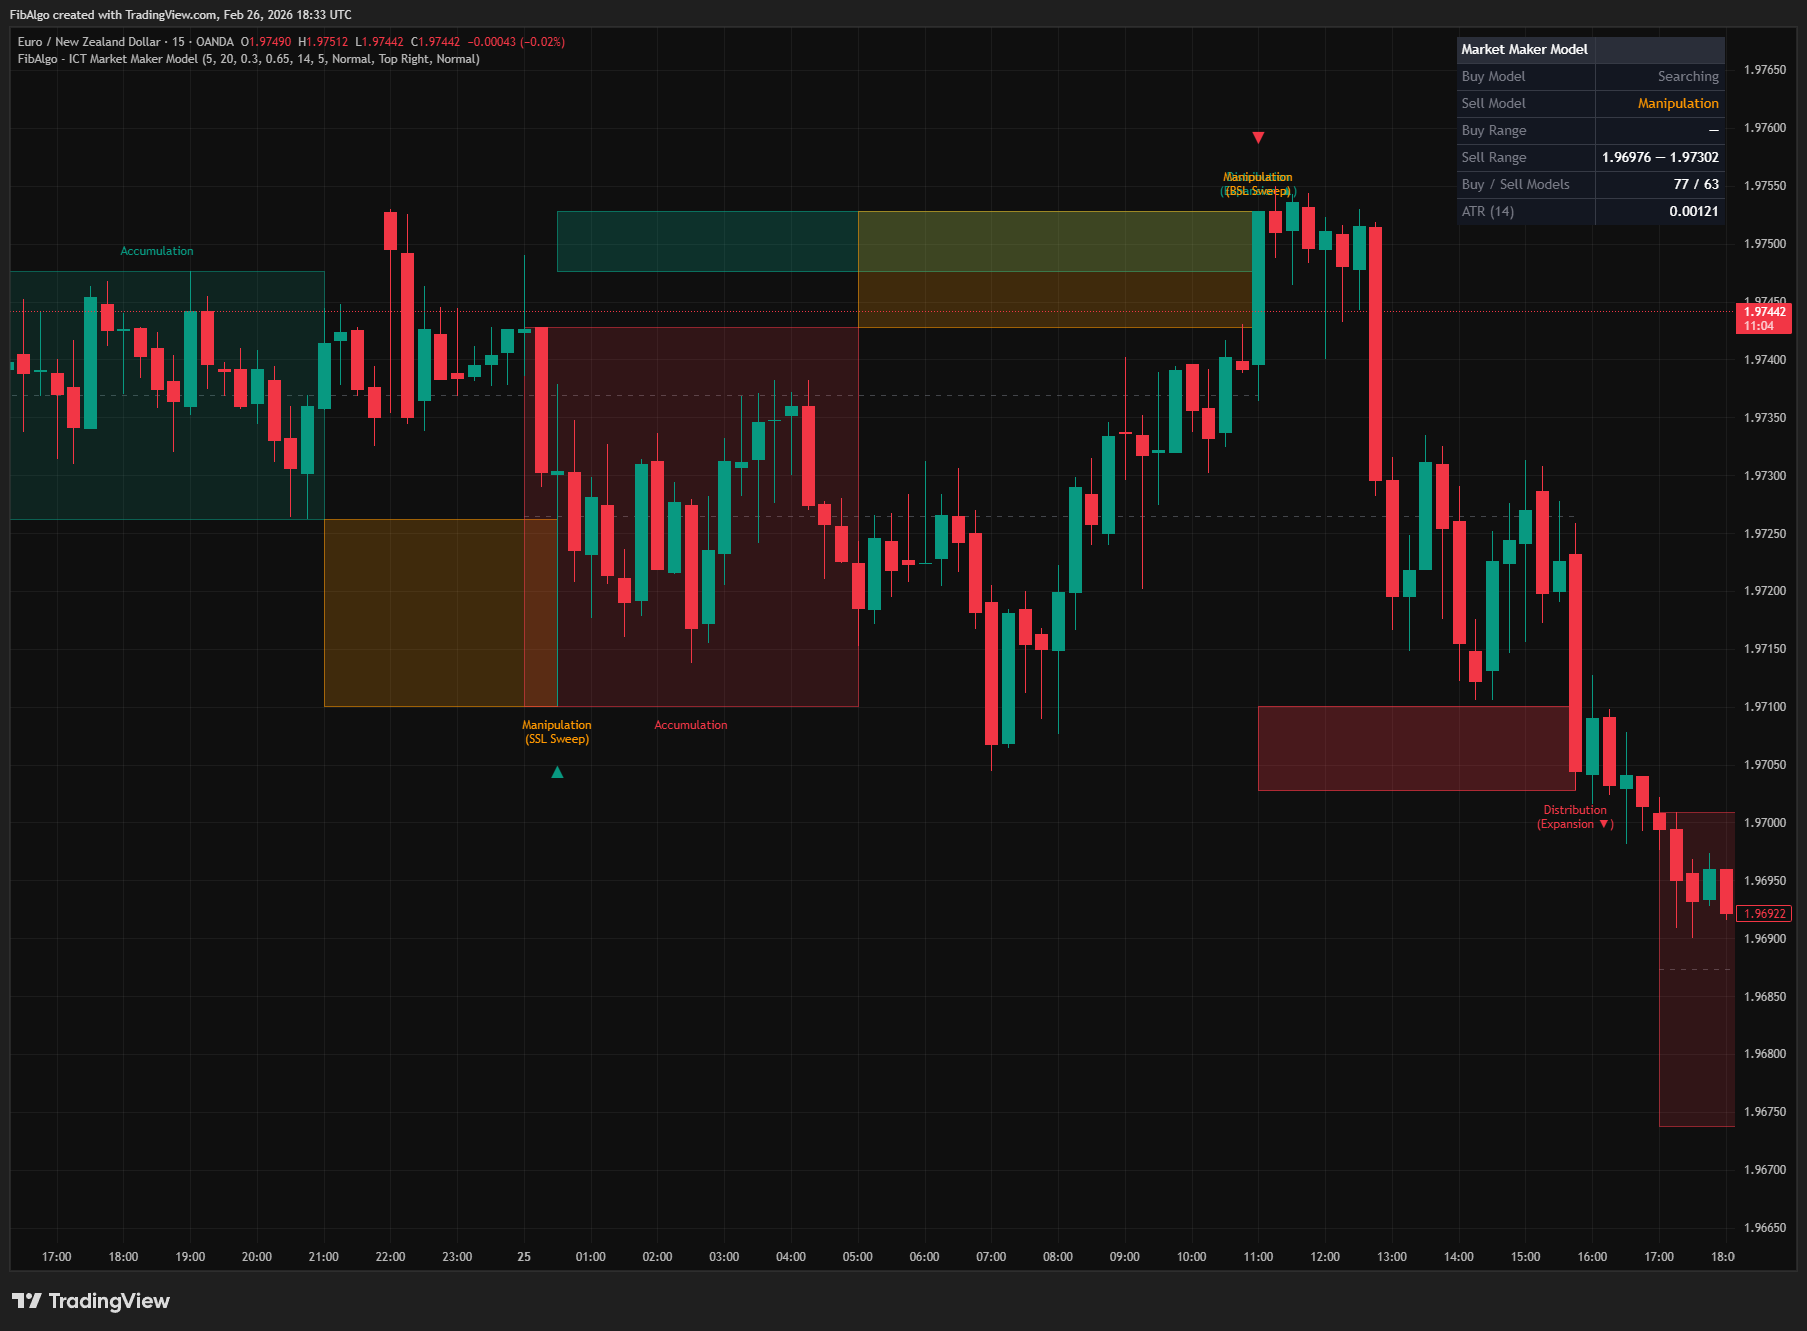
- Market Maker Buy Model — Consolidation → SSL sweep below the range → bullish expansion above the range. Smart money accumulates in the range, sweeps sell-side liquidity below to fill remaining orders, then drives price upward.
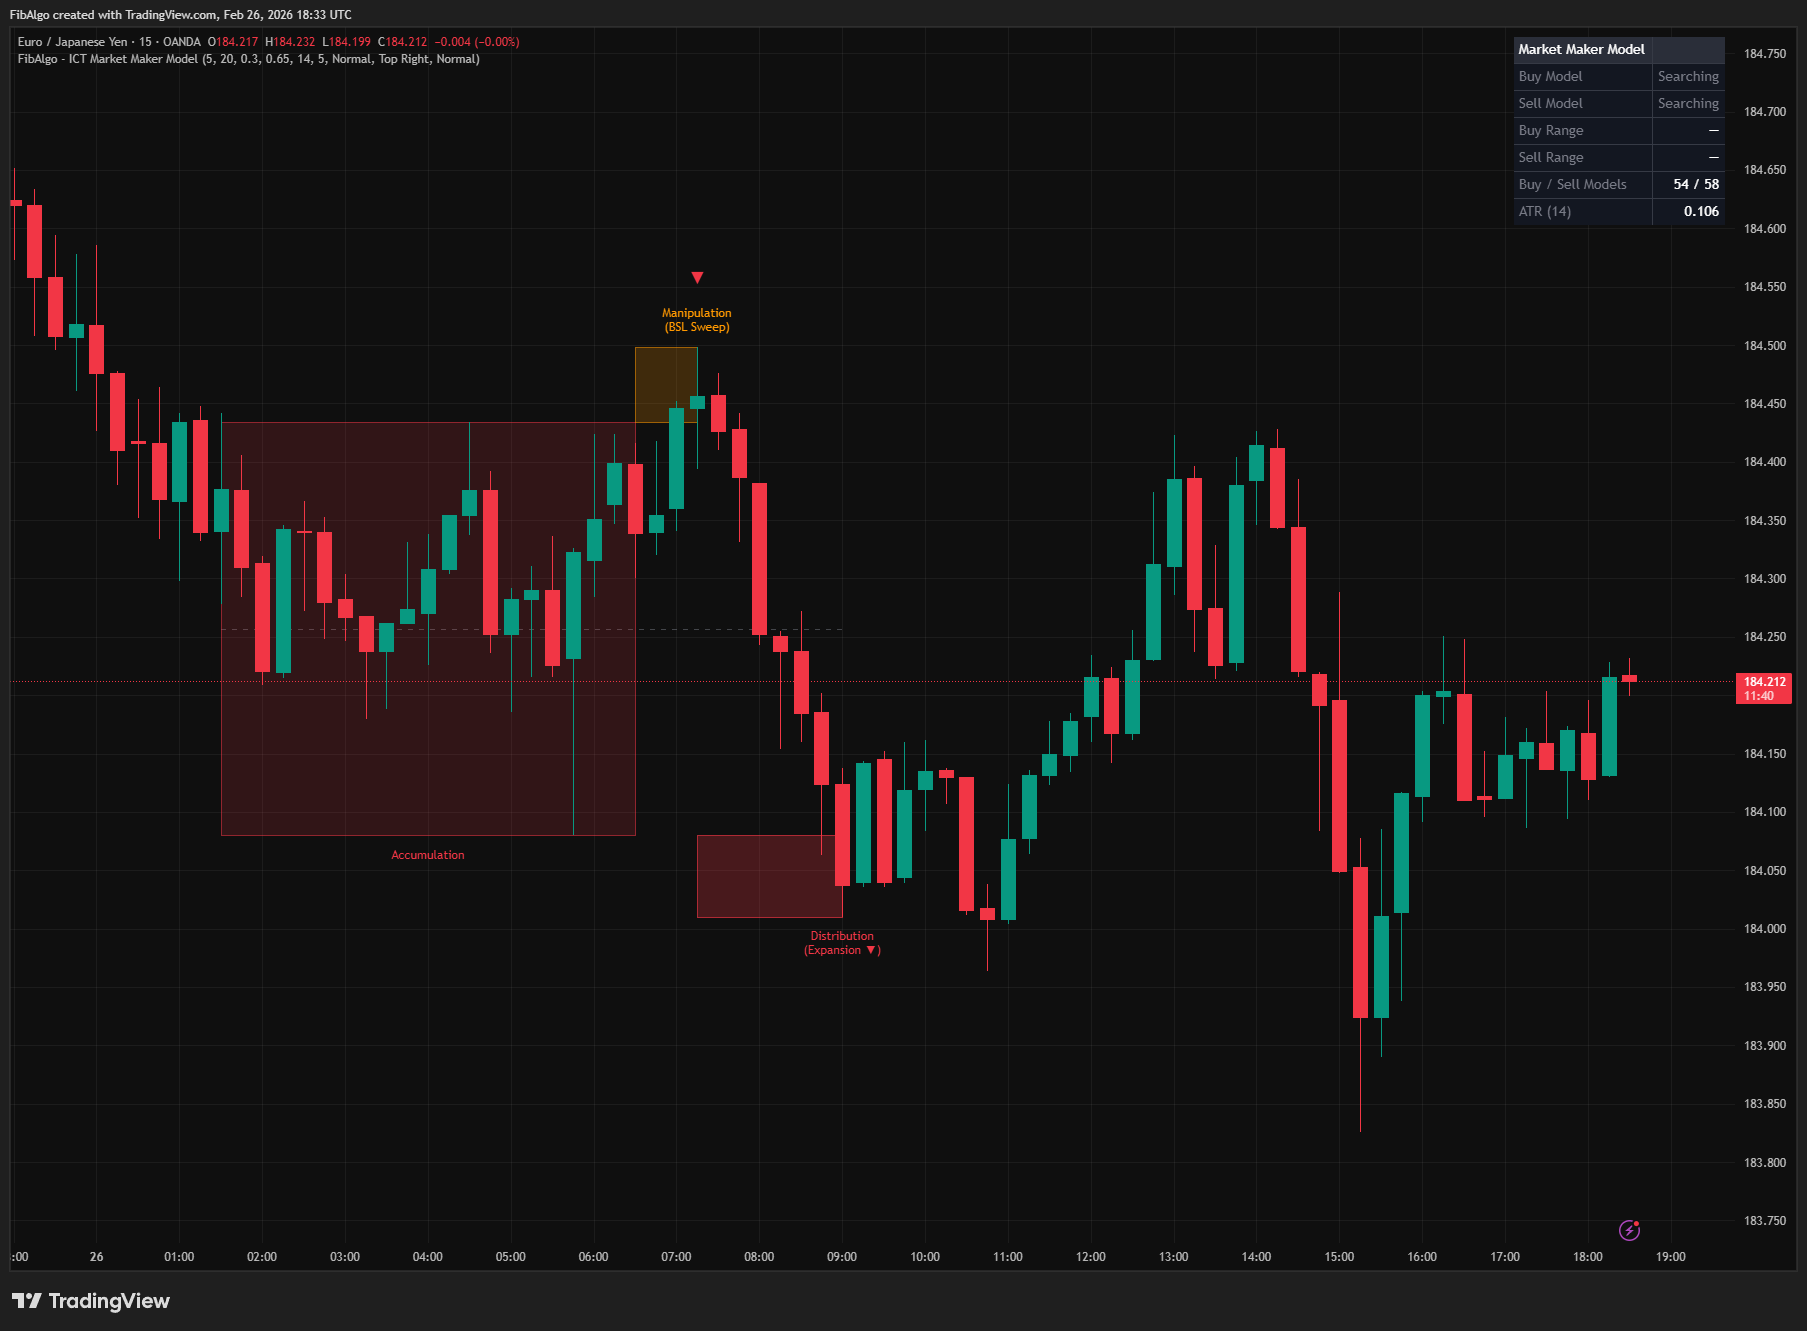
- Market Maker Sell Model — Consolidation → BSL sweep above the range → bearish expansion below the range. Smart money distributes in the range, sweeps buy-side liquidity above to fill remaining orders, then drives price downward.
- Equilibrium (50% Midline) — The midpoint of the accumulation range, representing the fair value of the consolidation zone. ICT teaches that price references equilibrium after displacement — the midline serves as a potential retracement target within a confirmed model.
How It Works
1. Accumulation Detection The indicator calculates a rolling price range using the highest high and lowest low over the configurable accumulation period (default 20 bars). A consolidation is confirmed when this range remains within 3.5× ATR — tight enough relative to current volatility to indicate institutional position building rather than trending activity. The ATR period is independently configurable (default 14). 2. Manipulation Detection (SSL/BSL Sweep) Once an accumulation range is established, the indicator monitors for a liquidity sweep:- Buy Model: Price must sweep below the accumulation low by at least the Manipulation Threshold (default 0.3× ATR). This SSL sweep confirms that sell-side liquidity has been taken.
- Sell Model: Price must sweep above the accumulation high by at least the same threshold. This BSL sweep confirms that buy-side liquidity has been taken.
- Buy Model: A bullish candle where body/range ≥ Displacement Body Ratio (default 0.65) AND range ≥ 0.8× ATR AND close is above the accumulation high.
- Sell Model: A bearish candle meeting the same body ratio and ATR requirements with close below the accumulation low.
A timeout mechanism prevents indefinite waiting: if no expansion occurs within 3× the accumulation period after manipulation, the model resets. This ensures stale manipulations do not produce delayed false signals.
4. Visual Output Each confirmed MMM pattern is drawn with:- Three phase boxes — Accumulation (full range period), Manipulation (sweep area), and Distribution (expansion area), each with distinct colors per model type.
- Phase labels — "Accumulation", "Manipulation (SSL/BSL Sweep)", "Distribution (Expansion ▲/▼)" at appropriate positions.
- Directional arrow — A large ▲ or ▼ at the manipulation point with a tooltip containing the full model summary: sweep price, expansion target, and institutional interpretation.
- Equilibrium midline — A dashed line at the 50% level of the accumulation range, extending from the range start to the distribution end.
- Buy Model status — Current state (Searching / Accumulation / Manipulation) with phase-specific coloring.
- Sell Model status — Same with corresponding colors.
- Active range levels — High and low of the current accumulation range for each model, shown when a range is established.
- Model count — Total Buy and Sell models detected over the chart's visible history.
- ATR reference — Current ATR value for context on threshold calculations.
Features
- Full MMM Cycle Detection — Three-phase state machine detecting Accumulation → Manipulation → Distribution with configurable parameters for each phase transition.
- Buy Model (Bullish MMM) — SSL sweep below accumulation range followed by bullish displacement expansion. Independently toggleable.
- Sell Model (Bearish MMM) — BSL sweep above accumulation range followed by bearish displacement expansion. Independently toggleable.
- ATR-Based Consolidation Detection — Accumulation range must be tight relative to ATR (≤ 3.5× ATR) to qualify as genuine institutional consolidation, filtering out wide-range trending conditions.
- Displacement Candle Validation — Expansion phase requires a displacement-grade candle: body/range ratio ≥ configurable threshold (default 0.65) and total range ≥ 0.8× ATR. Prevents weak candles from triggering false completions.
- Phase Boxes with Stage Coloring — Three visually distinct boxes per model with customizable colors: Buy (green shades + orange manipulation), Sell (red shades + orange manipulation). All six colors independently configurable.
- Phase Labels — Descriptive labels at each phase identifying Accumulation, Manipulation (SSL/BSL Sweep), and Distribution (Expansion ▲/▼).
- Directional Arrows — Large ▲/▼ arrows at the manipulation point with detailed tooltips summarizing the complete model: sweep price, expansion target, and institutional interpretation.
- Equilibrium Midline — Dashed line at the 50% level of the accumulation range, extending from range start to distribution end. Represents ICT's fair value / equilibrium concept within the model.
- Invalidation Logic — Models are automatically invalidated if price breaks 2× ATR in the wrong direction before manipulation, or if no expansion occurs within 3× accumulation period after manipulation. Prevents stale ranges from producing delayed false signals.
- Drawing Cleanup — Max Active Models setting (default 5) limits chart clutter. Oldest drawings are automatically removed when the limit is exceeded. Boxes, lines, and labels are tracked in separate arrays.
- Real-Time Info Table — Displays current Buy/Sell model state, active accumulation ranges, total model counts, and ATR reference. Position and text size configurable.
- 3 Alert Conditions — Accumulation Detected, Manipulation (Sweep) Detected, and Distribution (Expansion) Confirmed. Each alert includes price levels, model direction, and descriptive text. Master enable toggle with per-condition controls.
How to Use
- Full Cycle Analysis: Watch the info table for model state progression. When a model enters "Accumulation," prepare for a potential opportunity. "Manipulation" means the sweep has occurred — watch for the displacement candle. When the full model completes, the directional bias is confirmed by the expansion direction.
- Sweep Confirmation: The manipulation phase is the key entry signal in ICT methodology. When the Buy Model shows "Manipulation" (SSL sweep detected), look for bullish setups on the lower timeframe. When the Sell Model shows BSL sweep, look for bearish setups.
- Equilibrium Retracement: After a completed model, price may retrace to the midline (50% of accumulation range). This is a potential re-entry zone — the equilibrium represents fair value within the model's context.
- Multi-Timeframe: Apply on higher timeframes (1H, 4H, Daily) for directional bias. Use lower timeframes (5M, 15M) for entry refinement within the higher-timeframe model's direction.
- Combine with ICT Tools: MMM provides the macro framework. Combine with Order Blocks for entry zones within the manipulation sweep, Fair Value Gaps for precise entries during expansion, Killzones for session timing, and Liquidity Levels for sweep targets. The MMM tells you WHAT is happening; other tools tell you WHERE to act.
- Parameter Tuning: Increase Min Accumulation Bars for fewer, more significant models. Decrease Manipulation Threshold for tighter sweep requirements. Increase Displacement Body Ratio for stricter expansion confirmation.
Limitations
- Accumulation detection uses a rolling range over the configured period. Very volatile markets with naturally wide ranges may produce fewer accumulation detections. Increase the Min Accumulation Bars parameter or the ATR multiplier threshold to accommodate higher volatility.
- The state machine processes one model at a time per direction (Buy and Sell are independent). If one model is invalidated, the next accumulation detection begins fresh — overlapping models are not tracked simultaneously within the same direction.
- Manipulation detection requires price to exceed the accumulation boundary by the ATR-based threshold. Very shallow sweeps that barely touch the boundary will not be detected. Decrease the Manipulation Threshold for more sensitive sweep detection.
- Distribution confirmation requires a displacement-grade candle — a gradual trend reversal without a single strong candle will not trigger completion. This is intentional: ICT methodology emphasizes displacement as the hallmark of institutional order flow.
- The timeout mechanism (3× accumulation period) prevents stale manipulations from waiting indefinitely. In slow-moving markets, this may cause valid models to expire before expansion occurs. Increase Min Accumulation Bars to extend the timeout proportionally.
- Drawing objects are limited to 500 each (boxes, lines, labels) by TradingView. The Max Active Models setting manages this, but enabling both Buy and Sell models with high limits may approach TradingView's caps. Default of 5 models is conservative.
- This indicator identifies institutional price cycles — it does not generate buy/sell signals. Use it as a structural framework alongside Order Blocks, Fair Value Gaps, Liquidity Levels, Killzones, and Market Structure for complete trade setups.
Tags
#Smart Money#Market Structure#Signals