Overview
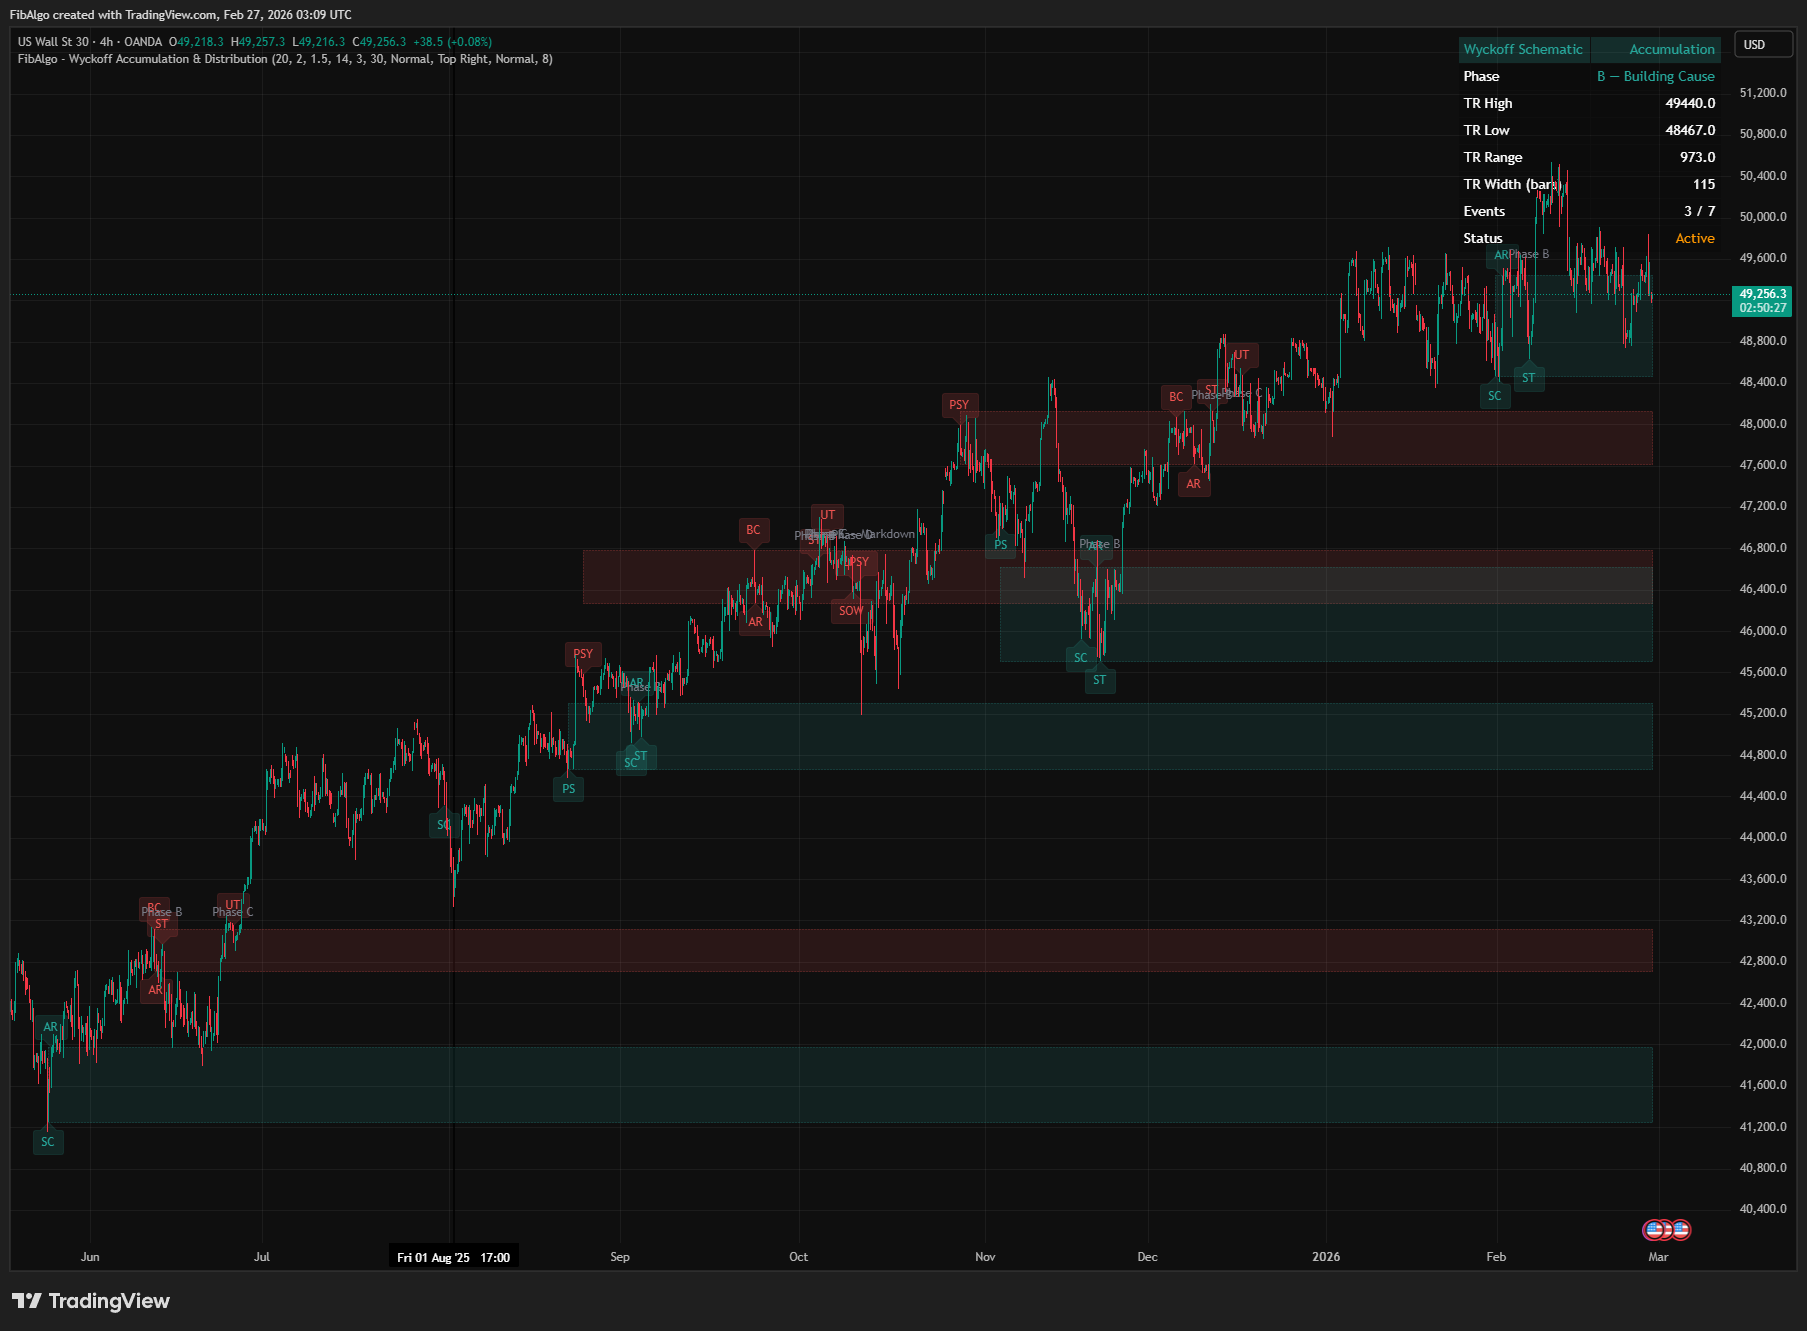
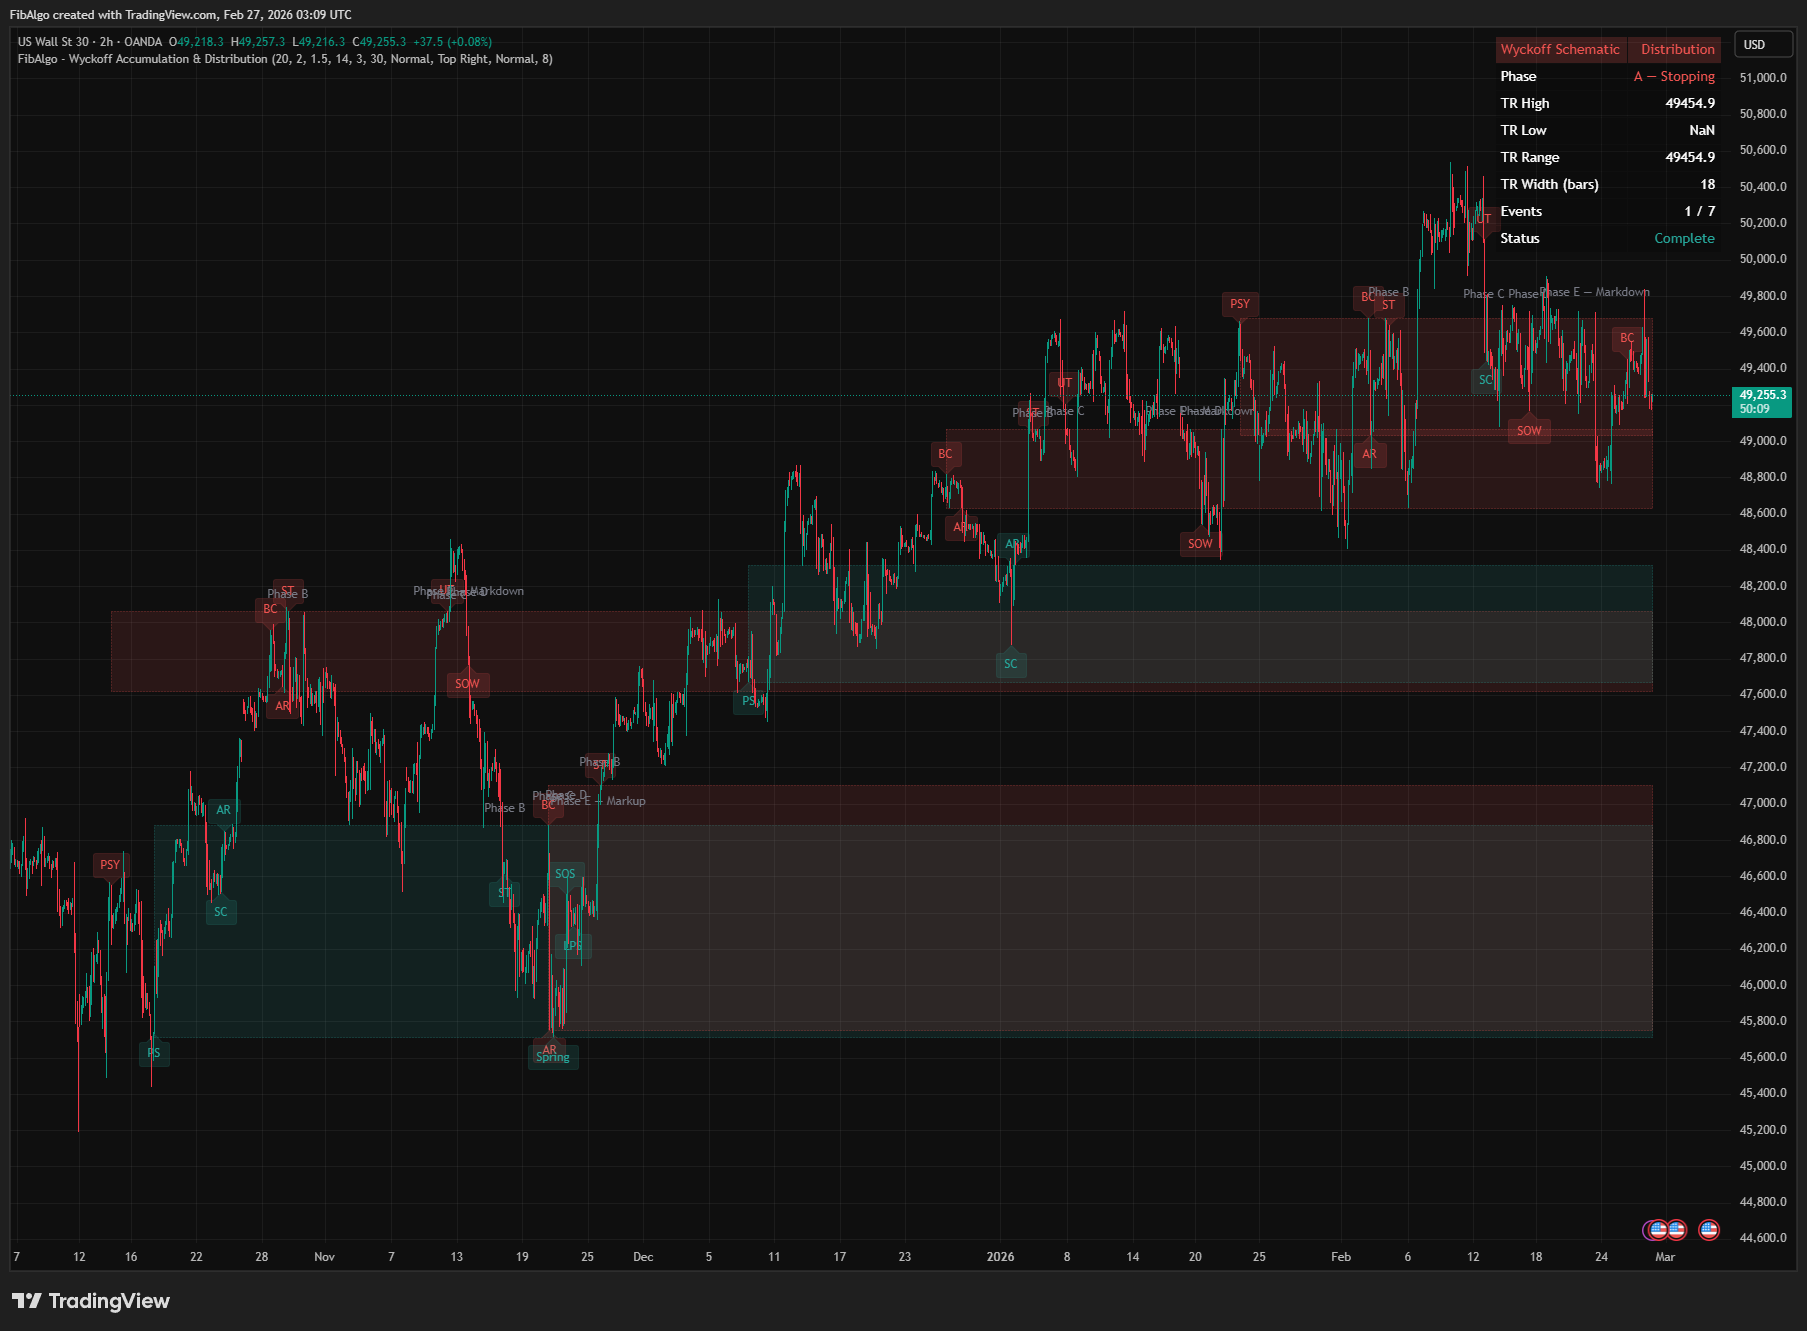
This indicator automatically detects and labels Wyckoff Accumulation and Distribution schematics in real-time. It identifies the key events defined by Richard D. Wyckoff's methodology — including Selling Climax (SC), Buying Climax (BC), Automatic Rally/Reaction (AR), Secondary Tests (ST), Springs, Upthrusts, Signs of Strength (SOS), Signs of Weakness (SOW), and more — then assigns the correct phase (A through E) as the schematic unfolds. A color-coded trading range box and info table provide instant visual context.
Key Concepts
- Wyckoff Accumulation — A sideways trading range at the bottom where institutional interests absorb supply. The Composite Man quietly accumulates inventory before a markup phase begins.
- Wyckoff Distribution — A sideways trading range at the top where institutional interests offload positions. The Composite Man distributes holdings before a markdown phase begins.
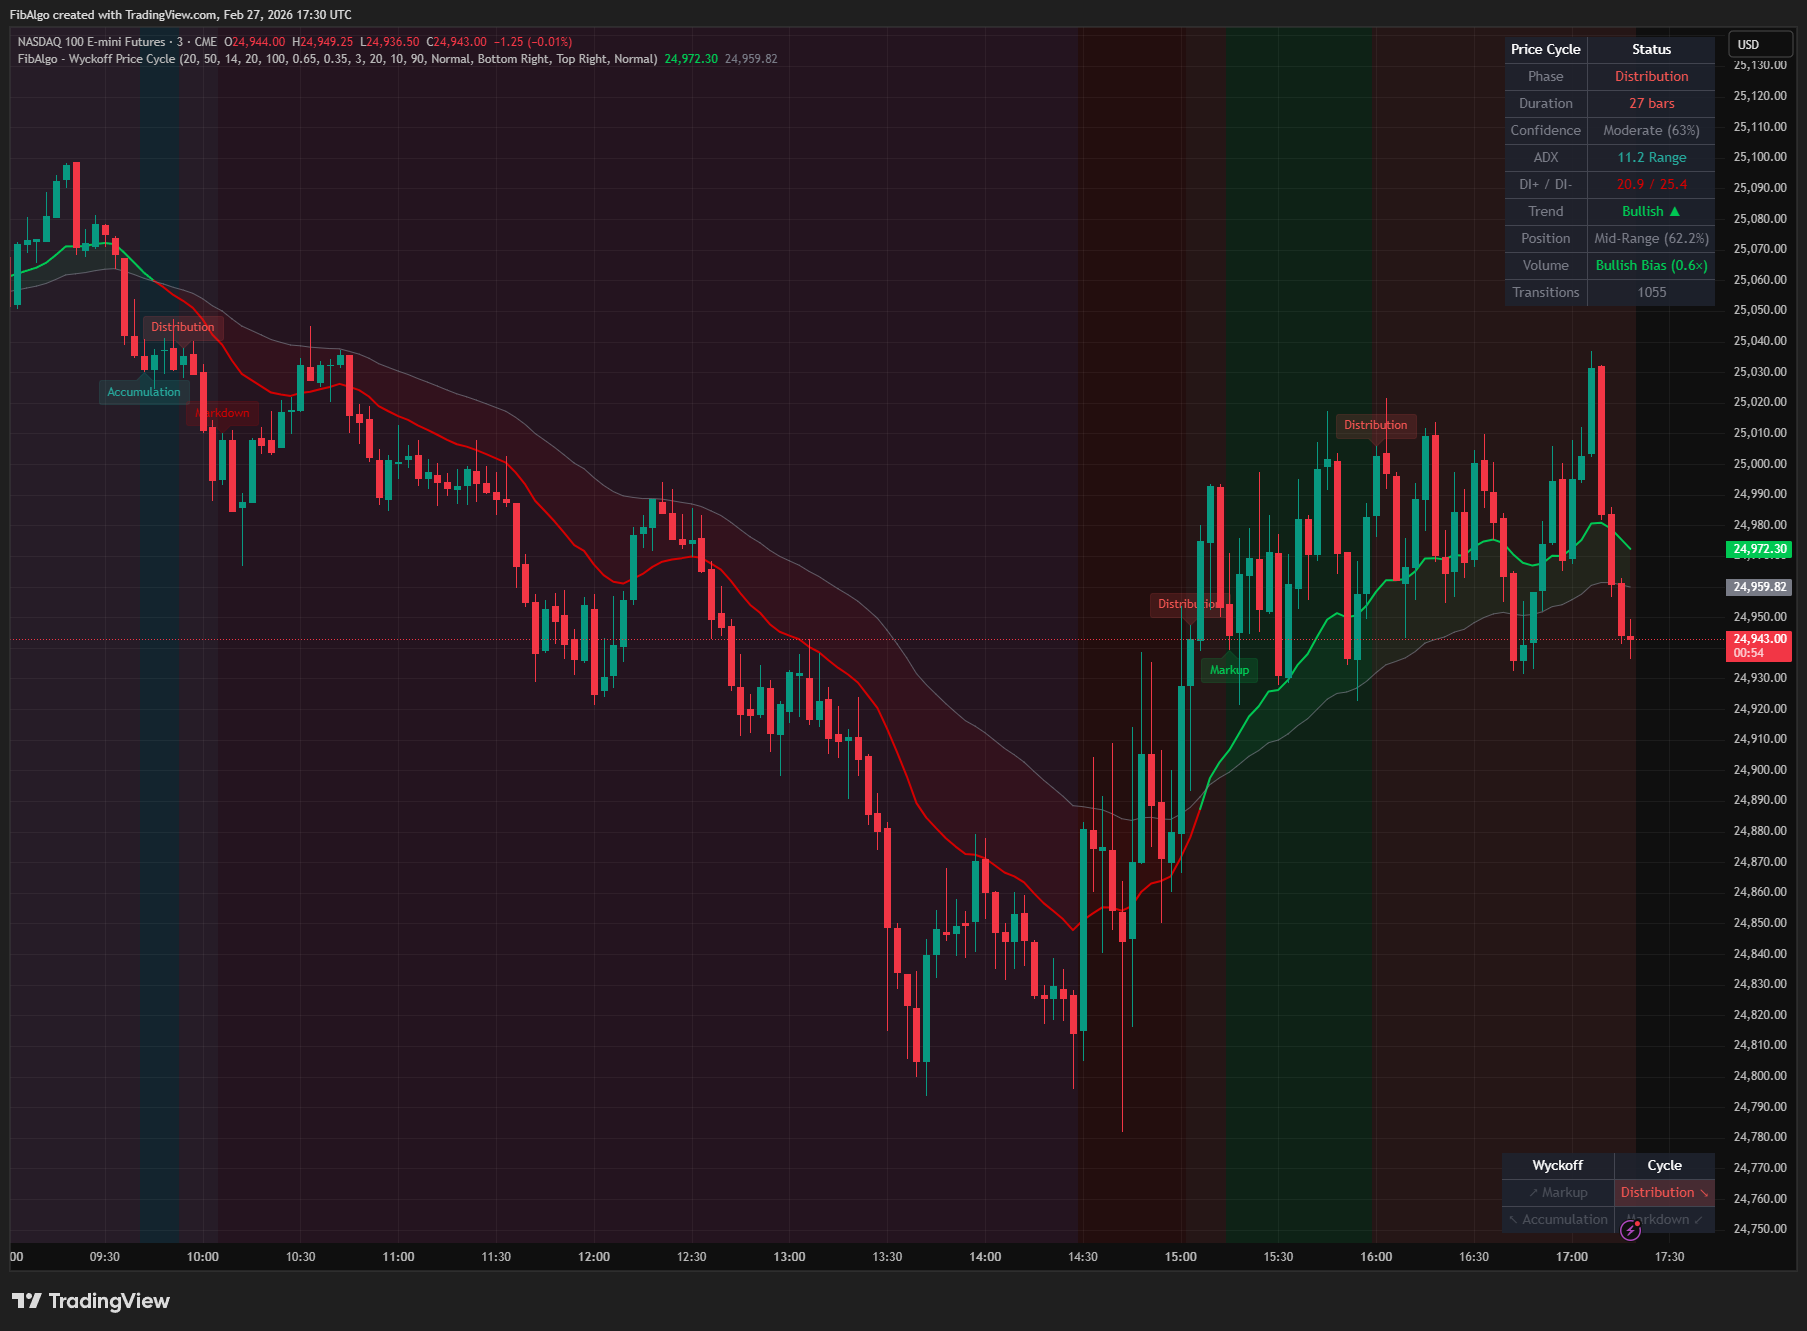
- Five Phases (A–E) — Each schematic progresses through five phases: A (stopping the trend), B (building cause), C (testing supply/demand via spring or upthrust), D (demand/supply dominance), and E (trend begins).
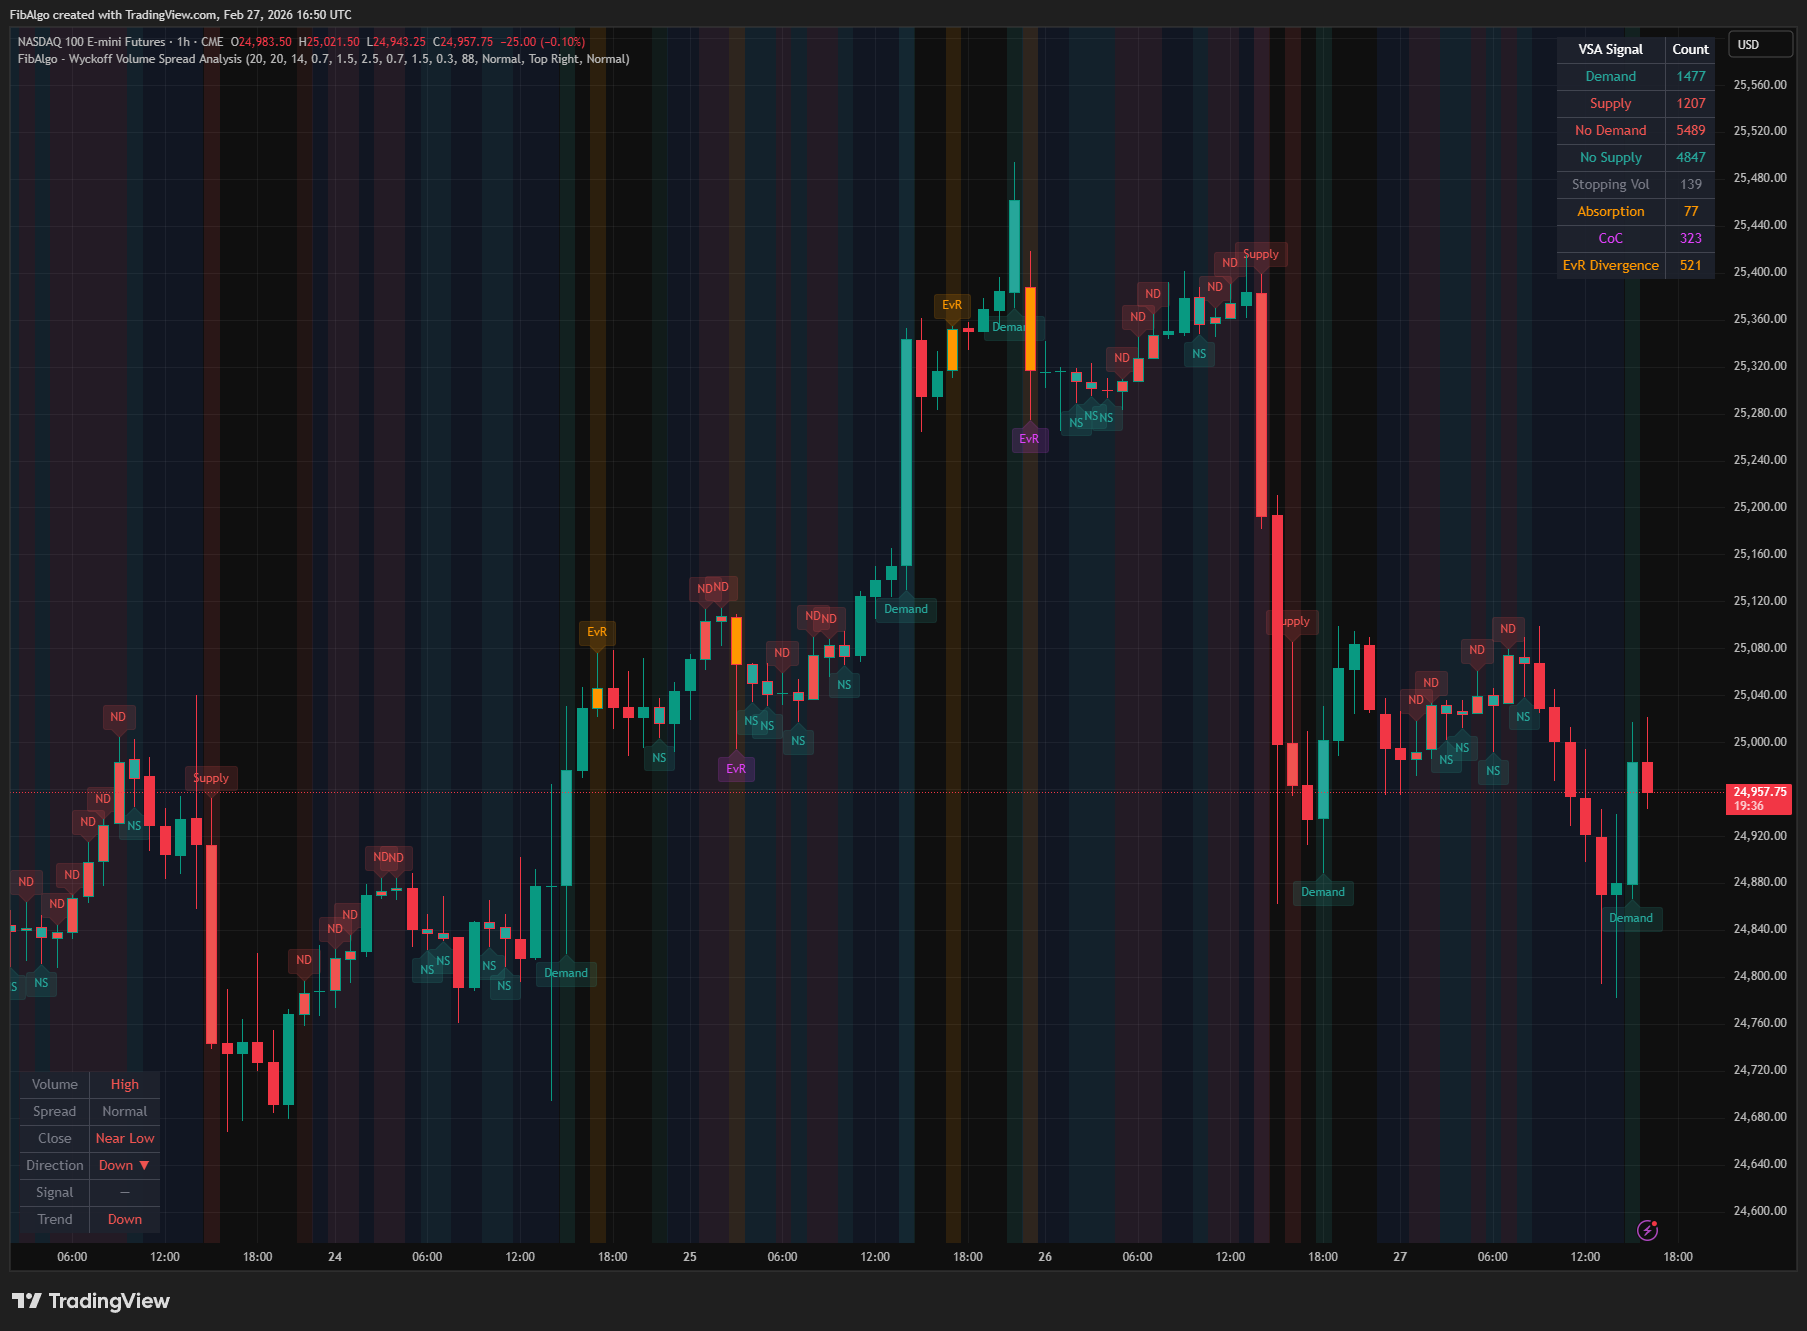
- Volume Confirmation — Every event is validated using volume analysis. Climaxes require extreme volume, secondary tests require diminishing volume, and signs of strength/weakness require expanding volume.
How It Works
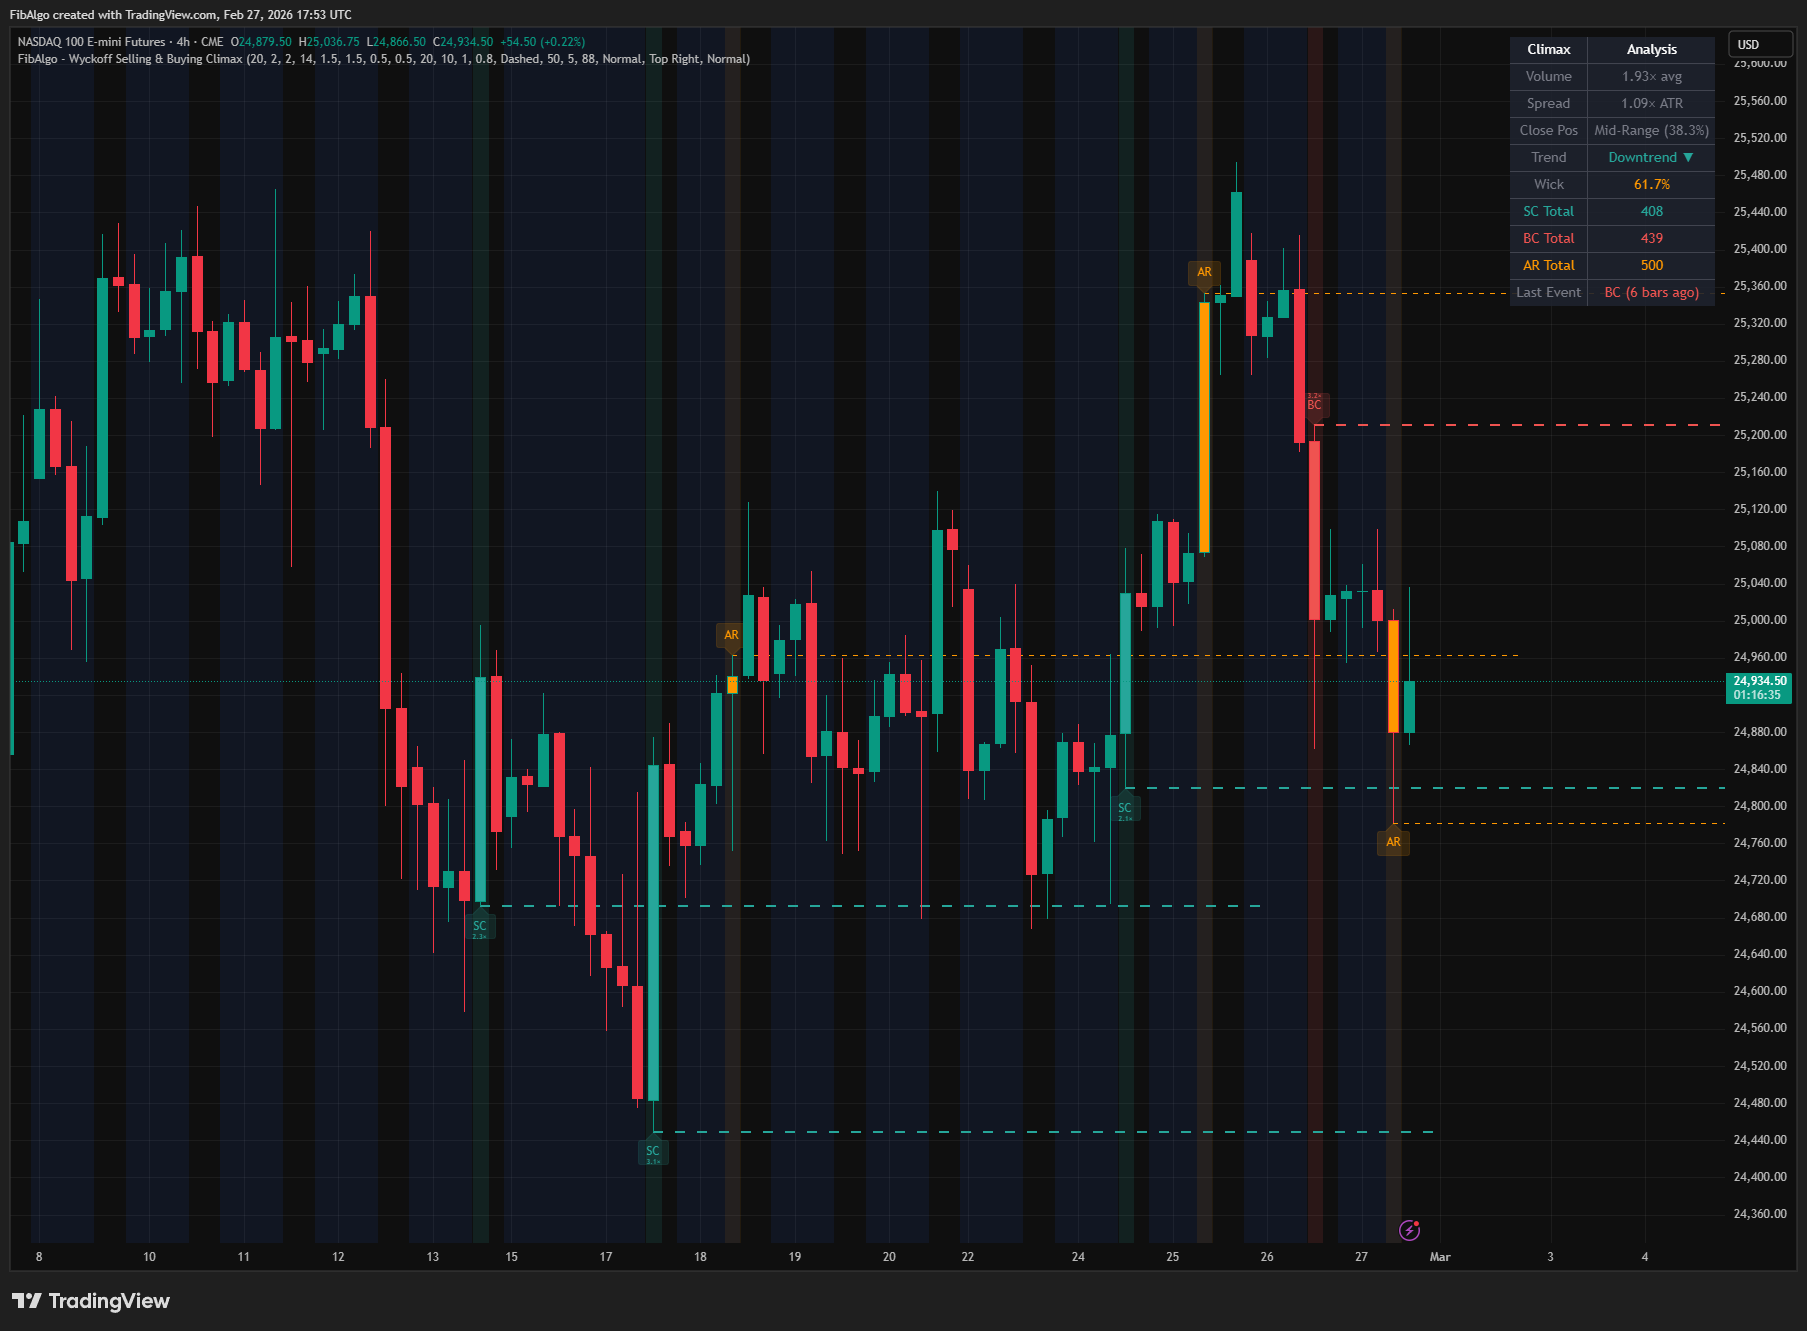
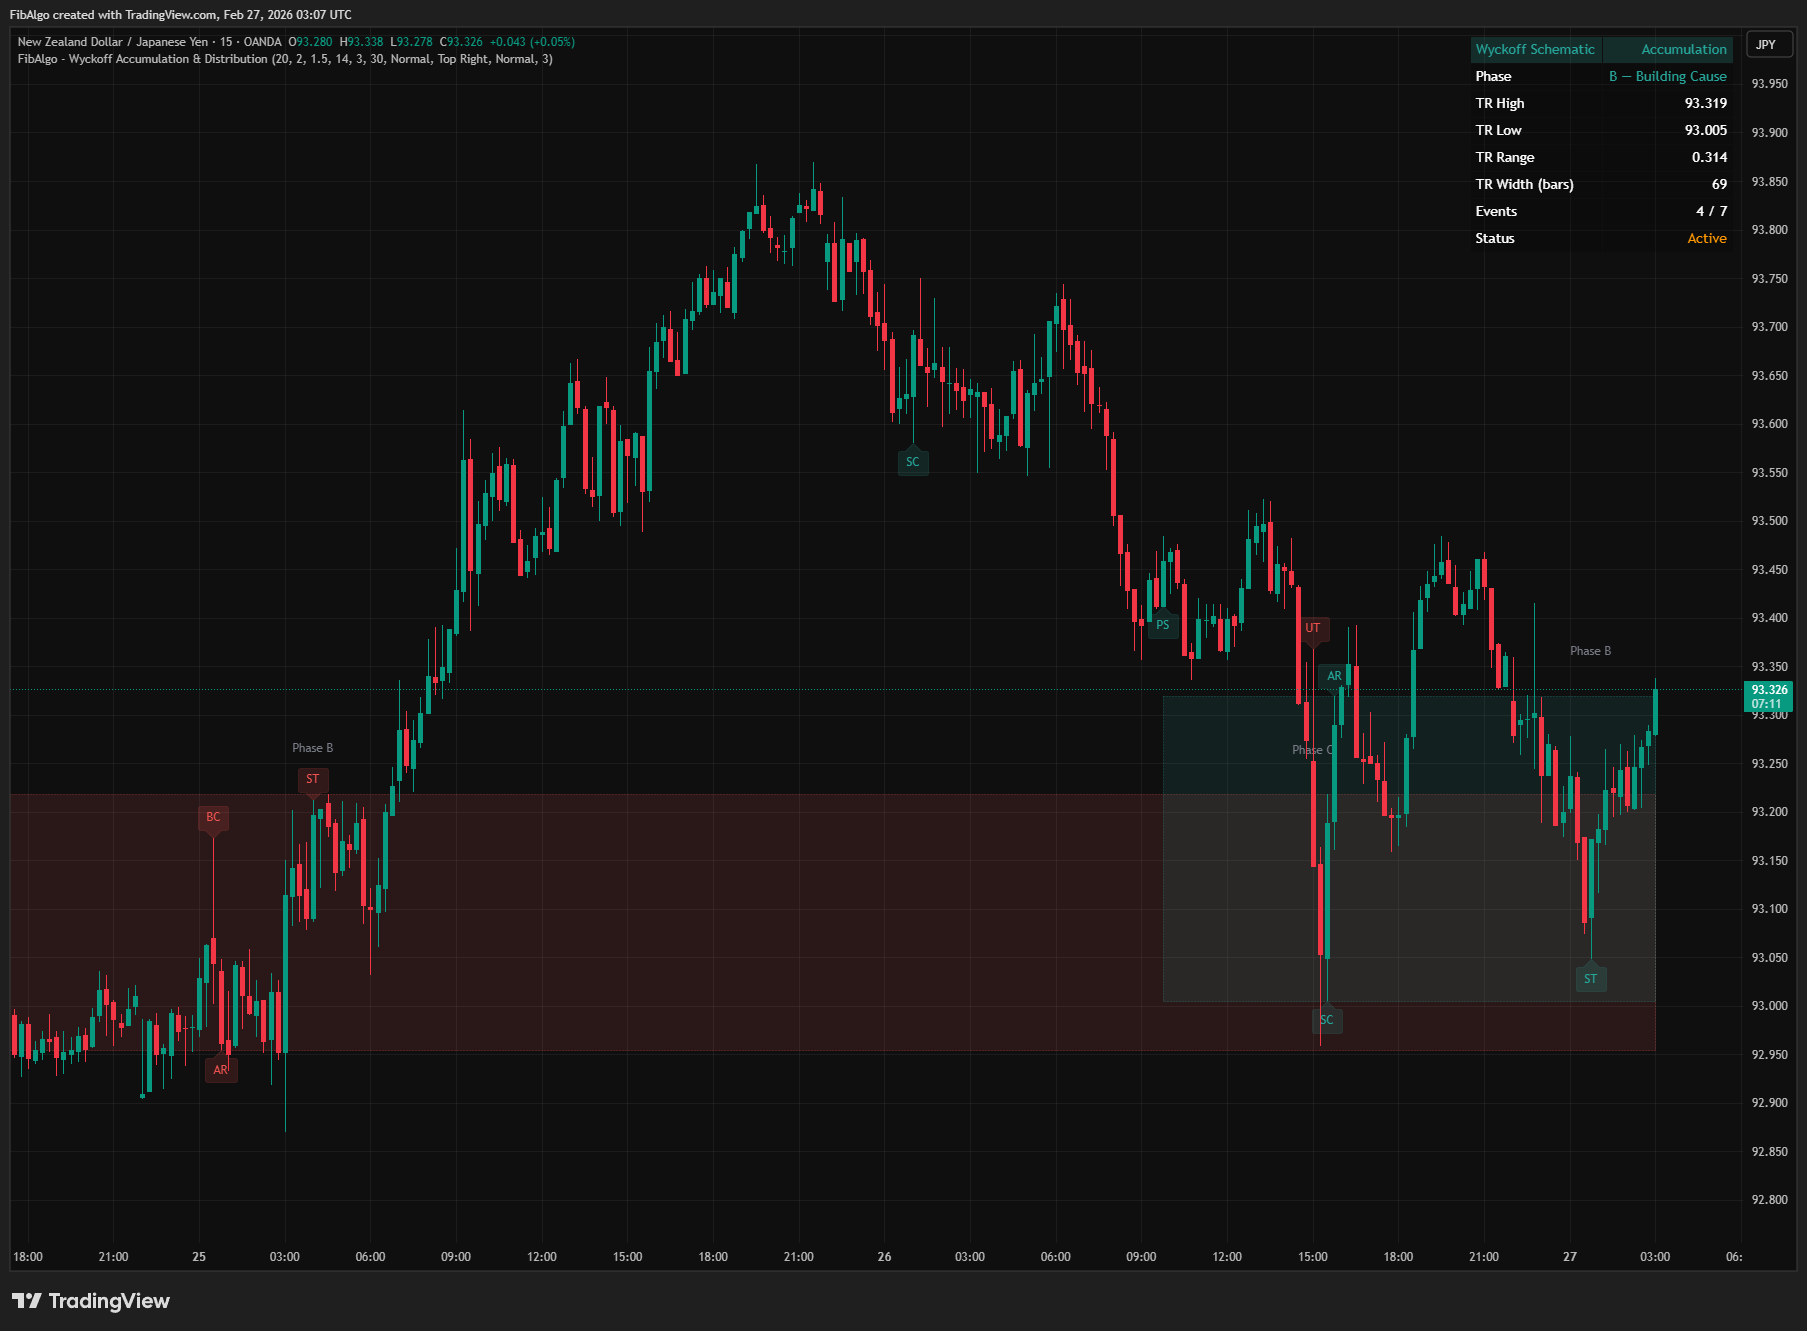
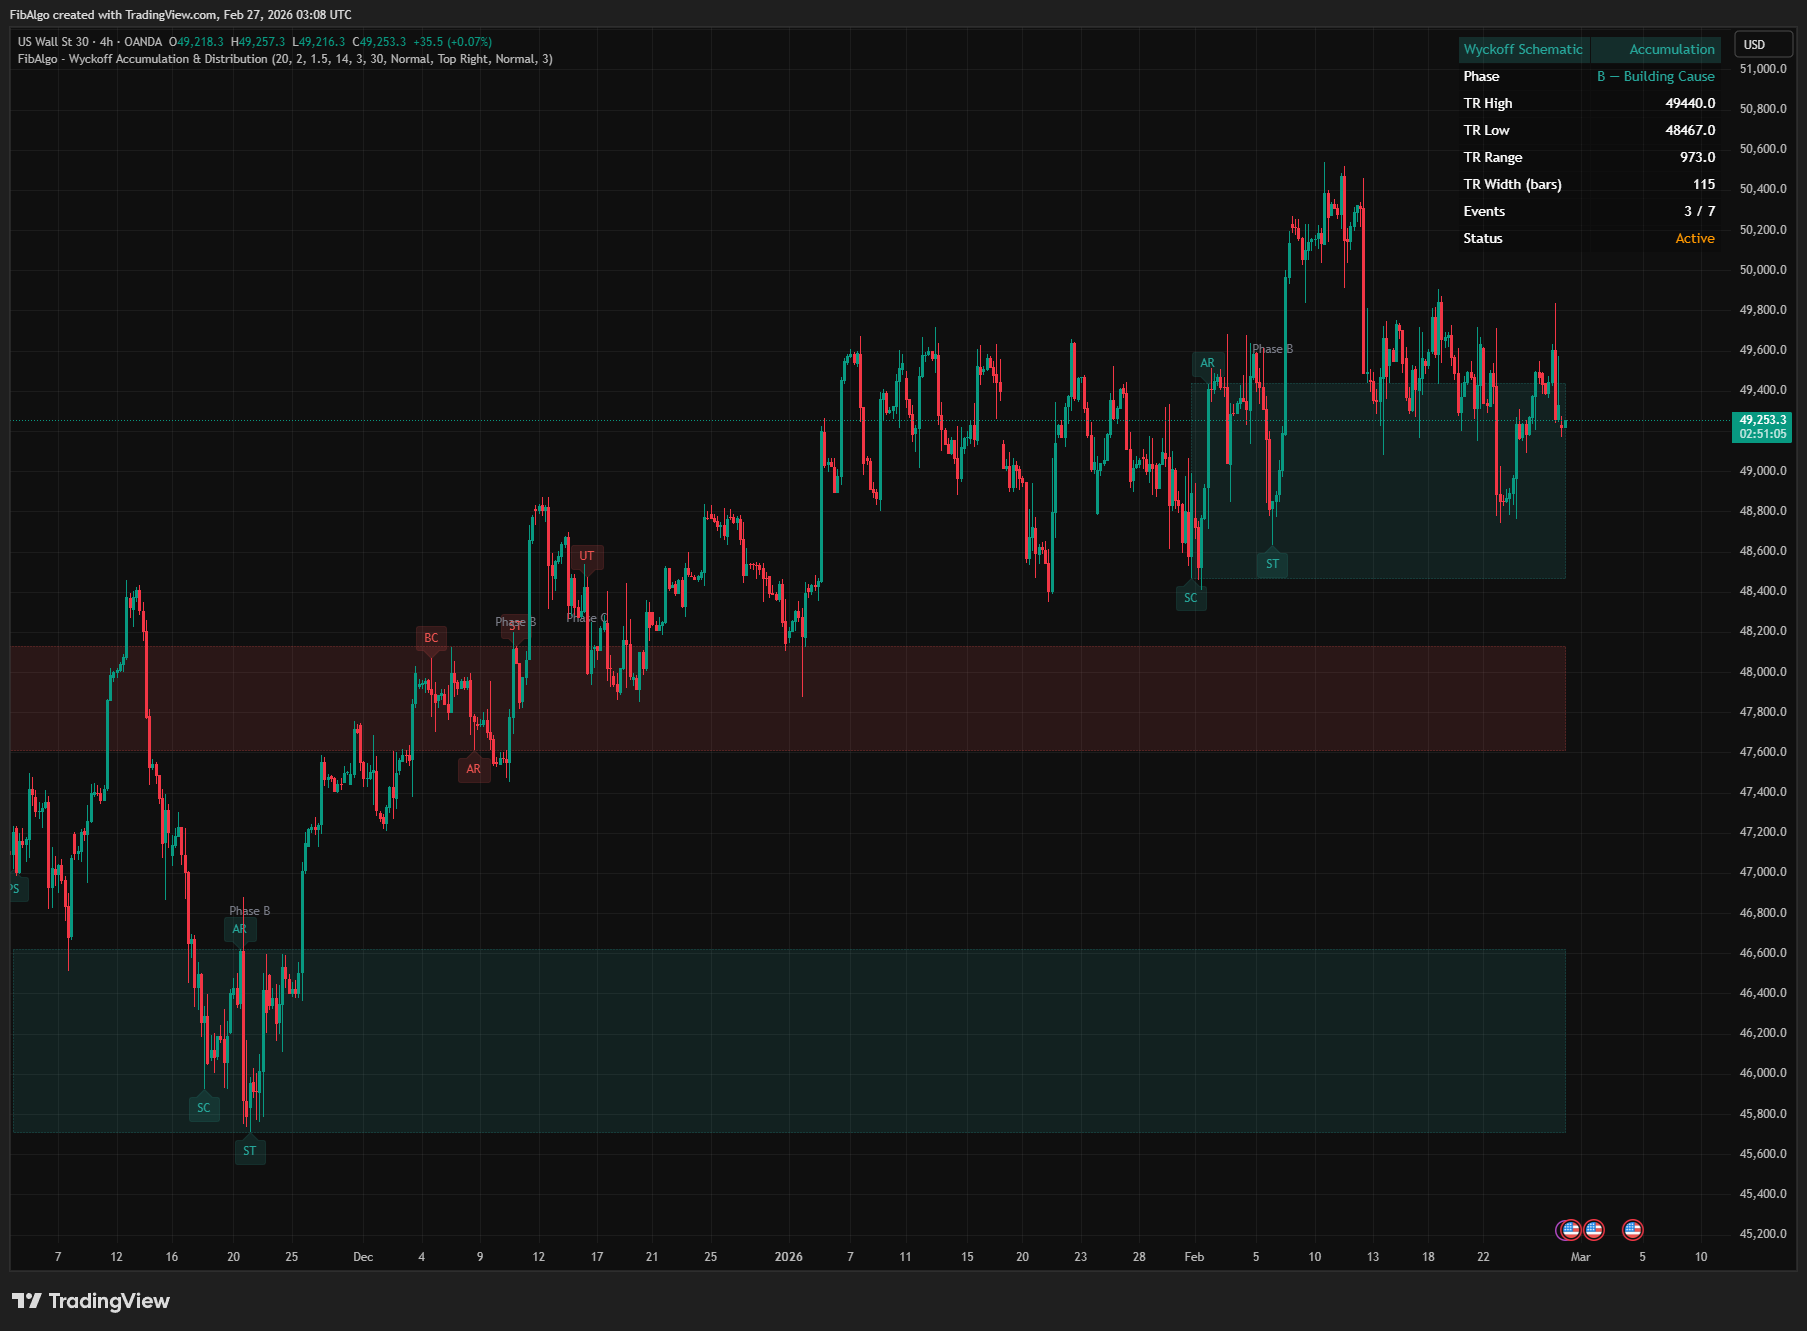
1. Trend Assessment The indicator evaluates the prior trend using a dual SMA crossover method (half-period vs full-period moving averages). A confirmed downtrend triggers accumulation detection; a confirmed uptrend triggers distribution detection. This approach identifies genuine directional momentum rather than simple price positioning. 2. Accumulation Schematic Detection Events are detected sequentially as the schematic unfolds:- Phase A — Stopping the Downtrend: Preliminary Support (PS) shows first buying interest — bullish bar closing near its high (above the 60% level) on above-average volume. Selling Climax (SC) marks maximum panic selling absorbed by institutions — extreme volume, wide spread, and close in the upper half of the bar (absorption signature). Automatic Rally (AR) follows swiftly as selling pressure exhausts. Secondary Test (ST) revisits the SC zone on both diminished volume AND narrower spread than the SC bar. If no AR is detected within a reasonable window, the schematic is automatically invalidated.
- Phase B — Building the Cause: Price oscillates within the trading range. The indicator expands visual TR boundaries with a configurable tolerance while preserving the original SC/ST reference levels for Phase C detection.
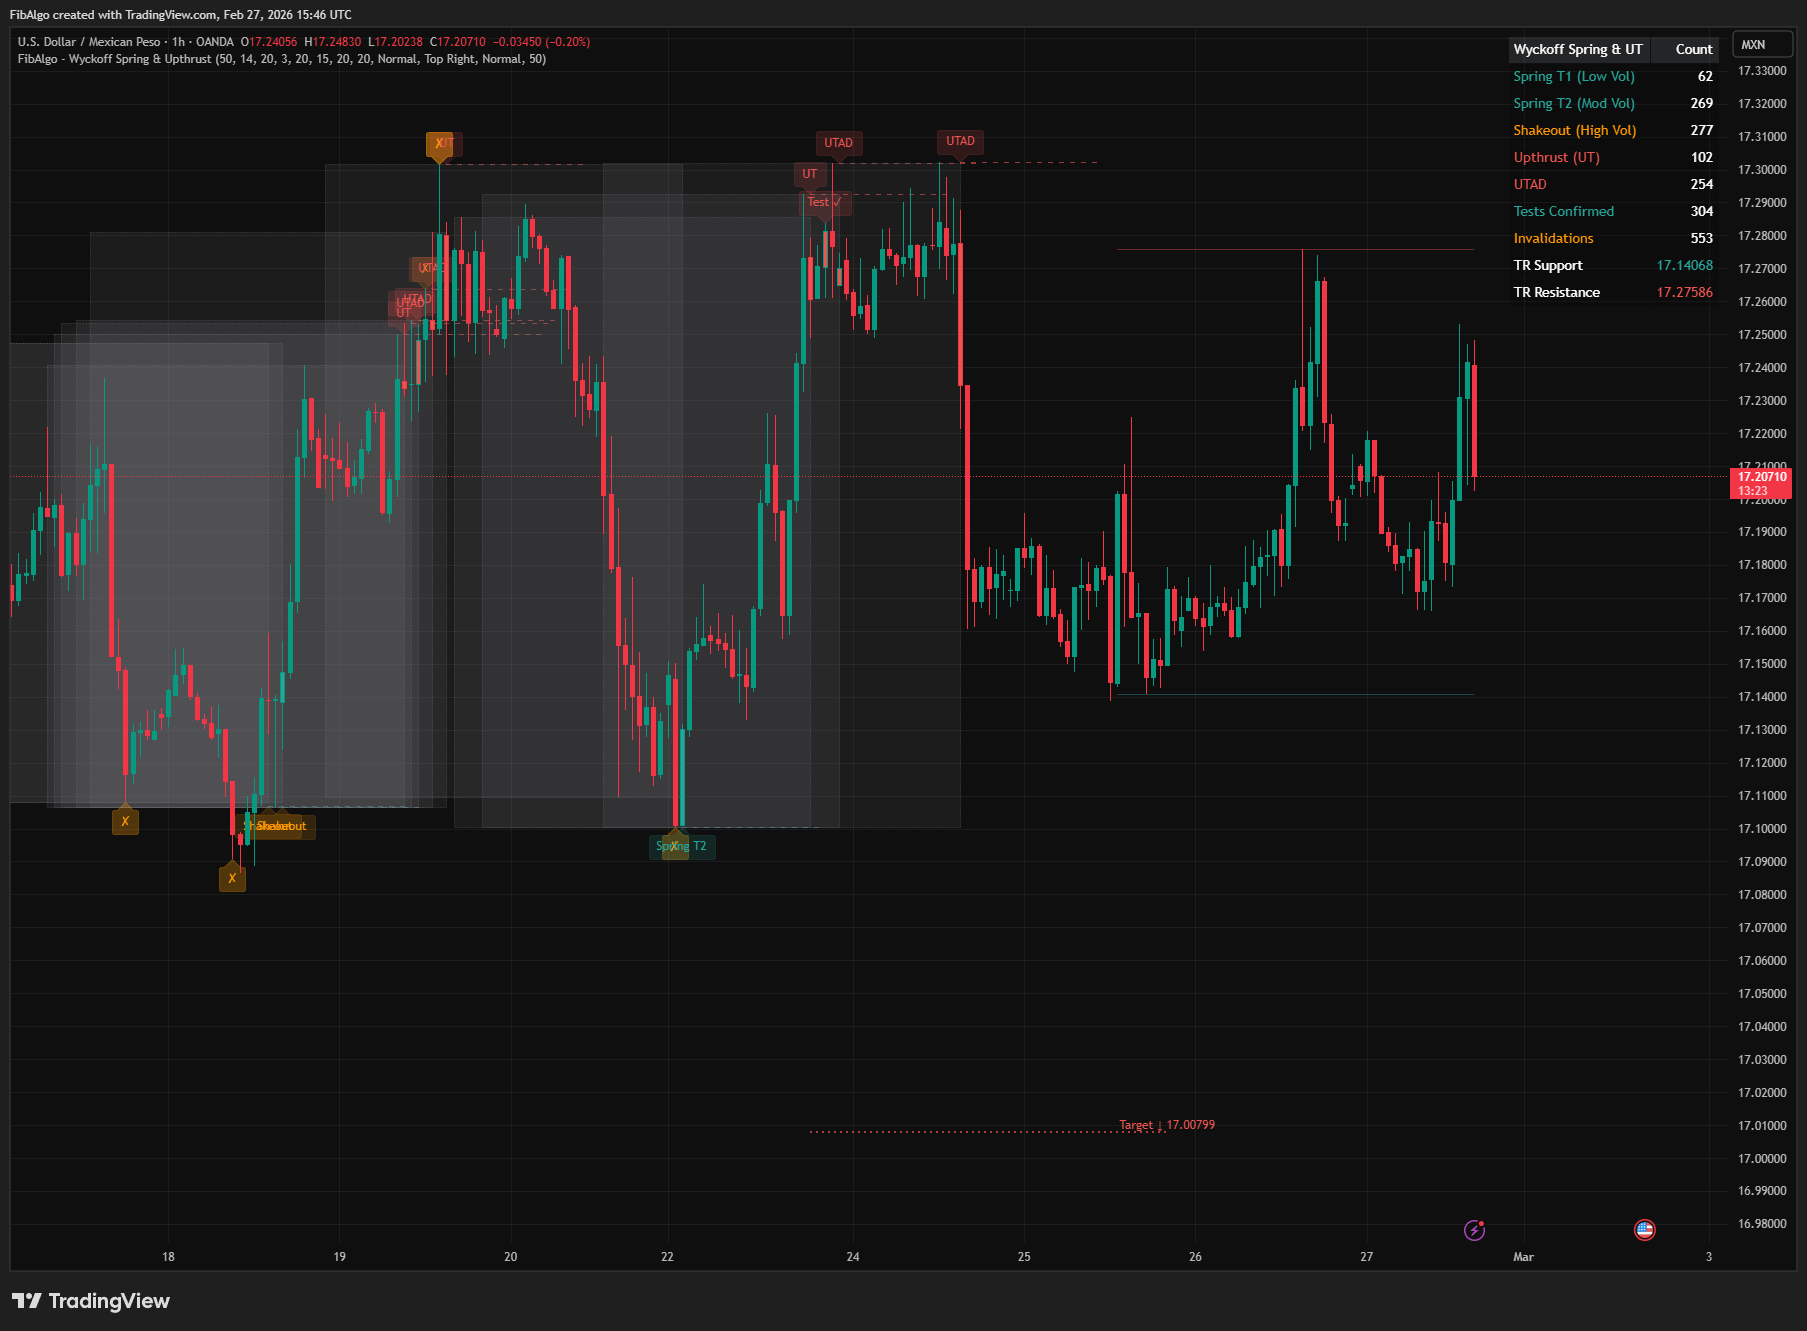
- Phase C — Spring: Price breaks below the original reference support level (SC/ST low, unaffected by Phase B tolerance) but closes back inside — a bear trap. This is the highest-probability entry signal in the Wyckoff method.
- Phase D — Demand Dominates: Sign of Strength (SOS) is a wide-spread bullish bar closing near its high on above-average volume, moving above the mid-TR. Last Point of Support (LPS) is a pullback on diminished volume or narrow spread that holds above the midpoint.
- Phase E — Markup: Price closes above the reference resistance level (AR high) on above-average volume with a bullish bar, confirming the accumulation is complete.
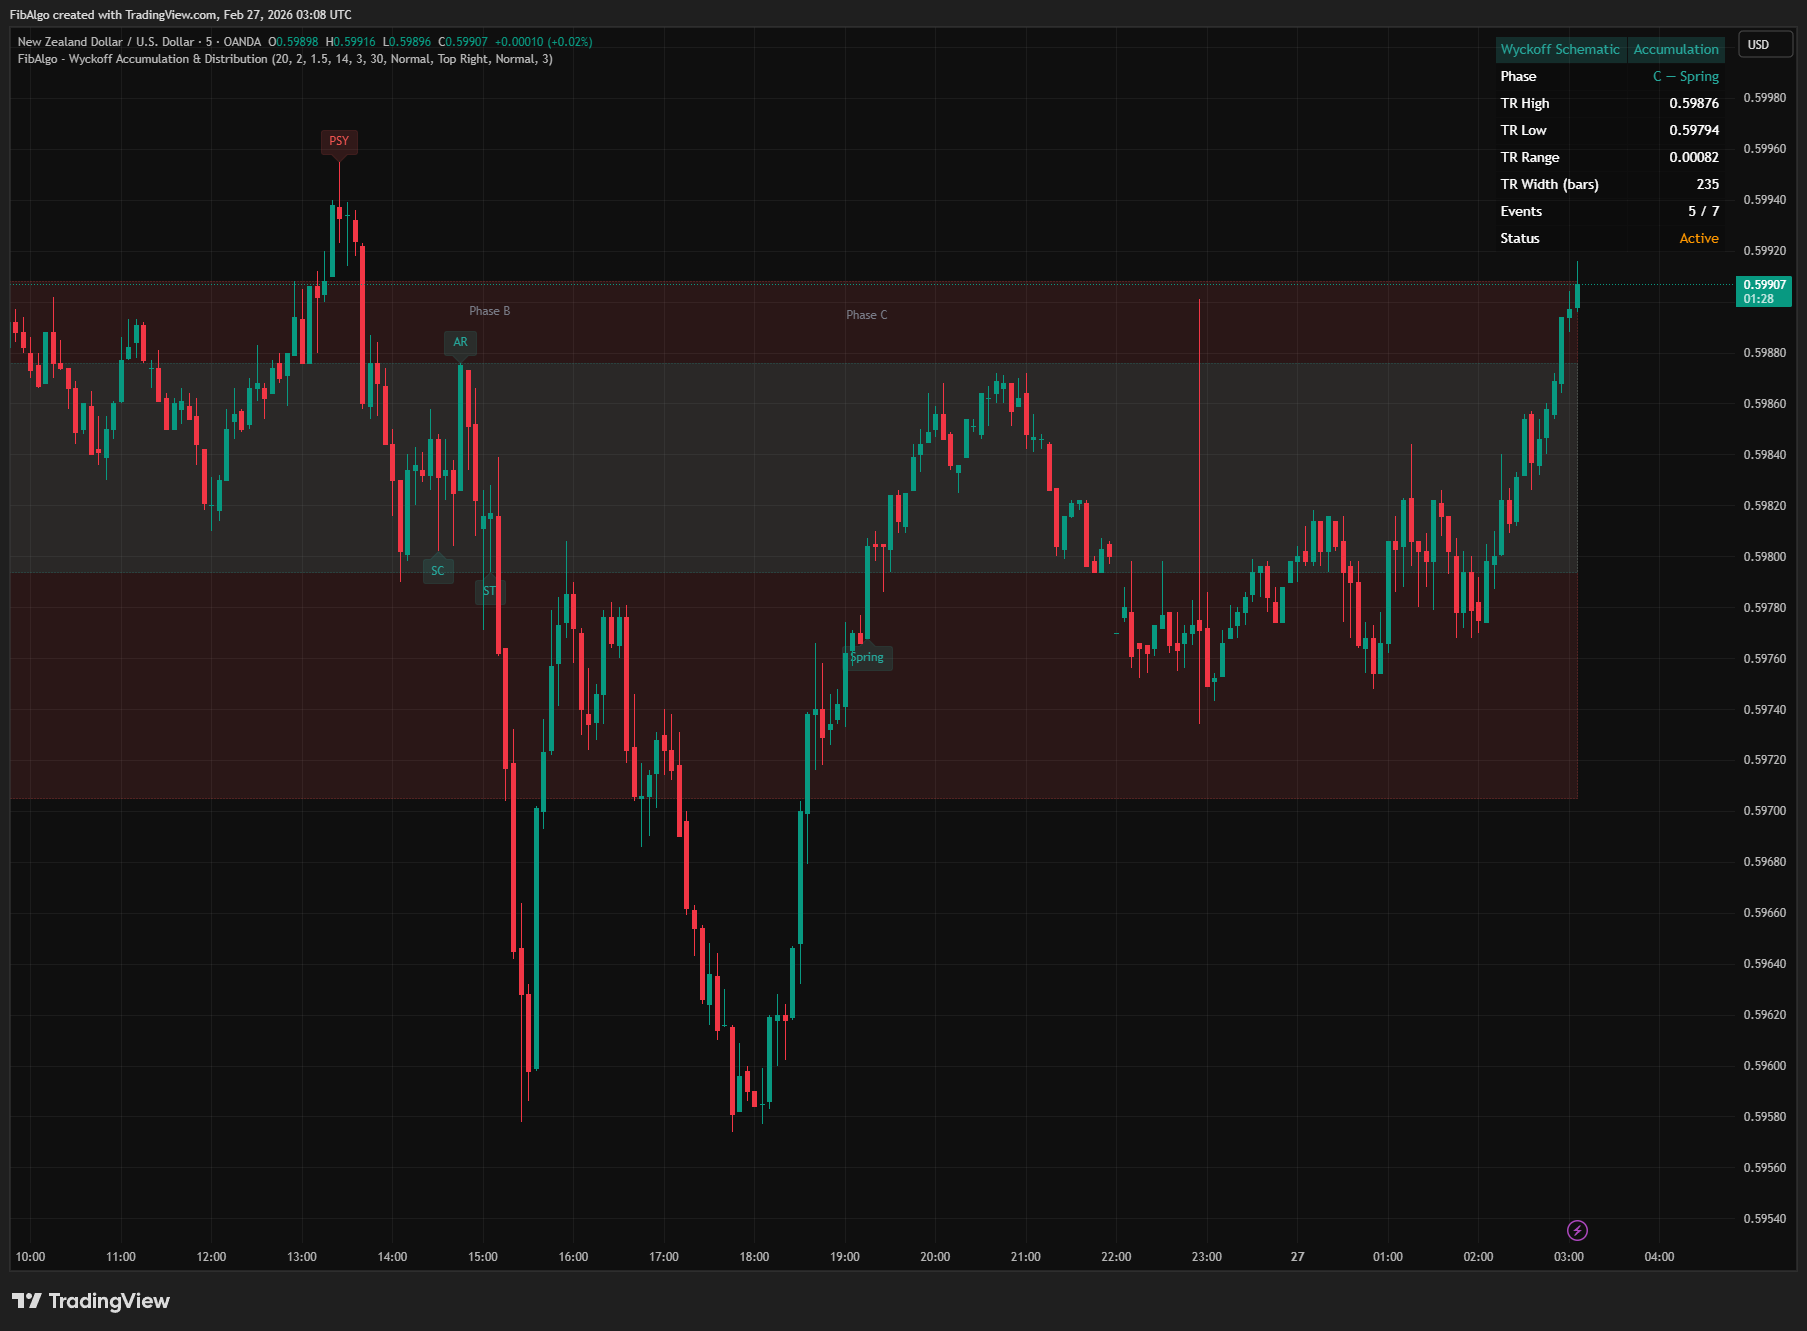
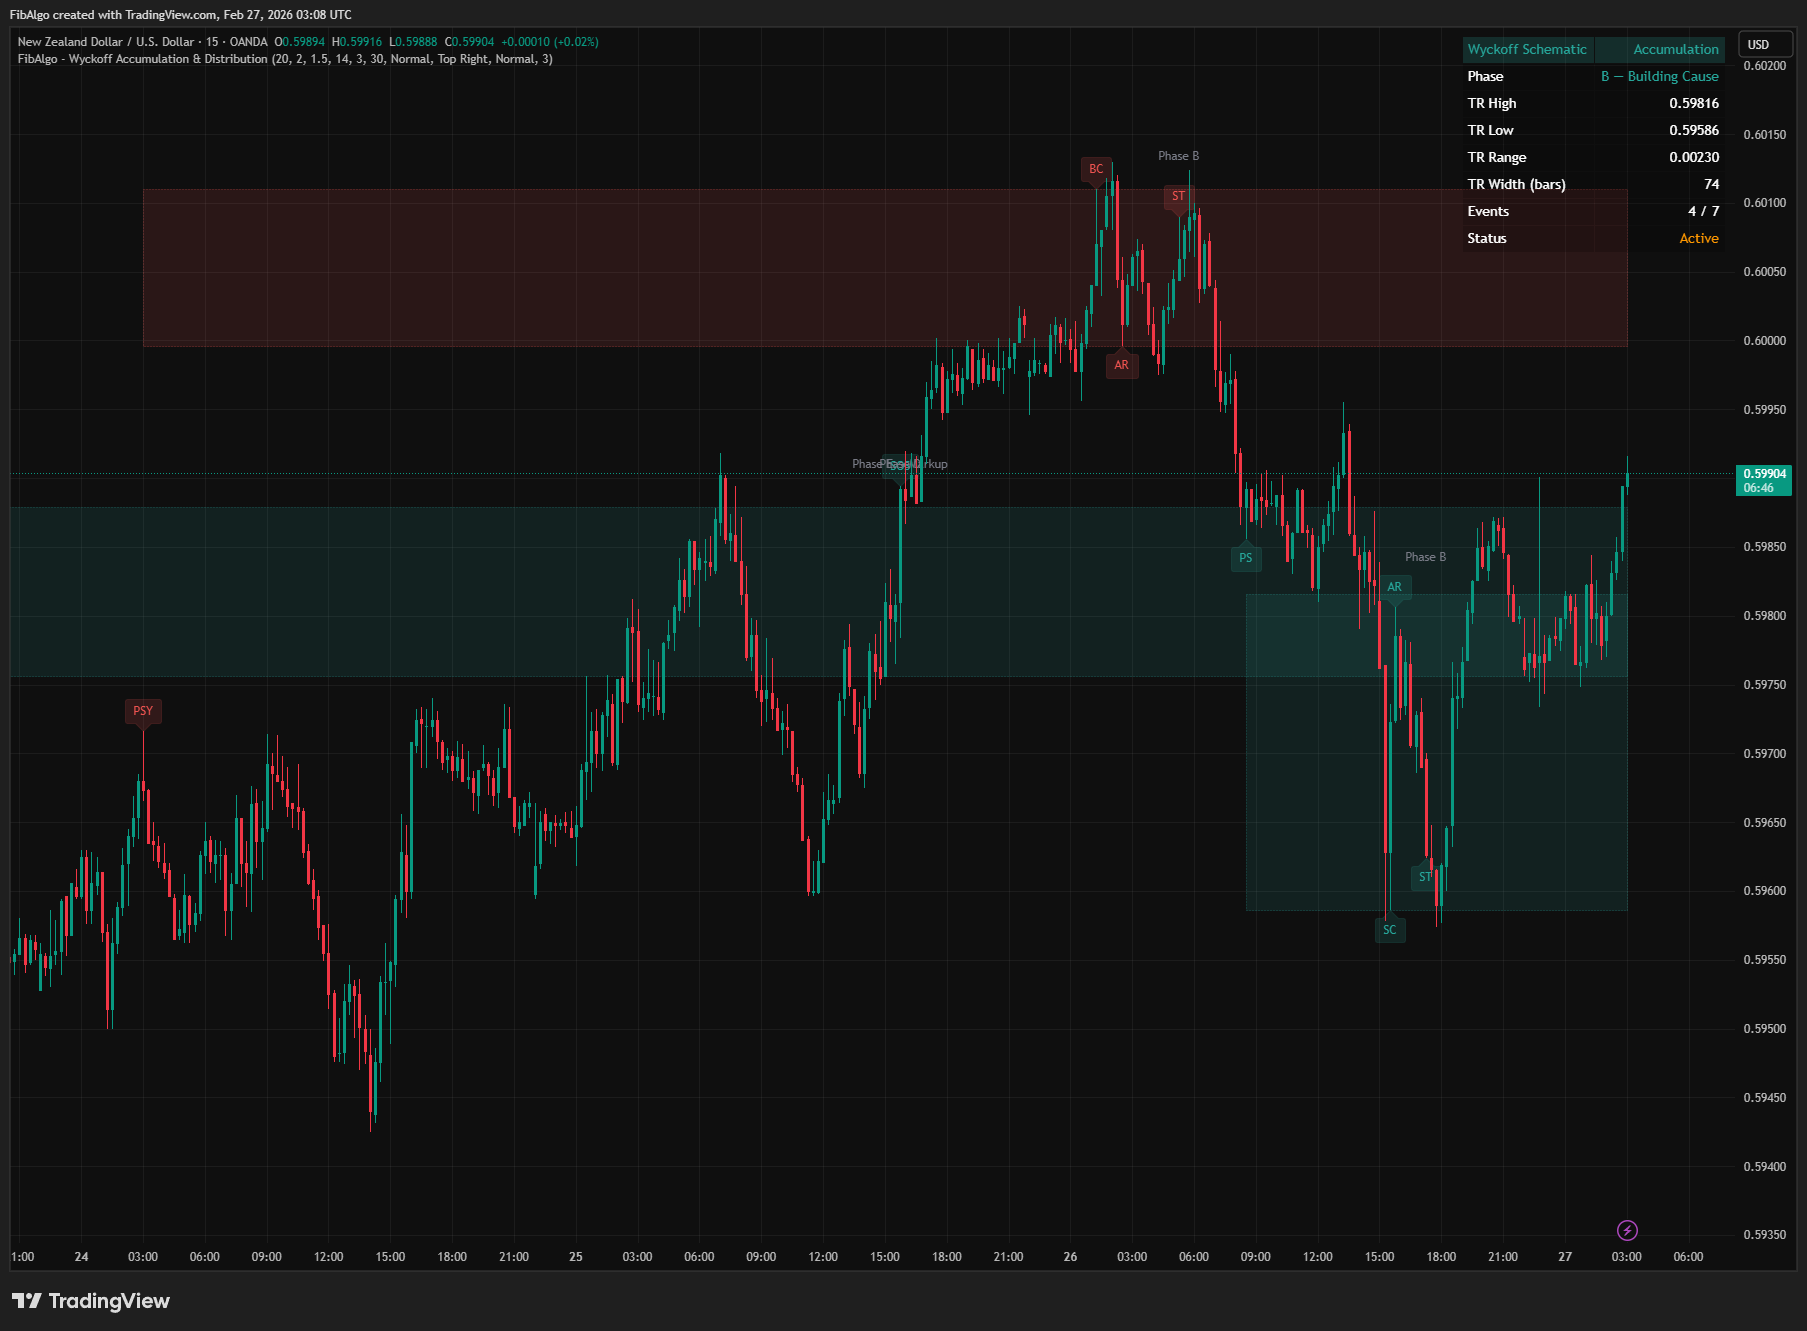
- Phase A: Preliminary Supply (PSY) shows first selling with close in the lower 40% of bar. Buying Climax (BC) has extreme volume, wide spread, and close in the lower half (failure signature). Automatic Reaction (AR) follows swiftly. Secondary Test (ST) revisits BC zone on both diminished volume AND narrower spread.
- Phase B: Range-bound consolidation. Visual TR expands while original BC/AR reference levels are preserved for Phase C.
- Phase C: Upthrust (UT) — price breaks above the reference resistance level (BC/ST high) but close fails back inside. A bull trap.
- Phase D: Sign of Weakness (SOW) is a wide-spread bearish bar closing near its low on above-average volume below mid-TR. Last Point of Supply (LPSY) is a feeble rally on diminished volume that fails below mid-TR.
- Phase E: Markdown begins as price closes below the reference support level (AR low) on above-average volume with a bearish bar.
Features
- Automated Schematic Detection — Identifies both accumulation and distribution schematics automatically using volume, spread, and price position analysis.
- Full Event Labeling — Labels all 14 Wyckoff events: PS, SC, AR, ST, Spring, SOS, LPS (accumulation) and PSY, BC, AR, ST, UT, SOW, LPSY (distribution).
- Phase Tracking (A–E) — Assigns and displays the correct phase as the schematic unfolds, providing real-time context.
- Trading Range Box — Color-coded box marking TR boundaries that extends dynamically as new events are detected.
- Volume & Spread Confirmed Events — Every event detection uses both volume and spread analysis. Climaxes require extreme volume with specific close positioning (upper half for SC absorption, lower half for BC failure). Secondary tests compare both volume AND spread to the original climax bar.
- Reference Level Separation — Phase B visual TR expansion does not affect the original SC/ST or BC/AR reference levels used for Spring and Upthrust detection, preventing false signals from tolerance drift.
- Automatic Invalidation — Schematics that fail to progress (no AR detected within the expected window, or no event activity for an extended period) are automatically invalidated and marked as stale.
- Configurable Detection — Volume multiplier, spread multiplier, TR tolerance, and trend lookback are all adjustable.
- Per-Event Toggle — Show or hide each individual event type independently for both accumulation and distribution.
- Info Table — Summary dashboard showing schematic type, phase, TR metrics, event count, and active/complete status.
- Multi-Schematic Support — Displays up to 10 simultaneous schematics with automatic cleanup of older ones.
- Comprehensive Alerts — Alerts for climax events, springs, upthrusts, SOS/SOW, and phase transitions.
How to Use
- Apply the indicator to any liquid market (futures, forex, stocks, crypto) on any timeframe in the 5-minute to daily range.
- Watch for Phase A events (SC/BC + AR + ST) to identify potential trading ranges forming.
- The highest-probability signals are Springs in accumulation and Upthrusts in distribution (Phase C events).
- After a Spring, look for SOS confirmation before taking long positions. After an Upthrust, look for SOW to confirm shorts.
- Use the Phase label to understand where you are in the schematic — avoid entries in Phase B (too early, range is still building).
- The Info Table provides a quick summary — when Events shows 5/7 or higher with an active status, the schematic is well-developed.
- Adjust Climax Volume Multiplier if your market has unusually high or low volume spikes.
Limitations
- This indicator does not generate buy or sell signals. It identifies Wyckoff schematic events for educational and analytical purposes.
- Wyckoff schematics are complex and subjective — automated detection provides a starting framework, not a definitive analysis.
- Not all accumulation/distribution ranges contain every event. Some schematics may skip PS/PSY or Spring/UT.
- Phase B can be prolonged and may show false Spring/UT-like moves before the actual Phase C event.
- Schematics that fail to produce an Automatic Rally/Reaction within the expected window are automatically invalidated. Schematics without new events for an extended period are also marked stale.
- Best performance on liquid markets with reliable volume data. Illiquid or low-volume instruments may produce unreliable readings.
- Detection is realtime — events are labeled as they occur and are not redrawn retroactively.
- The indicator is designed for educational use to help traders learn and apply the Wyckoff method.
Tags
#Wyckoff Method#Price Action#Volume Based