Overview
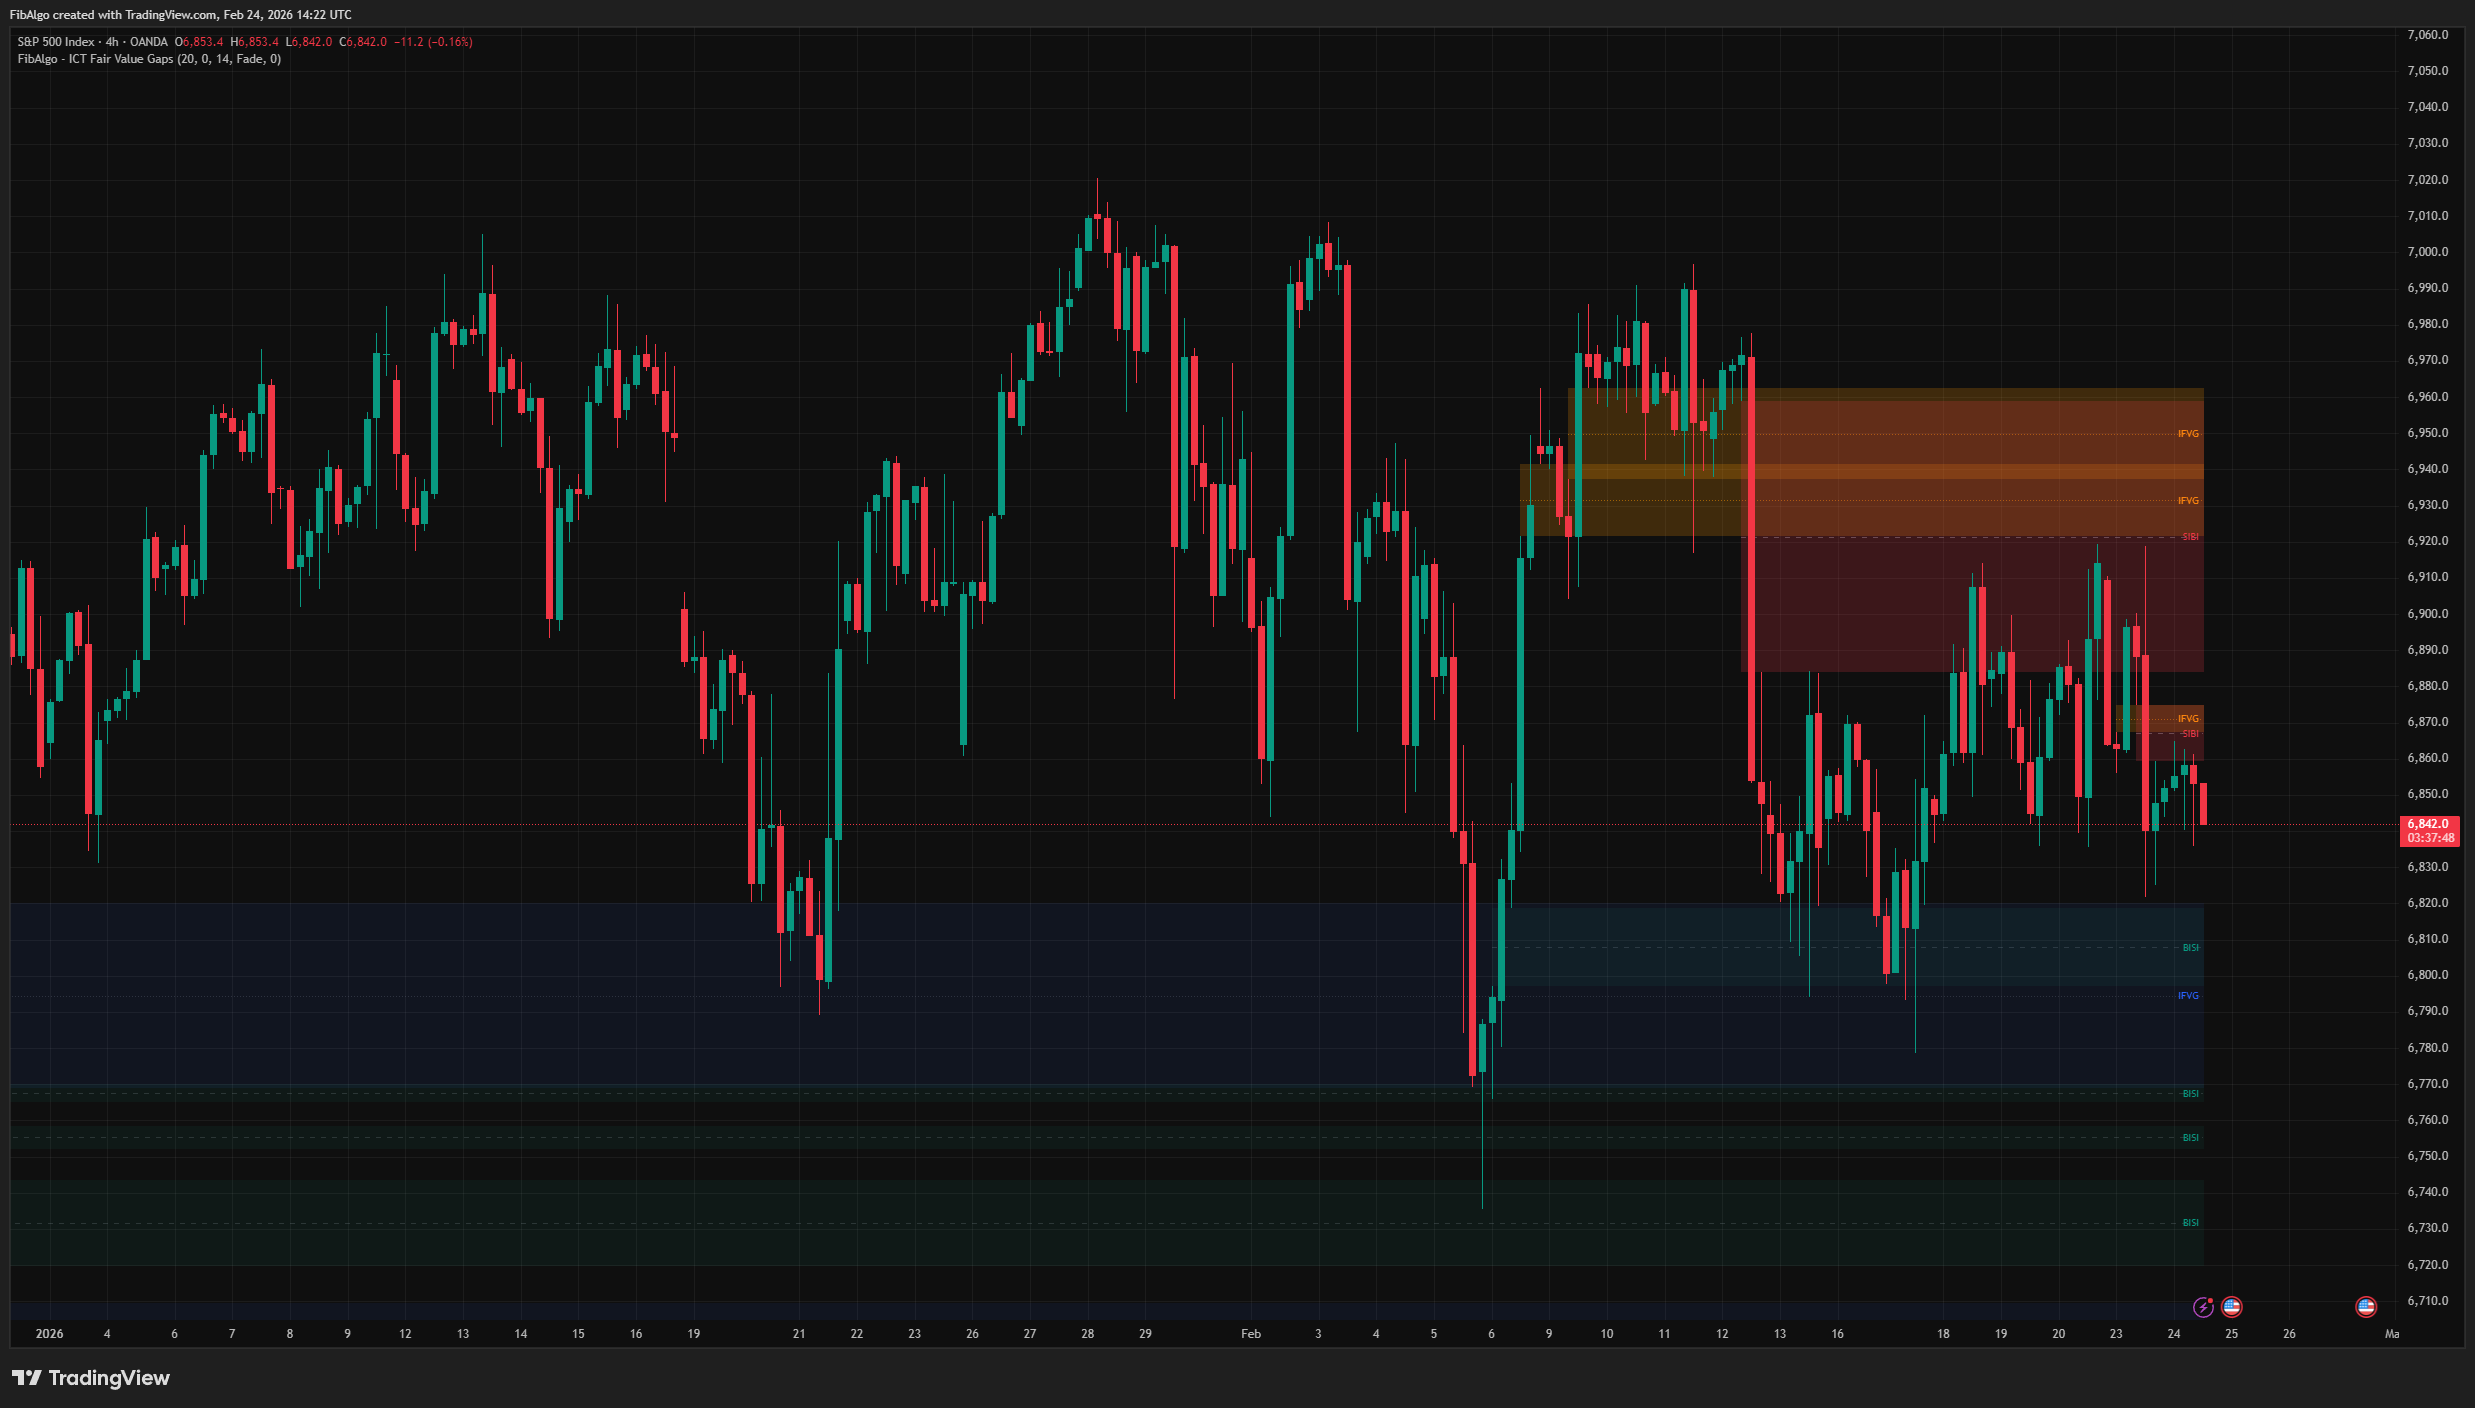
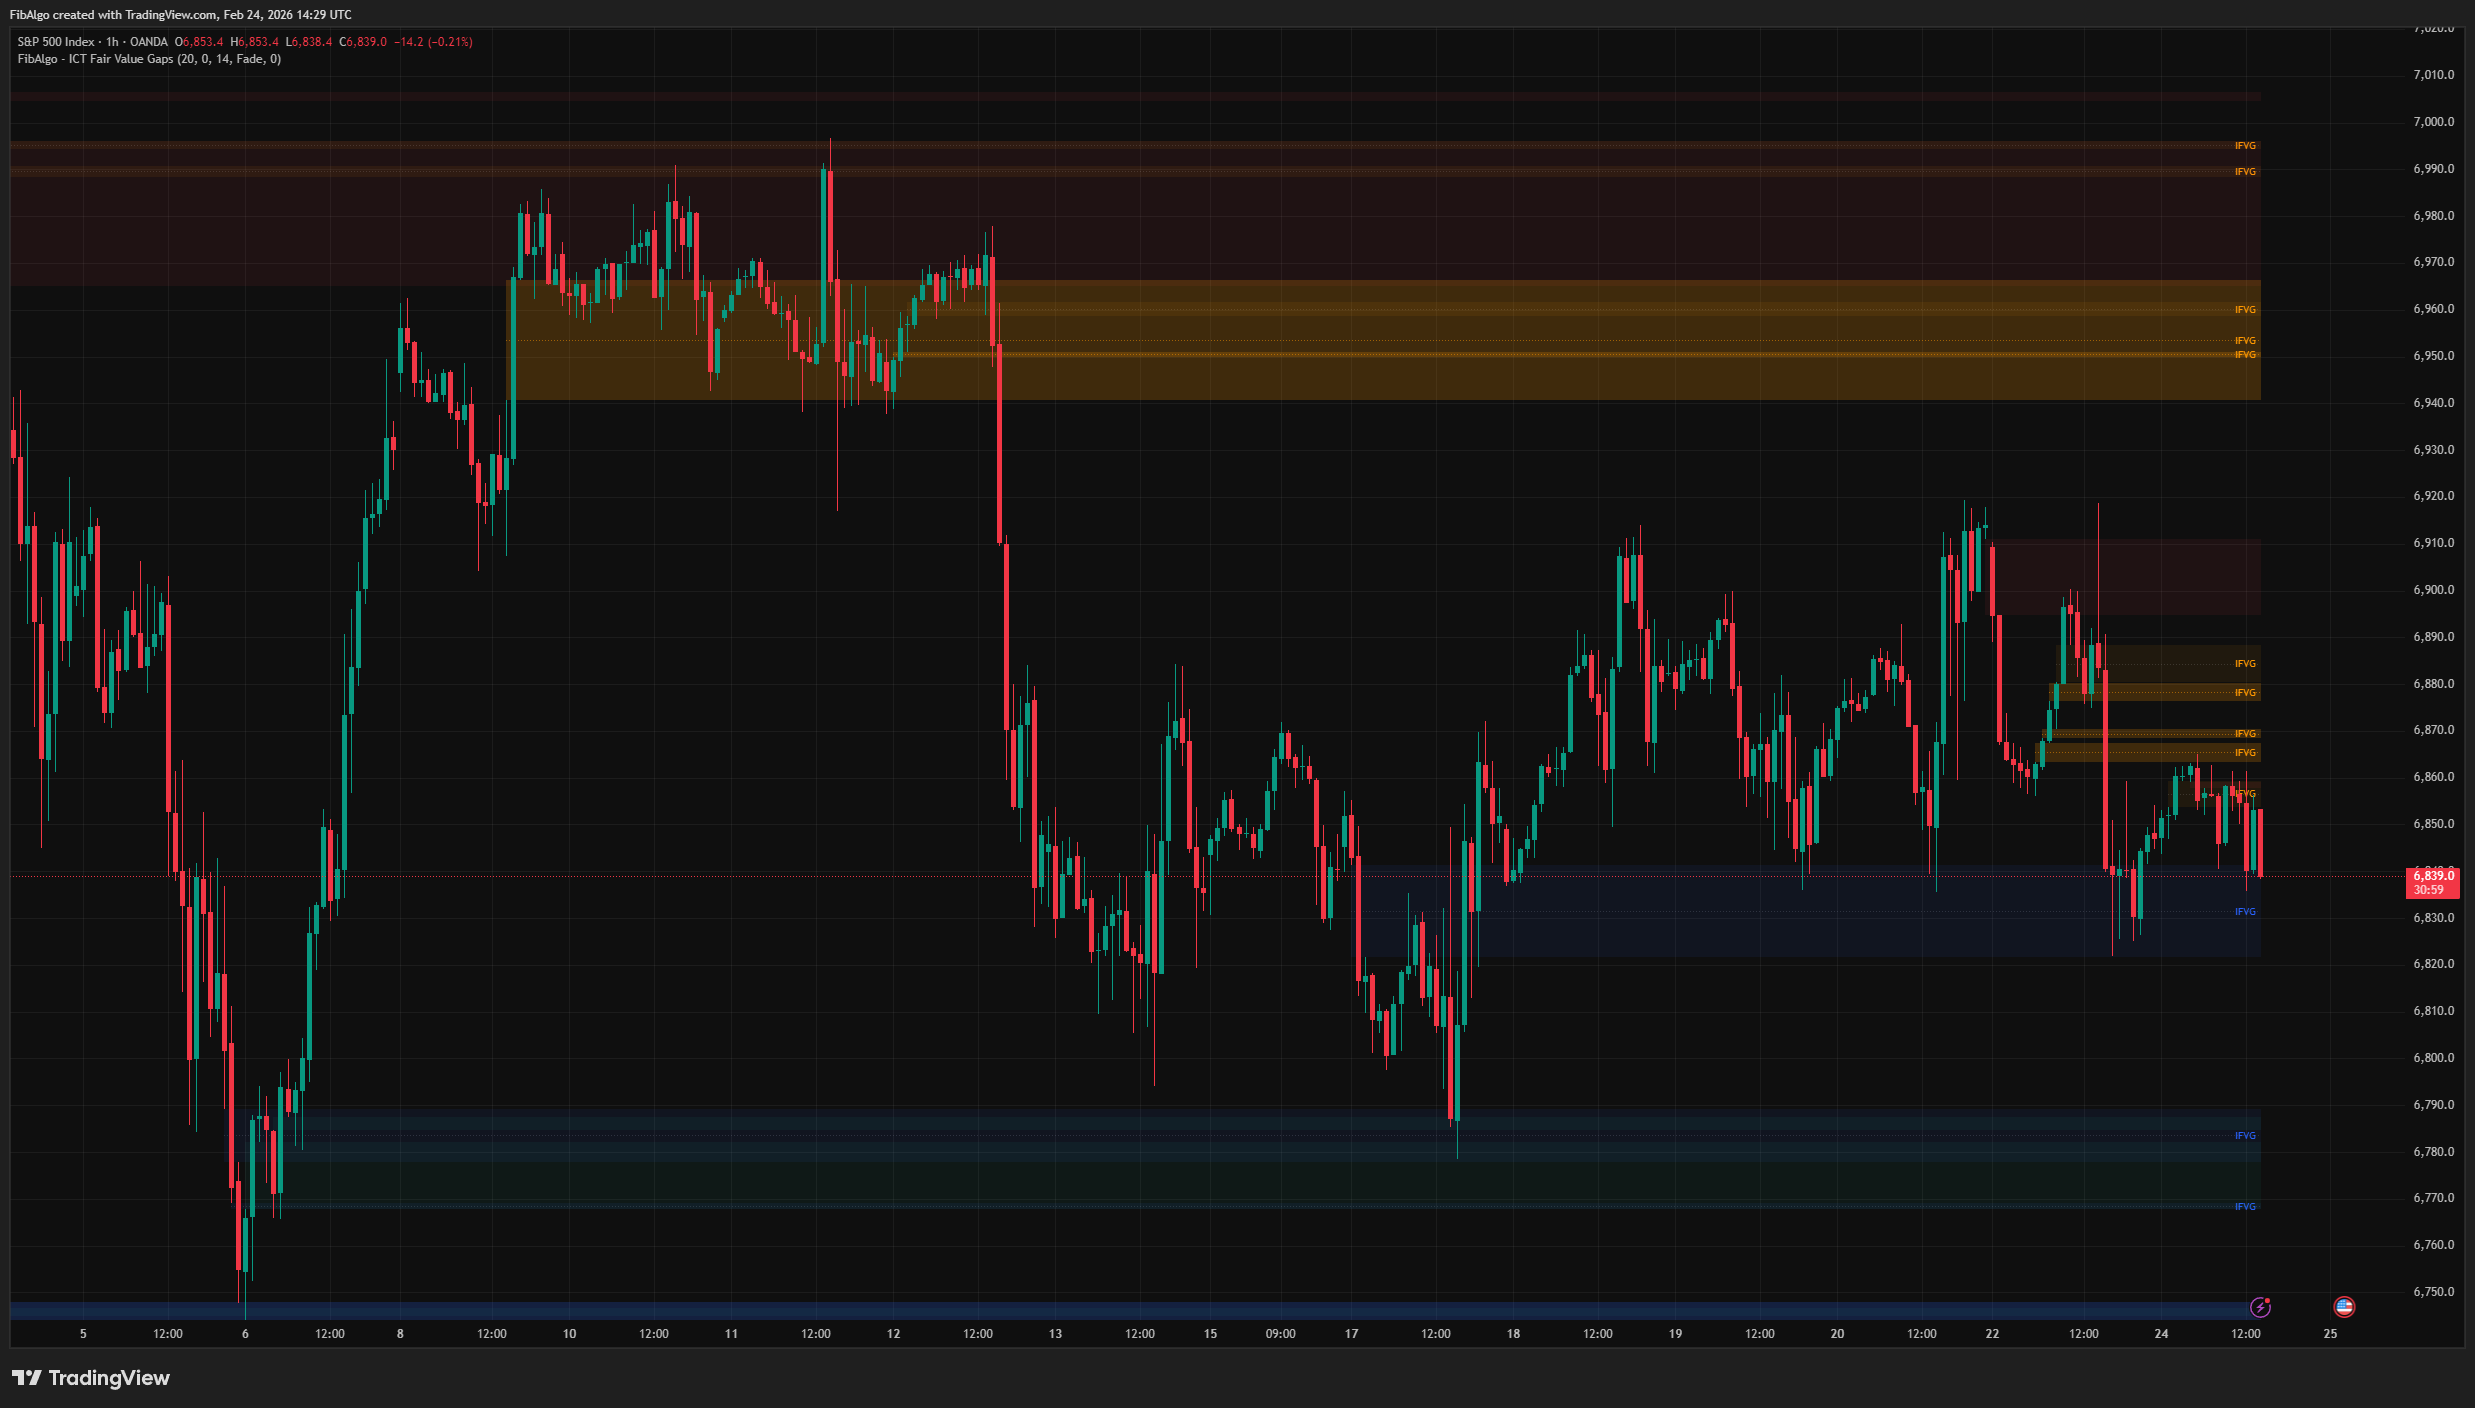
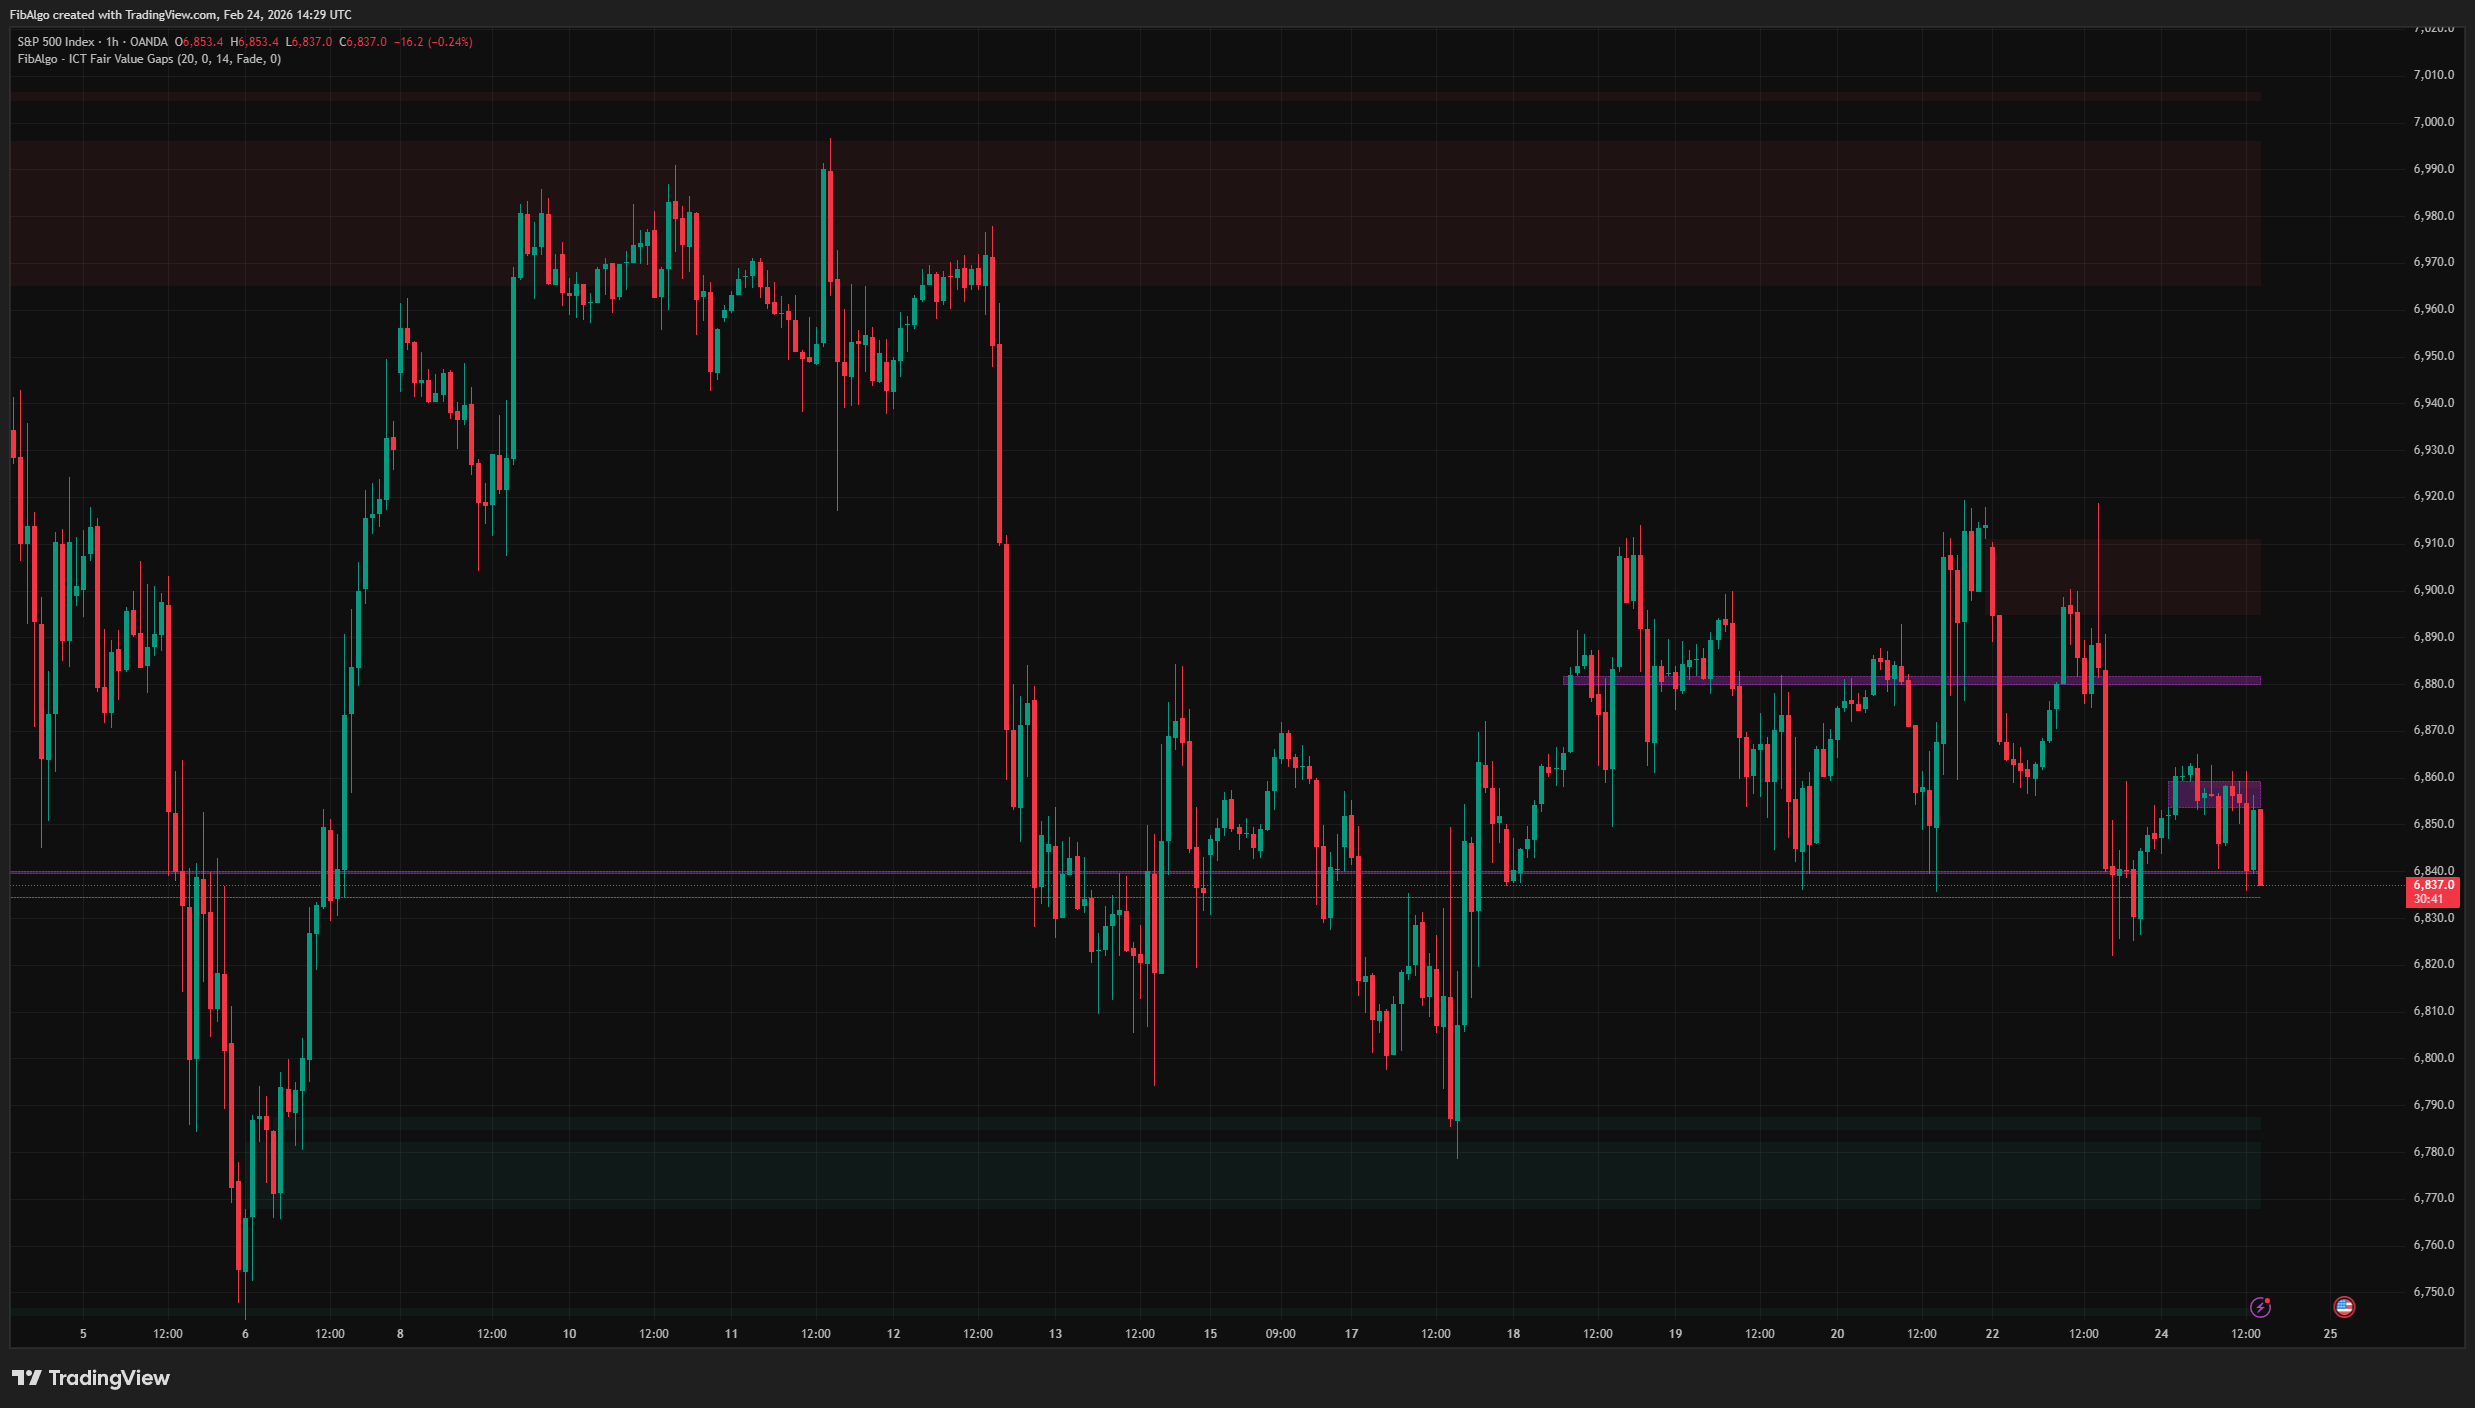
This indicator detects and manages ICT (Inner Circle Trader) Fair Value Gaps — price imbalances created when aggressive institutional order flow leaves a gap between three consecutive candles. It identifies Bullish FVGs (BISI) and Bearish FVGs (SIBI), draws the Consequent Encroachment (CE) midline, converts invalidated gaps into Inversion FVGs (IFVG), detects Balanced Price Range (BPR) overlap zones, and enforces per-type display limits so every category stays clean on your chart.
Key Concepts
- Fair Value Gap (FVG) — A 3-candle pattern where the middle candle's body is so large that it leaves a gap between candle 1's extreme and candle 3's extreme. This gap represents an area where price moved so fast that opposing orders could not participate — an institutional imbalance that price tends to revisit.
- BISI (Buyside Imbalance, Sellside Inefficiency) — The ICT term for a Bullish FVG. Excessive buying created a gap; sellers were unable to deliver efficiently at those prices. Acts as a support/demand zone.
- SIBI (Sellside Imbalance, Buyside Inefficiency) — The ICT term for a Bearish FVG. Excessive selling created a gap; buyers could not participate at those prices. Acts as a resistance/supply zone.
- Consequent Encroachment (CE) — The 50% midpoint of a Fair Value Gap. ICT teaches that price often reaches the CE before reversing, making it a more precise entry point within the gap.
- Inversion FVG (IFVG) — When price closes completely through a FVG, the gap flips direction. A Bullish FVG that gets broken to the downside becomes a Bearish IFVG (resistance); a Bearish FVG broken to the upside becomes a Bullish IFVG (support).
- Balanced Price Range (BPR) — When a Bullish FVG and a Bearish FVG overlap in the same price area, the overlapping zone forms a BPR — a very strong reaction zone where both buying and selling were inefficient.
How It Works
1. FVG Detection The indicator uses the classic 3-bar FVG pattern:- Bullish FVG (BISI): Current bar's low > two bars ago bar's high — a gap left above.
- Bearish FVG (SIBI): Current bar's high < two bars ago bar's low — a gap left below.
- Fade — The box becomes more transparent and the border turns gray, indicating the zone has been touched but may still hold.
- Remove — The zone is deleted from the chart entirely.
- None — No visual change; the zone remains active.
- A Bullish FVG broken to the downside → Bearish IFVG (resistance).
- A Bearish FVG broken to the upside → Bullish IFVG (support).
Features
- Classic 3-Bar FVG Detection — Faithful to ICT's original definition: gap between candle 1 and candle 3.
- BISI / SIBI Labeling — Proper ICT terminology displayed inside each box (right-aligned).
- Consequent Encroachment Midline — Dashed CE line at the 50% level of every FVG, the ICT "ideal fill" target.
- CE Mitigation Tracking — Fade, Remove, or None response when price reaches the CE level.
- Inversion FVG Conversion — Automatic flip from failed FVG to opposite-direction IFVG with visual differentiation (dashed border, distinct colors).
- Balanced Price Range Detection — Highlights overlapping Bull + Bear FVG zones as high-probability BPR areas.
- Per-Type Display Limits — Independent cap for each FVG category prevents chart clutter while maintaining balanced visibility.
- Size and ATR Filters — Optional filters to remove tiny gaps and require displacement-grade middle candles.
- Full Color Customization — Separate colors for Bullish FVG, Bearish FVG, Bullish IFVG, Bearish IFVG, BPR, and CE line.
- Alert System — Three configurable alerts: New FVG, CE Mitigation, and New Inversion FVG. Each includes price zone, symbol, and timeframe.
How to Use
- FVG as Entry Zone: When price returns to fill a FVG in the direction of the trend, the zone acts as a high-probability entry area. The CE midline provides a more precise entry level within the gap.
- Inversion FVG: When a Bullish FVG fails and converts to a Bearish IFVG, treat the zone as resistance on the next touch. Vice versa for Bullish IFVGs acting as support.
- Balanced Price Range: BPR zones are among the strongest reaction areas in ICT methodology. When price returns to a BPR, expect a significant reaction.
- Mitigation: A faded zone has already been touched at CE. Subsequent touches carry less significance than the initial reaction.
- Filter Tuning: Enable the ATR filter to focus only on displacement-grade FVGs. Increase Min Gap Size on lower timeframes to remove noise.
- Combine with Structure: FVGs are most effective when aligned with Order Blocks, market structure (BOS/CHoCH), and liquidity levels. Use higher-timeframe FVGs for directional bias and lower-timeframe FVGs for entry refinement.
Limitations
- FVG detection is based on the classic 3-bar pattern on the current timeframe. It does not detect lower-timeframe fills or partial gap closures.
- CE mitigation uses wick touch (low/high), while IFVG conversion requires a confirmed close beyond the zone. This distinction is intentional and follows ICT methodology.
- BPR detection only finds overlaps between a newly created FVG and existing opposite-direction FVGs. It does not retroactively scan all historical FVG pairs.
- The ATR filter evaluates the middle candle's body against ATR. It is an optional enhancement — the default detection uses only the 3-bar gap pattern.
- This indicator identifies institutional imbalance zones — it does not generate buy/sell signals. Combine with Order Blocks, market structure, liquidity analysis, and risk management for complete trade setups.
Tags
#Smart Money#Price Action#Liquidity