Overview
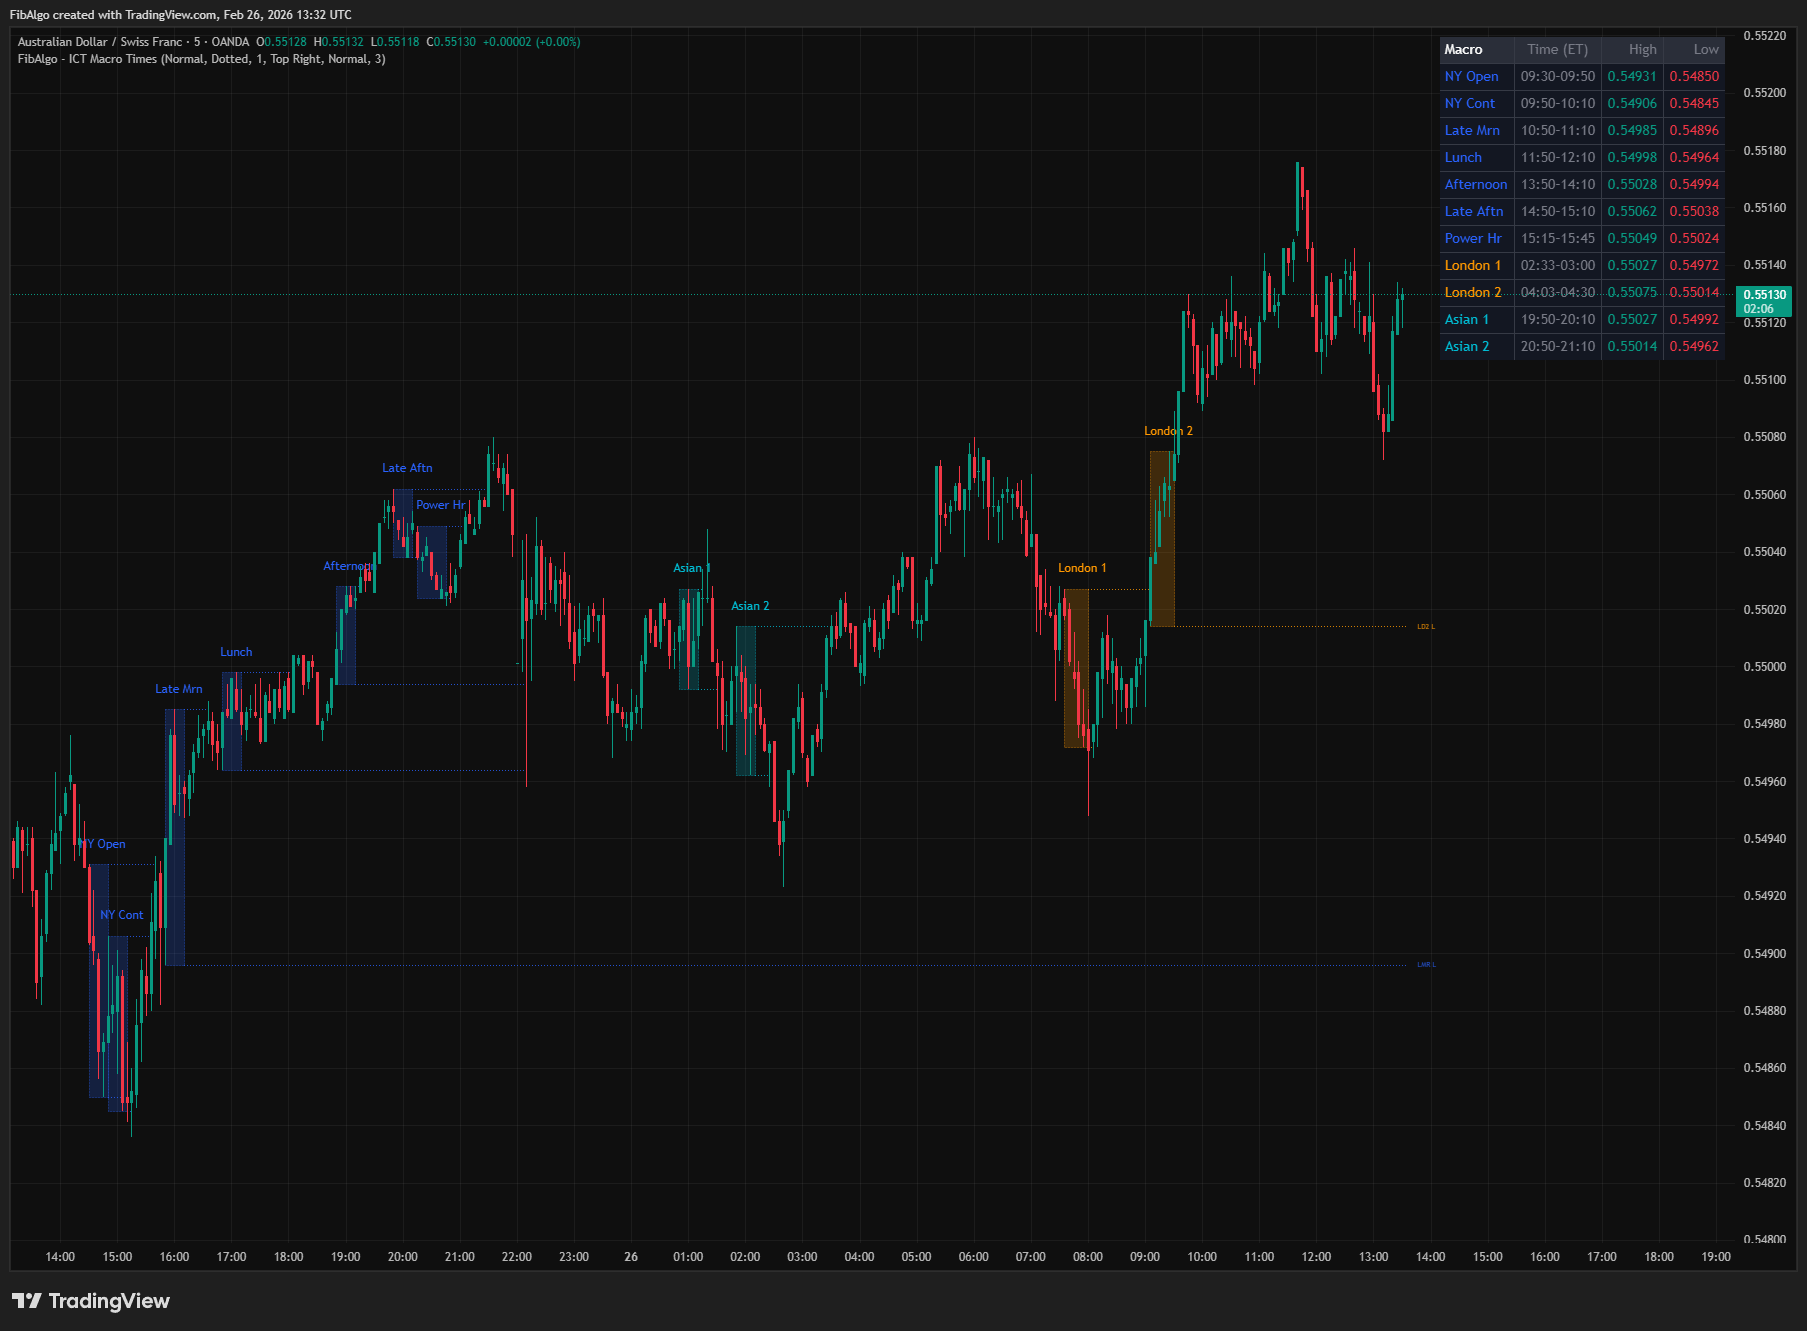
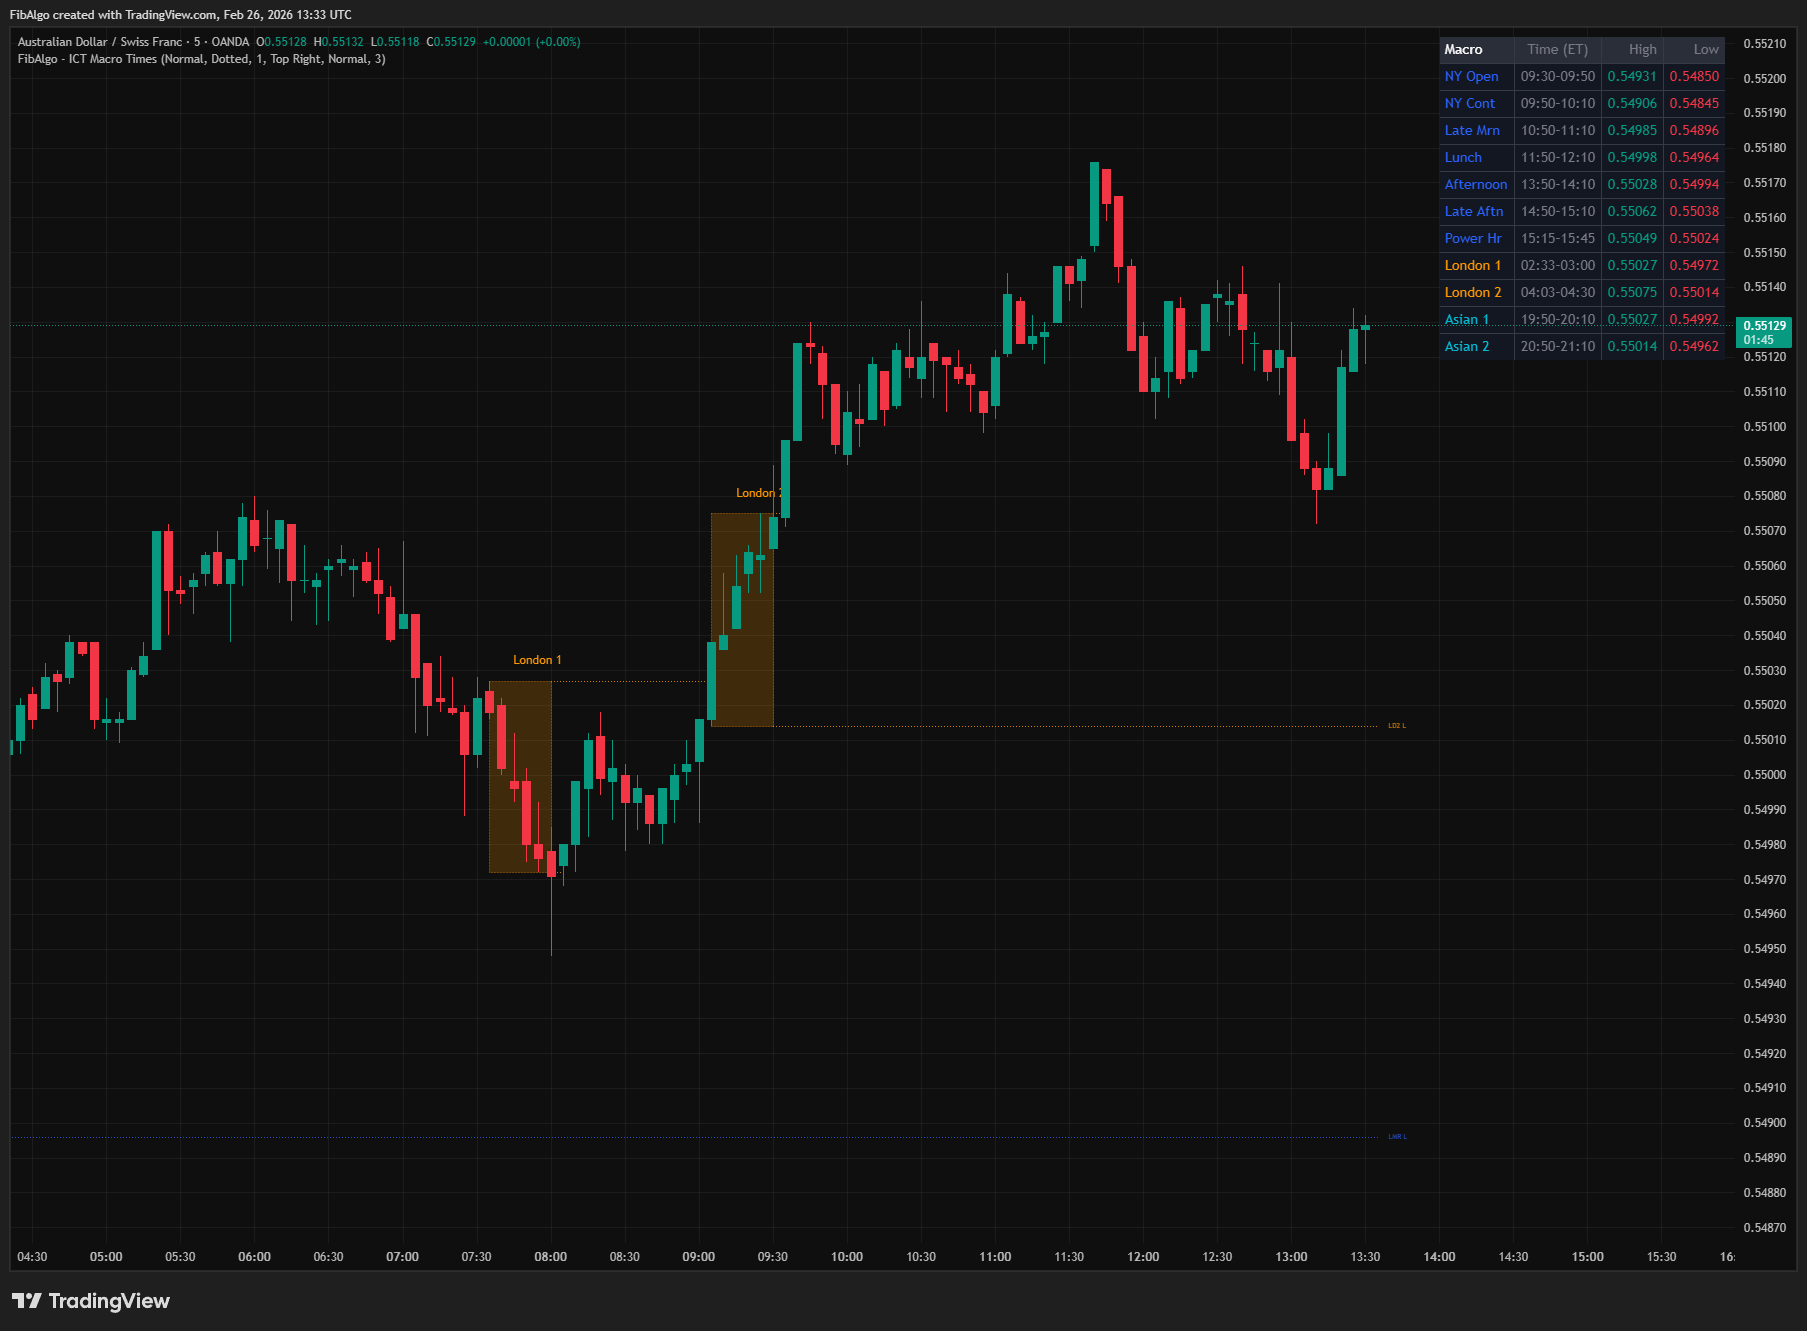
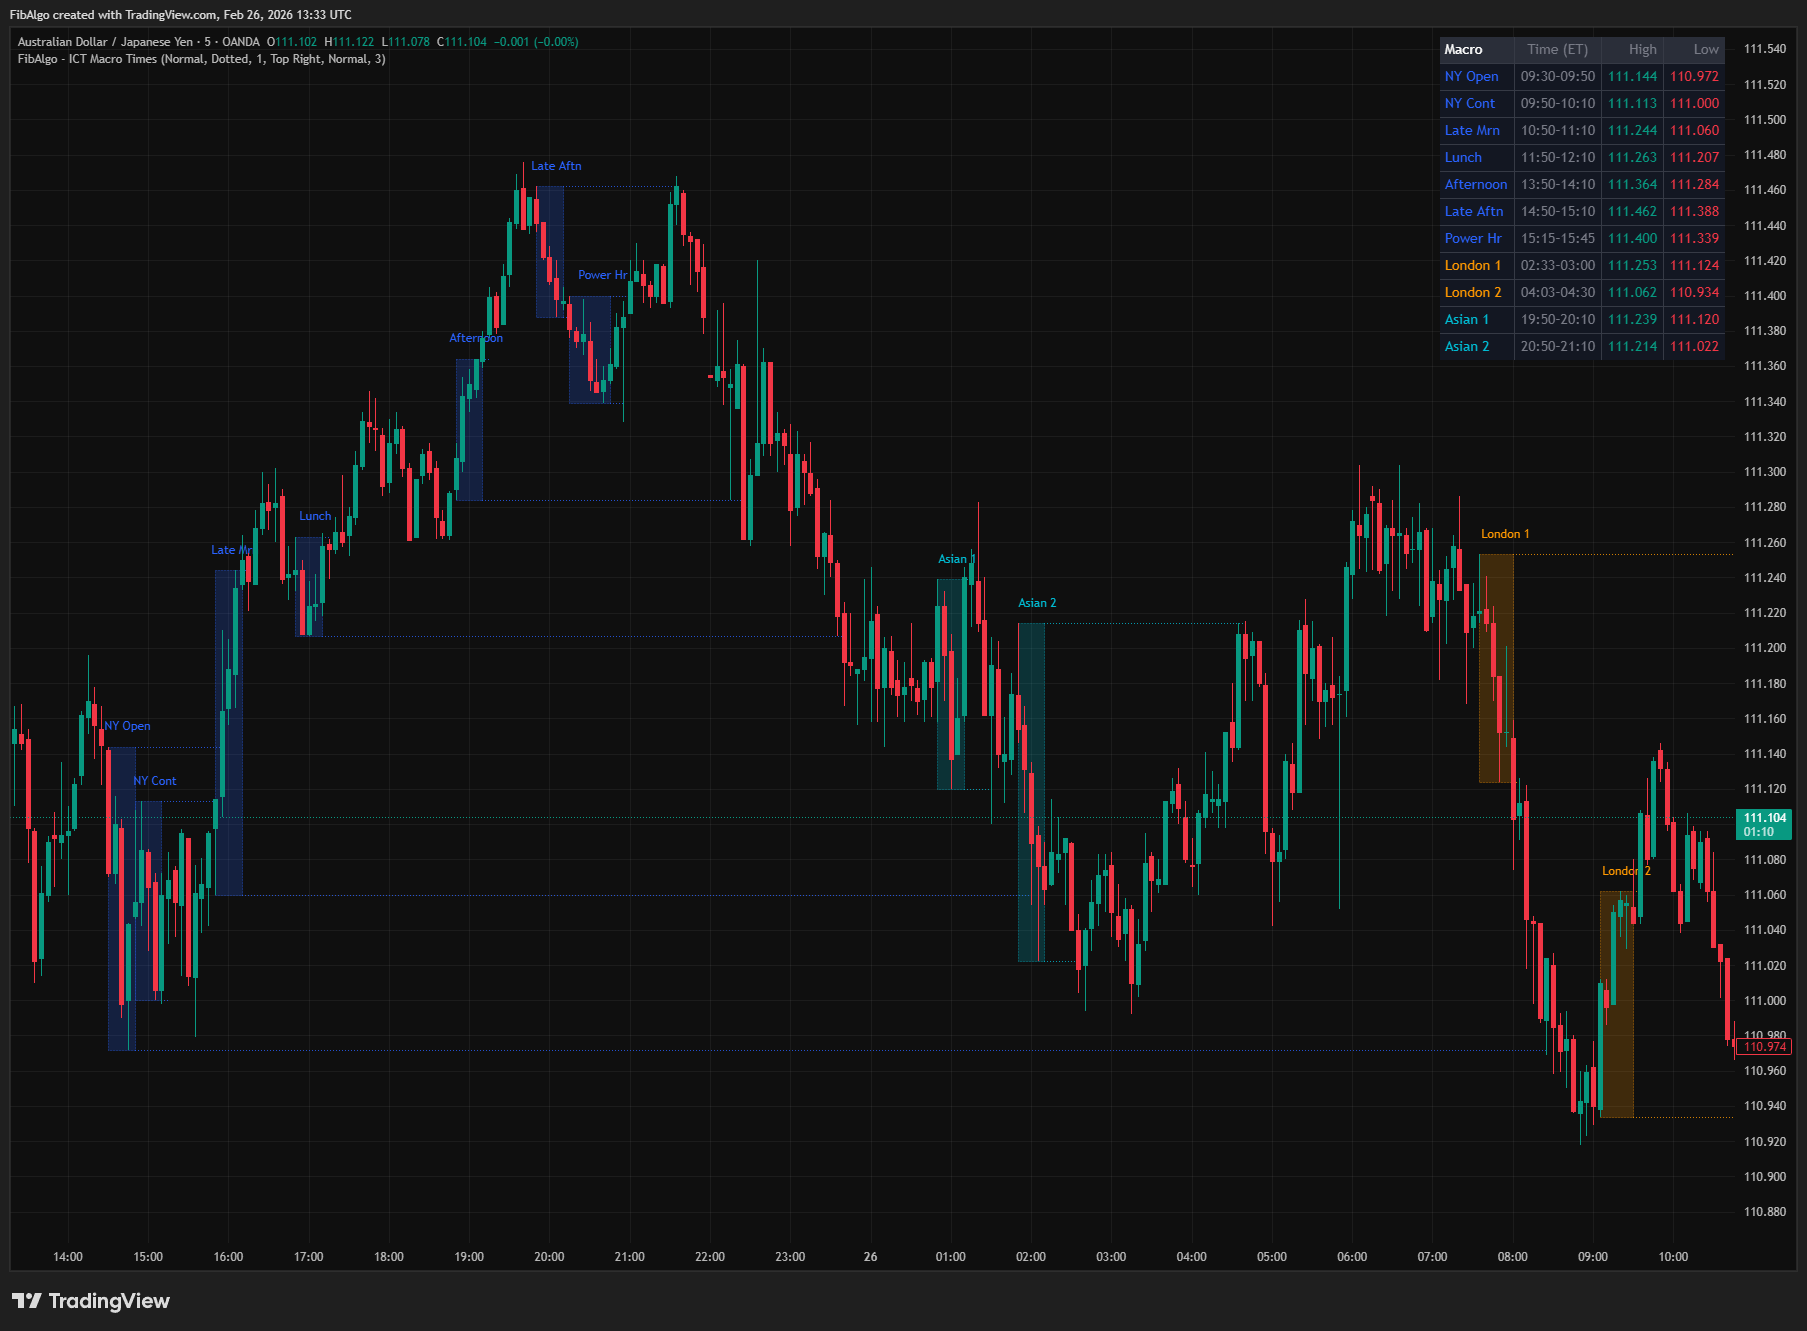
This indicator identifies and highlights the 11 ICT Macro Time windows — specific 15–20 minute intraday periods where algorithmic price delivery concentrates. Each macro window is drawn as a color-coded background box on the chart, and when the window closes, its high and low are projected forward as horizontal reference levels. The indicator uses session-based color coding (New York = blue, London = orange, Asian = cyan), tier-based default visibility, smart line management that removes old same-type levels when a new macro runs, wick-based break detection that stops extending a level once its liquidity has been swept, and a dynamic summary table showing all active and completed macros with their high/low values.
Key Concepts
- ICT Macro Times — Recurring, fixed time-of-day windows (15–20 minutes each) described in ICT methodology where the IPDA (Interbank Price Delivery Algorithm) executes significant price delivery. During these windows, the algorithm typically runs a sequence: accumulates orders, sweeps nearby liquidity (stop hunt), then displaces aggressively in the intended direction. There are 11 defined macro windows across three sessions: 7 in New York, 2 in London, and 2 in Asian session.
- Macro High/Low as Liquidity — The high and low established during a macro window function as micro-liquidity pools. Buy stops accumulate above the macro high (Buy Side Liquidity), sell stops accumulate below the macro low (Sell Side Liquidity). Later macros within the same session frequently sweep these levels — for example, the 09:50 macro may run above the 09:30 macro's high to trigger those buy stops before reversing.
- Sequential Sweep Pattern — ICT describes a pattern where consecutive macros interact with each other's levels. The first macro establishes a range, the second macro sweeps one side of that range (taking liquidity), and a later macro may sweep the other side. Tracking macro high/low levels makes this pattern visible on the chart.
- Tier Classification — Not all macro windows carry equal probability. Tier 1 (NY Open, NY Continuation, London 1, London 2) occurs during peak institutional volume and is most reliable. Tier 2 (Late Morning, Lunch, Late Afternoon) is important but situational. Tier 3 (Afternoon, Power Hour, Asian 1, Asian 2) has the lowest impact and is best used selectively.
- Wick Break (Liquidity Sweep) — When a candle's wick penetrates above a macro high or below a macro low, it indicates that the liquidity at that level has been swept. Once swept, the level loses its significance as a target — the indicator stops extending that specific line, keeping the chart clean.
How It Works
1. Macro Window Detection The indicator converts each bar's timestamp to Eastern Time (America/New_York) and checks whether the current bar falls within any of the 11 macro windows. All times are ET regardless of the chart's timezone setting. Each macro has its own toggle and can be independently enabled or disabled. Default visibility follows the tier hierarchy: Tier 1 and 2 are on by default, Tier 3 is off. 2. Window Background Shading When a macro window opens (the first bar to enter the window), a color-coded background box is created. As new bars arrive within the window, the box extends rightward and its top/bottom adjust to capture the full price range (developing high and low). A label identifies the macro above the box ("NY Open", "London 1", etc.). Session-based colors are used: all New York macros share one color (blue), both London macros share one color (orange), and both Asian macros share one color (cyan). The box has a thin dotted border for definition. 3. High/Low Level Projection When a macro window closes (the first bar after the window ends), horizontal lines are drawn at the final high and low of the window. Each line carries a short label at its right edge identifying the level — for example, "NYO H" (NY Open High) and "NYO L" (NY Open Low). Lines extend rightward on every subsequent bar, projecting the macro's range forward as reference levels.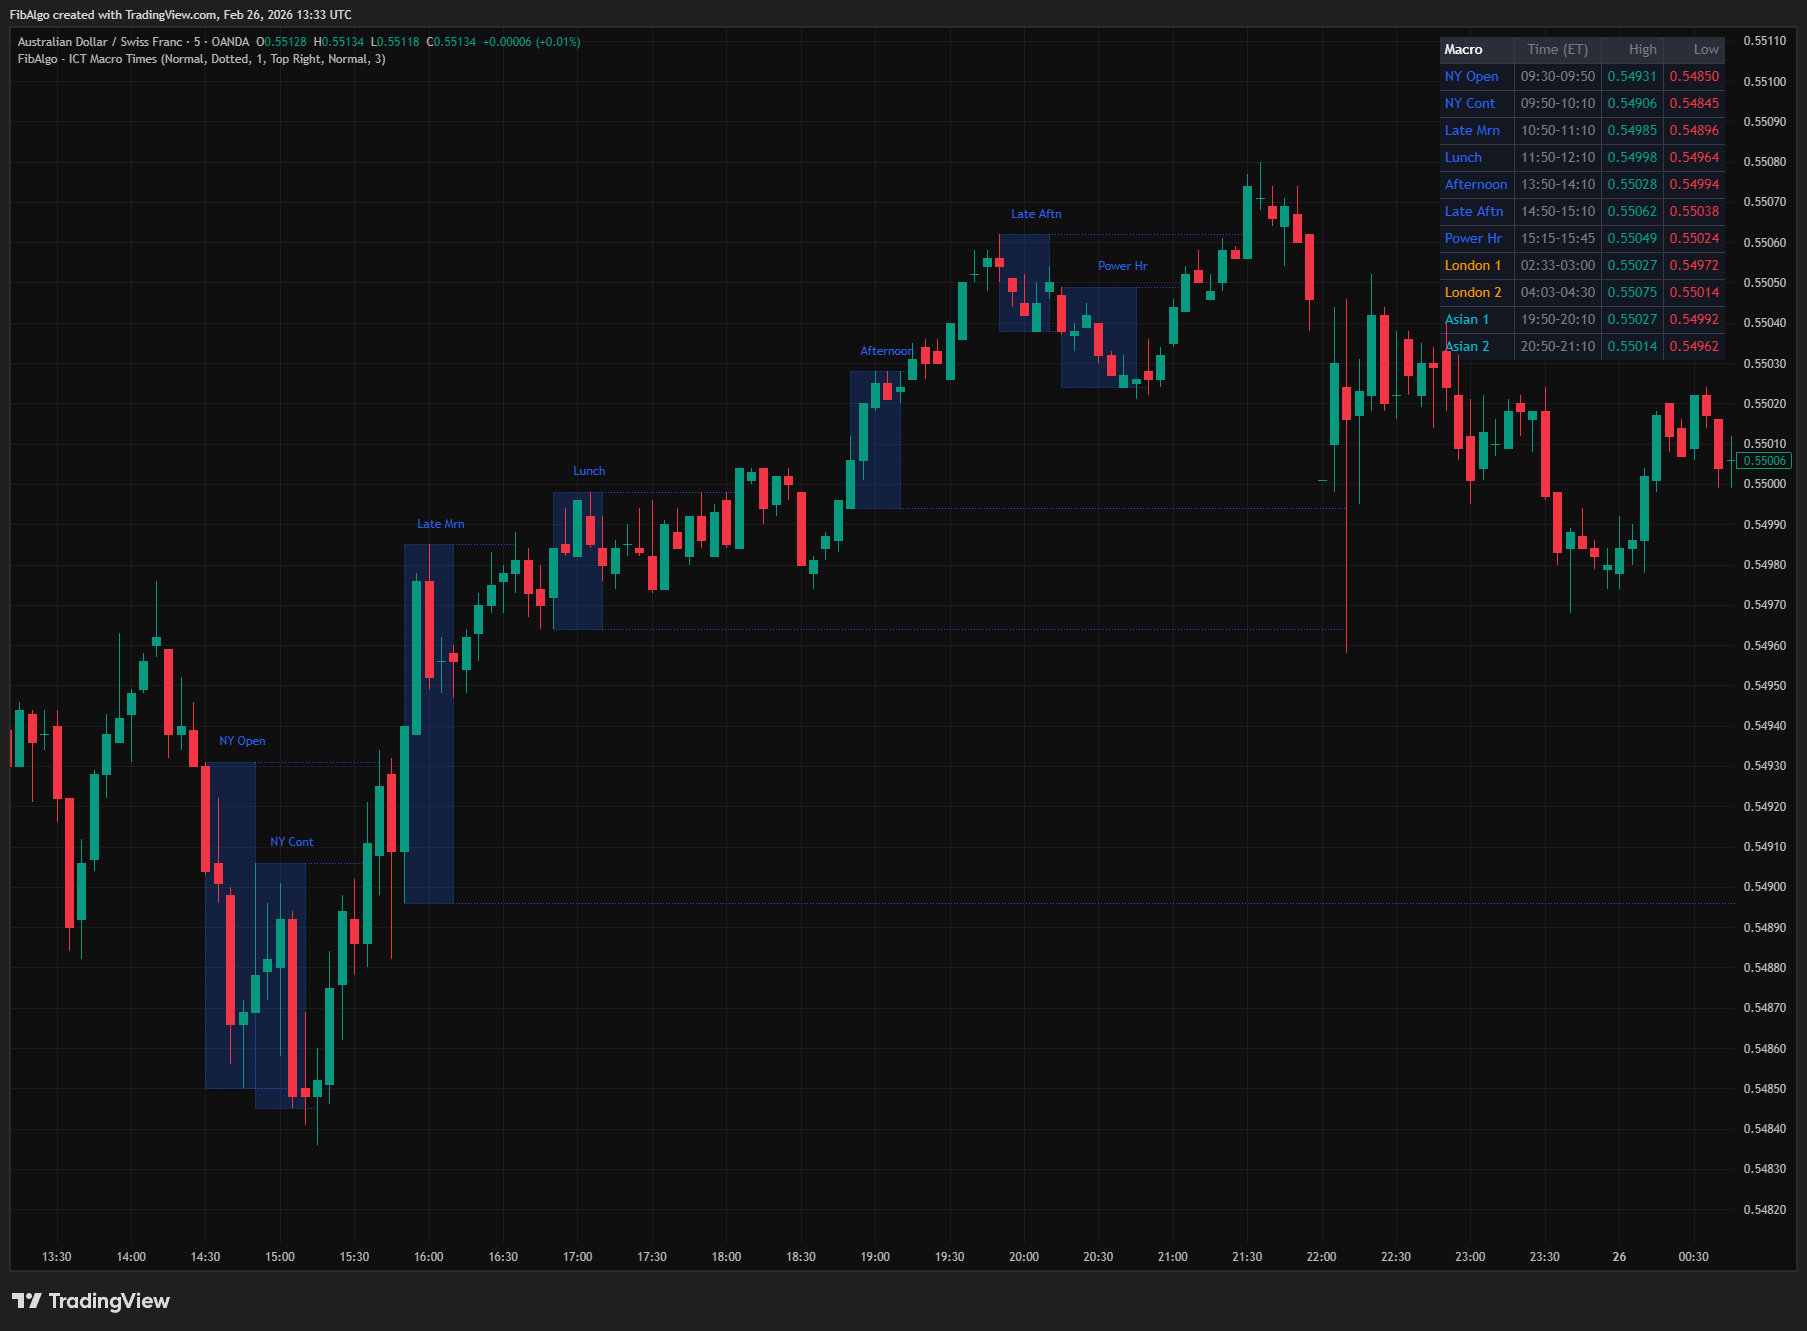
All alerts include the symbol and timeframe in the message and use once-per-bar frequency. A master "Enable Alerts" toggle disables all alert processing when off.
Features
- 11 ICT Macro Windows — All ICT-defined time windows with exact minute precision, including the non-standard 02:33 and 04:03 start times for London macros. Seven New York macros (09:30–09:50, 09:50–10:10, 10:50–11:10, 11:50–12:10, 13:50–14:10, 14:50–15:10, 15:15–15:45), two London macros (02:33–03:00, 04:03–04:30), and two Asian macros (19:50–20:10, 20:50–21:10).
- Tier-Based Default Visibility — Tier 1 (NY Open, NY Continuation, London 1, London 2) and Tier 2 (Late Morning, Lunch, Late Afternoon) are enabled by default. Tier 3 (Afternoon, Power Hour, Asian 1, Asian 2) is disabled by default. New users see a clean chart with only the highest-probability macros visible. Each toggle includes a tooltip explaining its tier classification.
- Session-Based Color Coding — One color per session instead of per macro: New York (blue), London (orange), Asian (cyan). All colors are independently configurable. This keeps the chart visually organized — you can instantly distinguish which session a macro belongs to.
- Smart Line Management — When a new macro of the same type opens (e.g., next day's NY Open), all previous same-type high/low lines are automatically deleted. Only the most recent completed macro of each type shows level lines. Maximum of 22 lines on chart at any time (11 macro types × 2 lines each) regardless of history depth.
- Wick Break Detection — When a candle's wick breaks above a macro high or below a macro low, that line stops extending. Indicates liquidity has been swept at that level. Each line is tracked independently — the high can be broken while the low continues extending. Broken lines freeze in place, showing exactly where and when liquidity was taken.
- Level Labels — Each high/low line carries a short abbreviation label (e.g., "NYO H", "LD1 L", "LCH H") at its right edge. Labels move with the extending line and are removed when the line breaks. Provides instant identification of which macro created which level.
- Dynamic Summary Table — Shows only enabled macros. Active macro rows are highlighted with ► prefix and colored background. Developing (live) high/low values are displayed while a macro window is still open. Completed macros show their final values. Table row count adjusts dynamically as macros are enabled/disabled.
- Per-Macro Toggle — Each of the 11 macros has its own enable/disable toggle. Tooltips explain the tier level and significance of each macro. Enable only the macros relevant to your trading session or style.
- 2 Alert Conditions — Macro window opened and macro window closed. Each alert has an independent toggle and includes symbol, timeframe, and macro name. Close alerts include the final high and low values. Master enable switch for all alerts.
- Timezone Independent — All time calculations use Eastern Time (America/New_York) internally regardless of the chart's timezone setting. Macros appear at the correct times on any chart.
- Full Color Customization — Independent color settings for each session's background boxes. High/low line style (Solid/Dashed/Dotted) and width (1–3) are configurable. Label sizes for macro names and table text are independently adjustable.
- History Management — Configurable number of days (1–30) to retain macro window boxes on the chart. Oldest macros are automatically removed with all associated drawing objects to stay within TradingView limits.
How to Use
- Identify Active Windows: Enable window background shading to see when macro windows are active. The colored boxes highlight the precise 15–20 minute delivery windows on your chart. Focus your attention on price action within these boxes — this is where algorithmic delivery concentrates.
- Track Developing Range: While a macro window is open, the box expands in real time to show the developing high and low. The summary table simultaneously shows the live values with a ► marker. This tells you the range that is being established.
- Use Levels After Close: Once a macro window closes, its high and low lines project forward as reference levels. These represent liquidity pools — buy stops above the high, sell stops below the low. Later macros within the same session may target these levels.
- Watch for Sequential Sweeps: The 09:30 macro establishes a range. The 09:50 macro may sweep the 09:30 high or low. The 10:50 macro may sweep the other side. By tracking macro levels, this sequential sweep pattern becomes visible. When a wick breaks a macro level, the line freezes — confirming the sweep occurred.
- Focus on Tier 1 First: NY Open (09:30–09:50) and NY Continuation (09:50–10:10) are the most important macros during the New York session. London 1 (02:33–03:00) and London 2 (04:03–04:30) are the most important for the London session. Start with these four before adding lower-tier macros.
- Use on Appropriate Timeframes: Macro windows are 15–20 minutes each. On 1m charts, each window spans 15–20 candles. On 5m charts, each window spans 3–4 candles. On 15m+, windows may contain only 1 candle, making the range less meaningful. Best results on 1m to 5m.
- Combine with ICT Framework: Macro Times identify WHEN to expect significant price delivery. Combine with Market Structure (direction), Order Blocks (entry levels), Fair Value Gaps (retracement zones), Premium/Discount (range positioning), Liquidity Levels (targets), and Killzones (broader session context). A macro sweep of a liquidity level inside a killzone with displacement creating an FVG is a high-confluence setup.
Limitations
- Macro windows are 15–20 minutes in duration. On timeframes of 15m or higher, each window may contain only 1 candle or zero candles, making the high/low range less meaningful. Use this indicator on 1m to 5m for best results.
- All macro times follow ICT's published specifications and use Eastern Time (ET). These times are not customizable — they represent the specific windows where ICT identifies algorithmic delivery. Markets may occasionally behave differently during these windows.
- Wick break detection uses the candle's high and low (not close). A single wick spike above a macro high will permanently stop that line from extending, even if price immediately reverses. This is by design — the wick confirms liquidity was swept at that level.
- Smart line management deletes previous same-type lines when a new macro opens. If you want to see historical macro levels from previous days, the lines will not be available — only the most recent instance of each macro type retains its H/L lines. Background boxes are preserved based on History Days.
- The summary table recalculates on the last bar only. The table shows the latest completed (or developing) high/low for each macro type — it does not retain historical statistics across multiple instances.
- Drawing object limits: TradingView allows 500 boxes, 500 lines, and 500 labels. Each macro window uses up to 2 objects (box + label). Each completed macro uses up to 4 additional objects (2 lines + 2 labels). With default settings (3 days history, 7 macros enabled), usage stays well within limits.
- The indicator does not incorporate other ICT concepts (order blocks, FVGs, market structure, premium/discount). Each concept has its own dedicated indicator in the FibAlgo ICT series. Macro Times identifies WHEN — use other indicators to identify WHAT and WHERE.
- Macro window ranges are observational reference levels. They do not guarantee future price behavior. Past performance and price patterns around macro times are not indicative of future results.