Overview
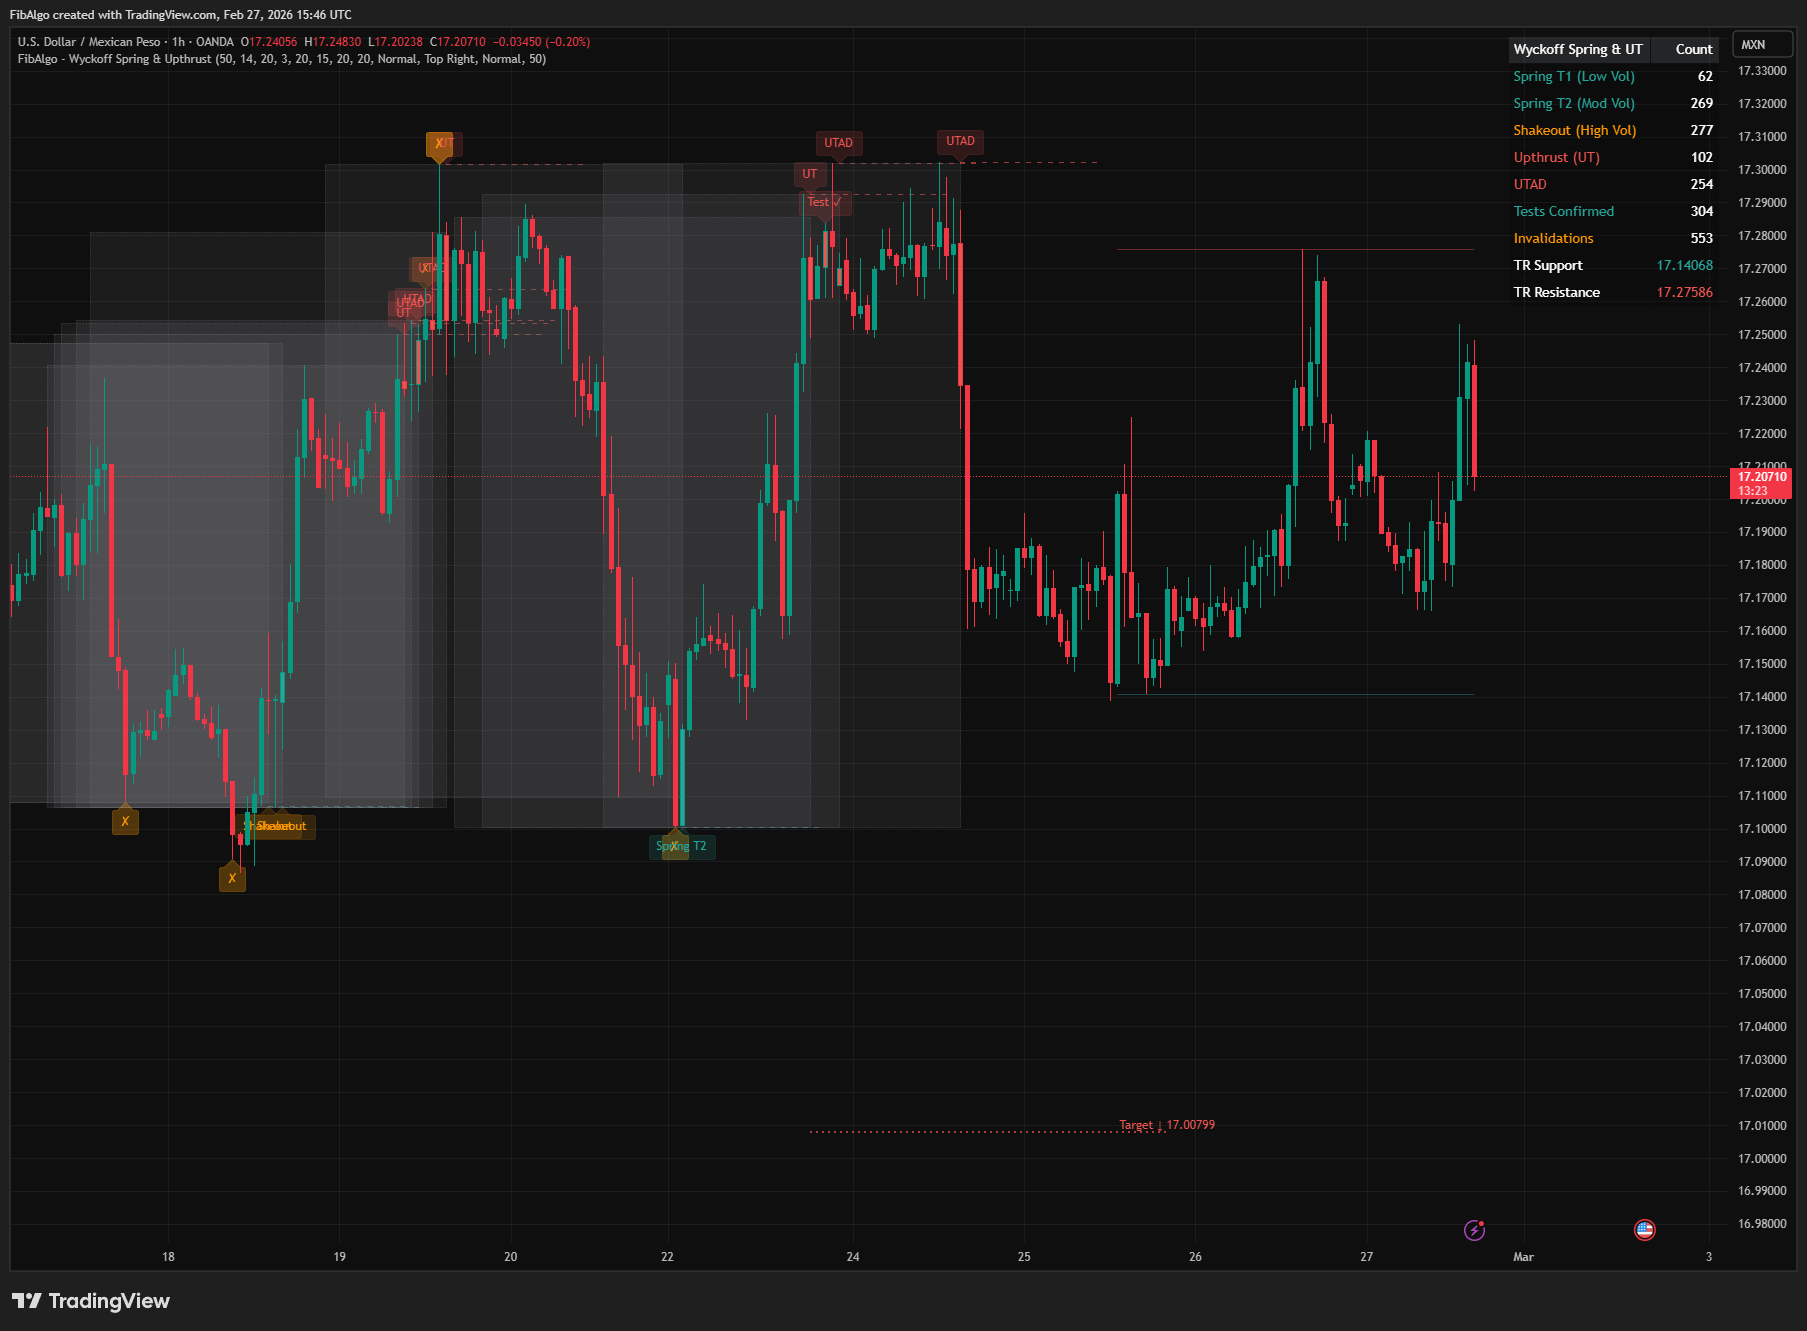
FibAlgo - Wyckoff Spring & Upthrust is a dedicated detector for the two most actionable events in Wyckoff methodology. A spring occurs when price briefly breaks below Trading Range support and quickly recovers — shaking out weak holders before a potential rally. An upthrust is the mirror image: price breaks above TR resistance and reverses — trapping breakout buyers before a potential decline. This indicator automatically identifies Trading Range boundaries, classifies springs into three types by volume, detects upthrusts and UTADs, tracks test confirmations and invalidations, and projects price targets after confirmed events.
Key Concepts
- Spring — Price breaks below Trading Range support and recovers back inside within a few bars. Tests remaining supply and shakes out weak holders. The best risk/reward entry in Wyckoff methodology.
- Spring Type 1 (Low Volume) — Barely breaks support on light volume with close in the upper portion of the bar. Highest probability reversal. Immediate Sign of Strength often follows.
- Spring Type 2 (Moderate Volume) — Breaks below with moderate volume. Needs a successful test before confirming demand.
- Spring Type 3 / Shakeout (High Volume) — Aggressive break below on high volume. May visit lower levels before recovering. Must be tested.
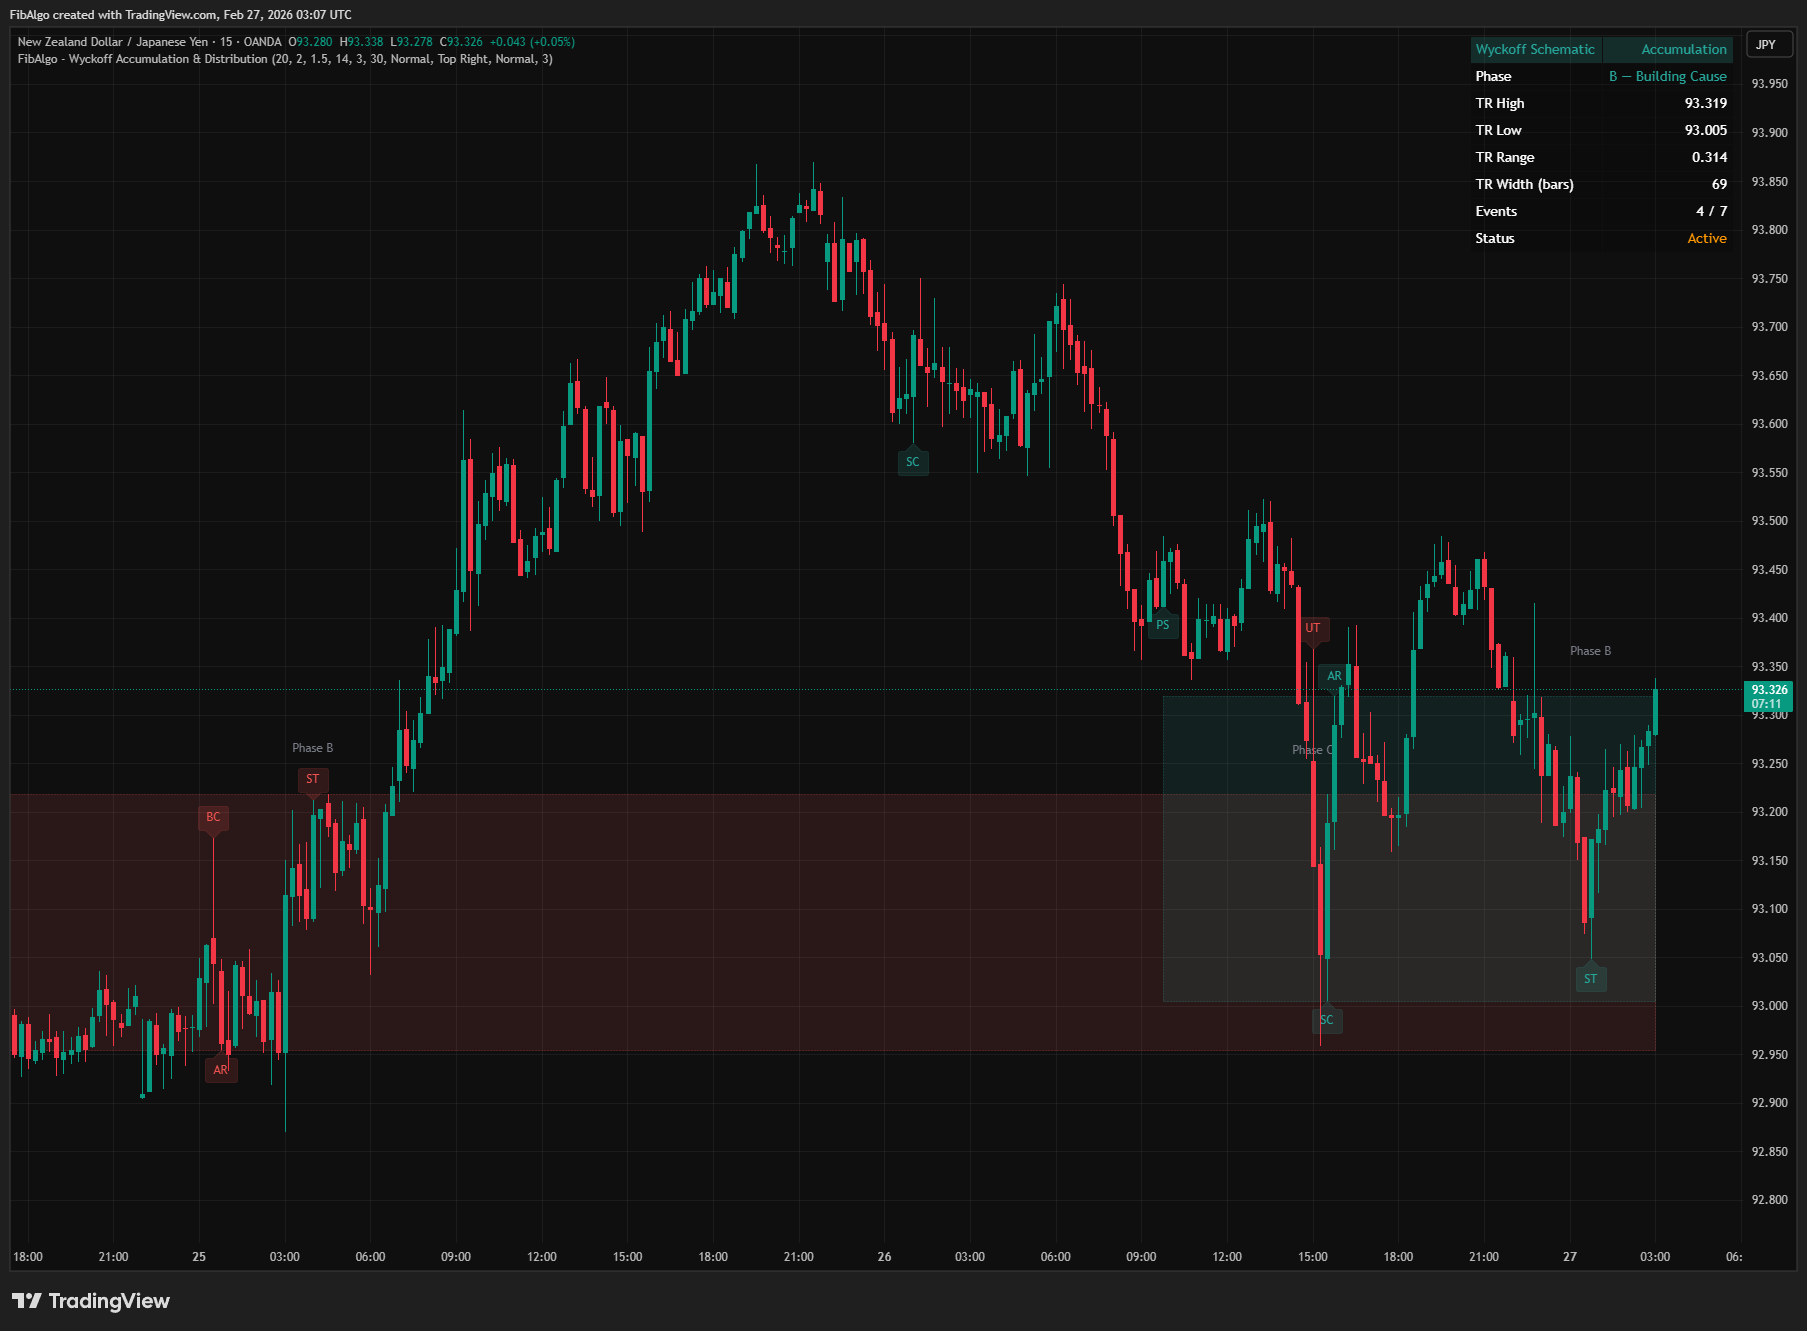
- Upthrust (UT) — Price breaks above TR resistance and reverses back inside. Bull trap that traps breakout buyers. The mirror image of a spring, applied to distribution.
- UTAD (Upthrust After Distribution) — Late-stage upthrust that exceeds previous UT/BC highs. Definitive test of demand — if demand is weak, markdown follows.
- Test of Spring / Test of Upthrust — After a spring or upthrust, price retests the event level with lower volume and narrower spread. Confirms the event's validity.
- Invalidation — If price fails to recover and sustains beyond the event level, the spring or upthrust is invalidated.
How It Works
1. Trading Range Identification The indicator calculates dynamic TR support and resistance using the highest high and lowest low over the user-defined lookback period. A minimum TR width ensures the range has enough history to be meaningful. Additionally, ranges exceeding 8× ATR are filtered out to avoid false signals in trending markets. 2. Spring Detection The indicator scans the most recent bars (up to the Recovery Bar Limit) for a break-and-recover pattern at TR support:- A previous bar's low penetrated below TR support
- The current bar's close recovered back above TR support
- Volume at the break bar classifies the spring type: ≤0.8× average with close in the upper portion of the bar = Type 1, 0.8–1.5× average = Type 2, >1.5× average = Type 3 / Shakeout
- A previous bar's high exceeded TR resistance
- The current bar's close fell back below TR resistance
- If the break exceeds a previous upthrust high, it qualifies as a UTAD
- Test of Spring: price dips toward the spring low with lower volume and narrower spread, but holds above it — confirms demand
- Test of Upthrust: price rallies toward the UT high with lower volume and narrower spread, but fails below it — confirms supply
- If price closes below the spring low (with a margin of 0.5× ATR beyond TR support) within the test window, the spring is marked invalid
- If price closes above the UT high (with a margin of 0.5× ATR beyond TR resistance) within the test window, the upthrust is marked invalid
- After the test window expires, if price is still trading beyond the event level, it is also invalidated
- Confirmed spring: target = TR resistance + 50% of TR range
- Confirmed upthrust: target = TR support − 50% of TR range
Features
- Three Spring Types — Classifies springs by volume (Type 1 low, Type 2 moderate, Type 3 shakeout) following Wyckoff's original volume criteria
- Upthrust & UTAD Detection — Identifies standard upthrusts and late-stage UTADs that break above previous highs
- Test Confirmation — Automatically detects successful tests of springs and upthrusts with volume and spread analysis
- Invalidation Tracking — Marks failed springs and upthrusts when price sustains beyond event levels
- Dynamic TR Detection — Calculates Trading Range support/resistance from recent price action with configurable lookback
- Target Projections — Projects upside/downside targets after confirmed events based on TR range
- Volume Bar Coloring — Colors bars at event detection for quick visual identification
- TR Box Visualization — Draws the Trading Range boundaries at each event for context
- Spring Level Lines — Extends horizontal lines from spring lows and UT highs for reference
- Current TR Lines — Draws solid support and resistance lines for the active Trading Range on the latest bar
- Comprehensive Alert System — Individual alerts for each spring type, upthrust, UTAD, test confirmation, and invalidation
- Info Table — Real-time summary of all event counts, current TR support and resistance
- Full Customization — 39 inputs across 6 groups for colors, toggles, sizes, and detection parameters
How to Use
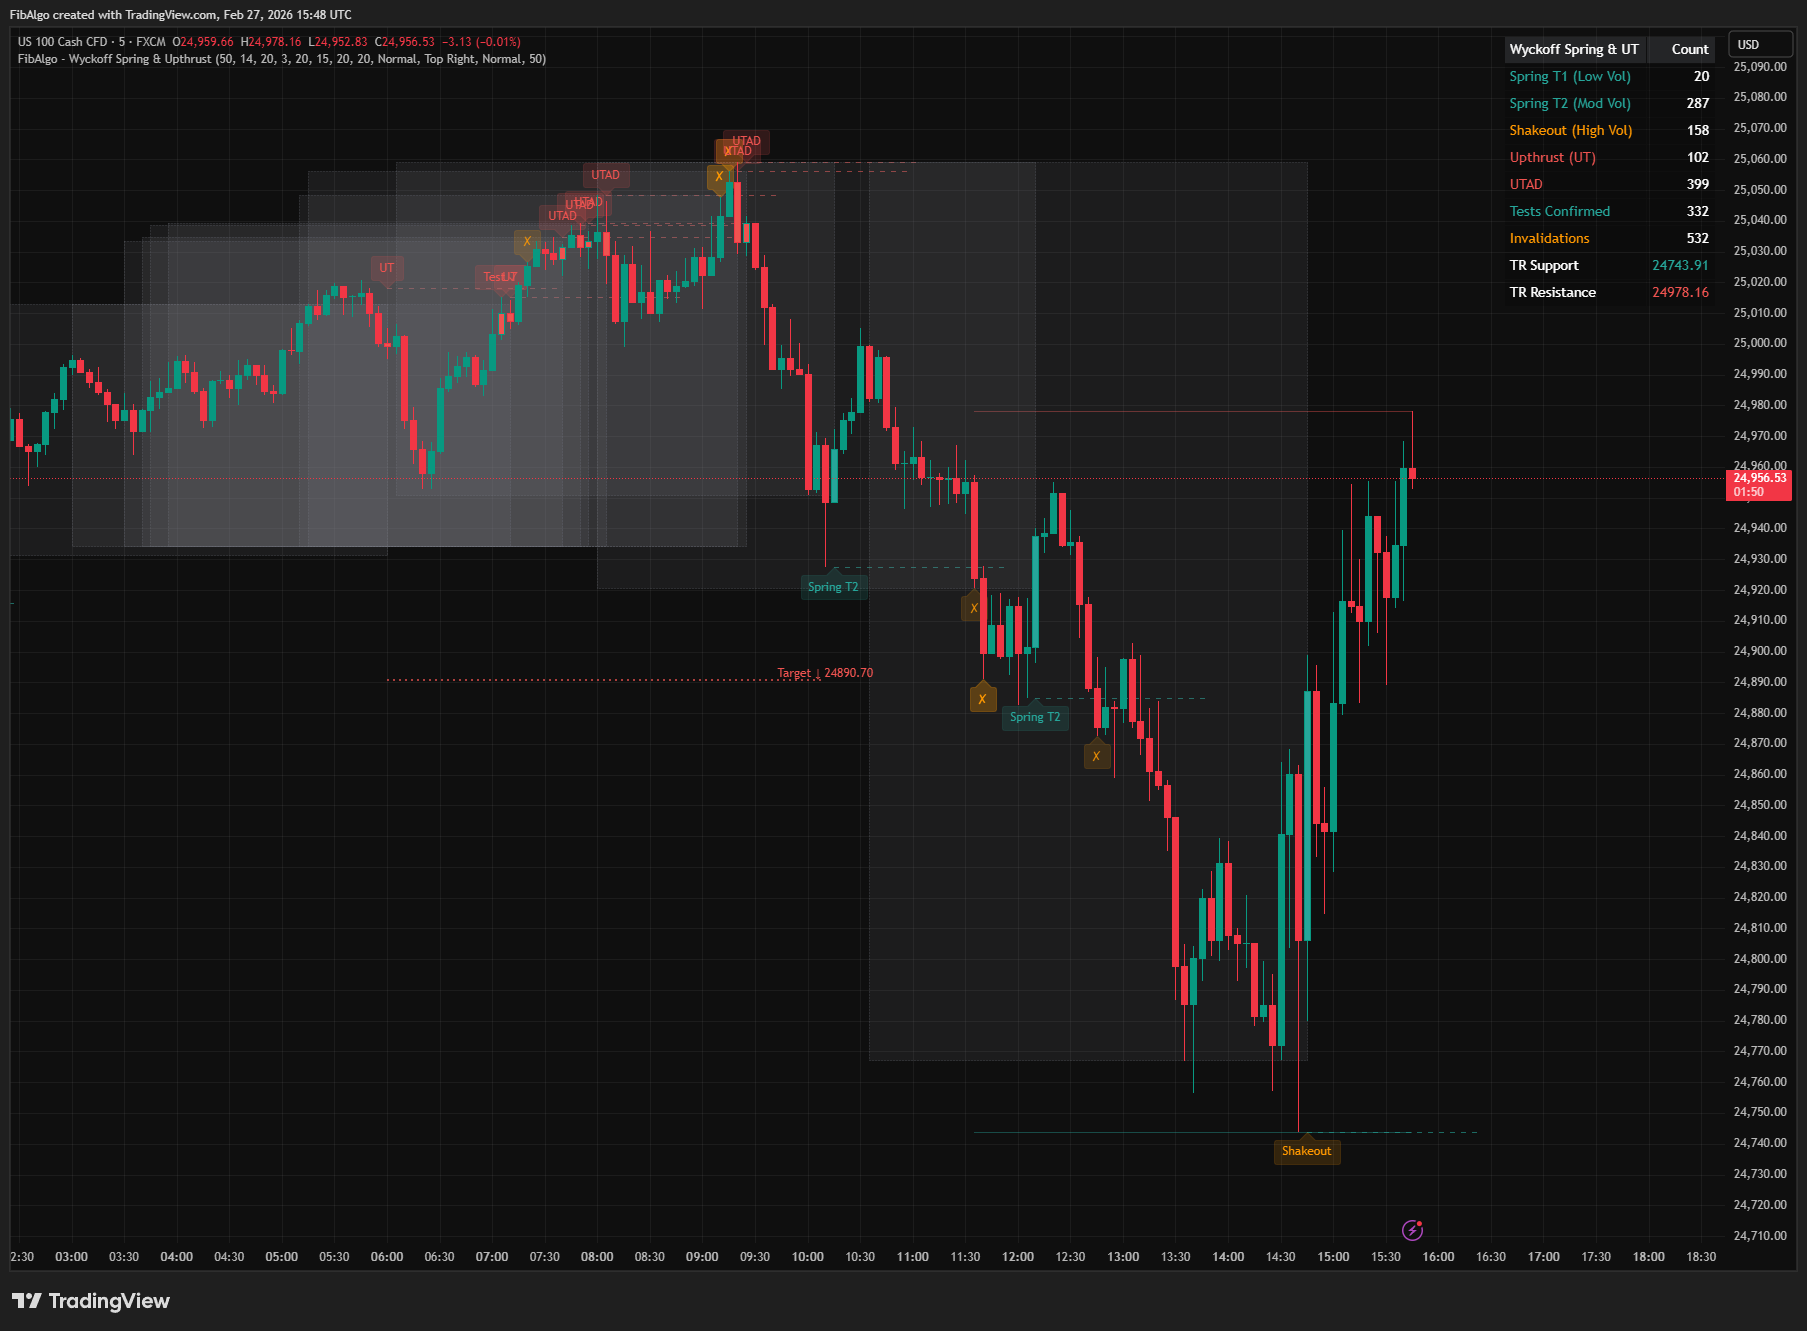
- Add the indicator to your chart. It works best on 5-minute to 1-hour timeframes where Trading Ranges are clearly defined.
- Look for Spring Type 1 (low volume) events near TR support — these have the highest probability of reversal according to Wyckoff.
- Wait for the "Test ✓" label to confirm the event before considering entries.
- Use the target projection line as a potential profit objective.
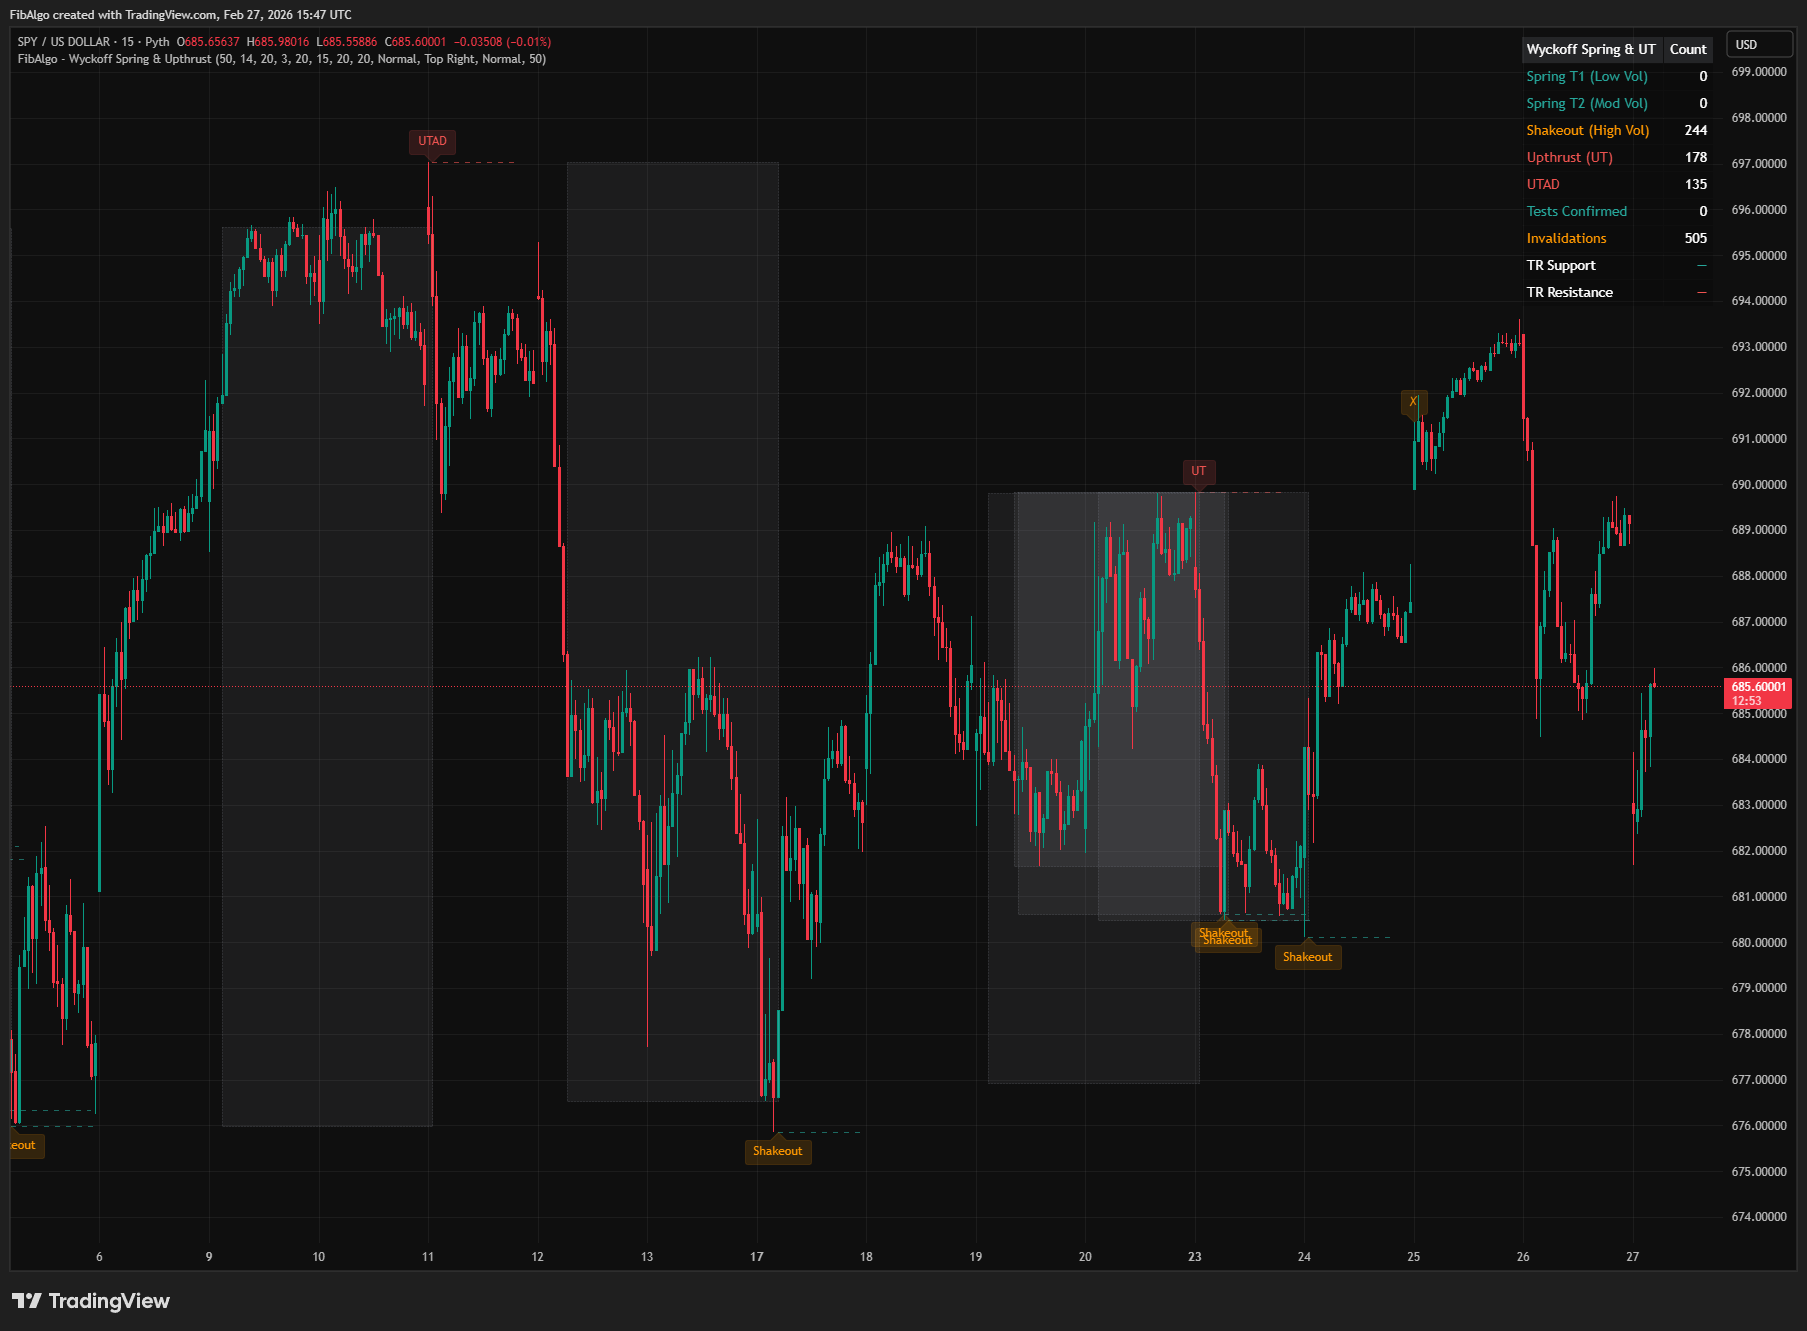
- Watch for "✗" invalidation labels — these indicate the event has failed and the original thesis should be abandoned.
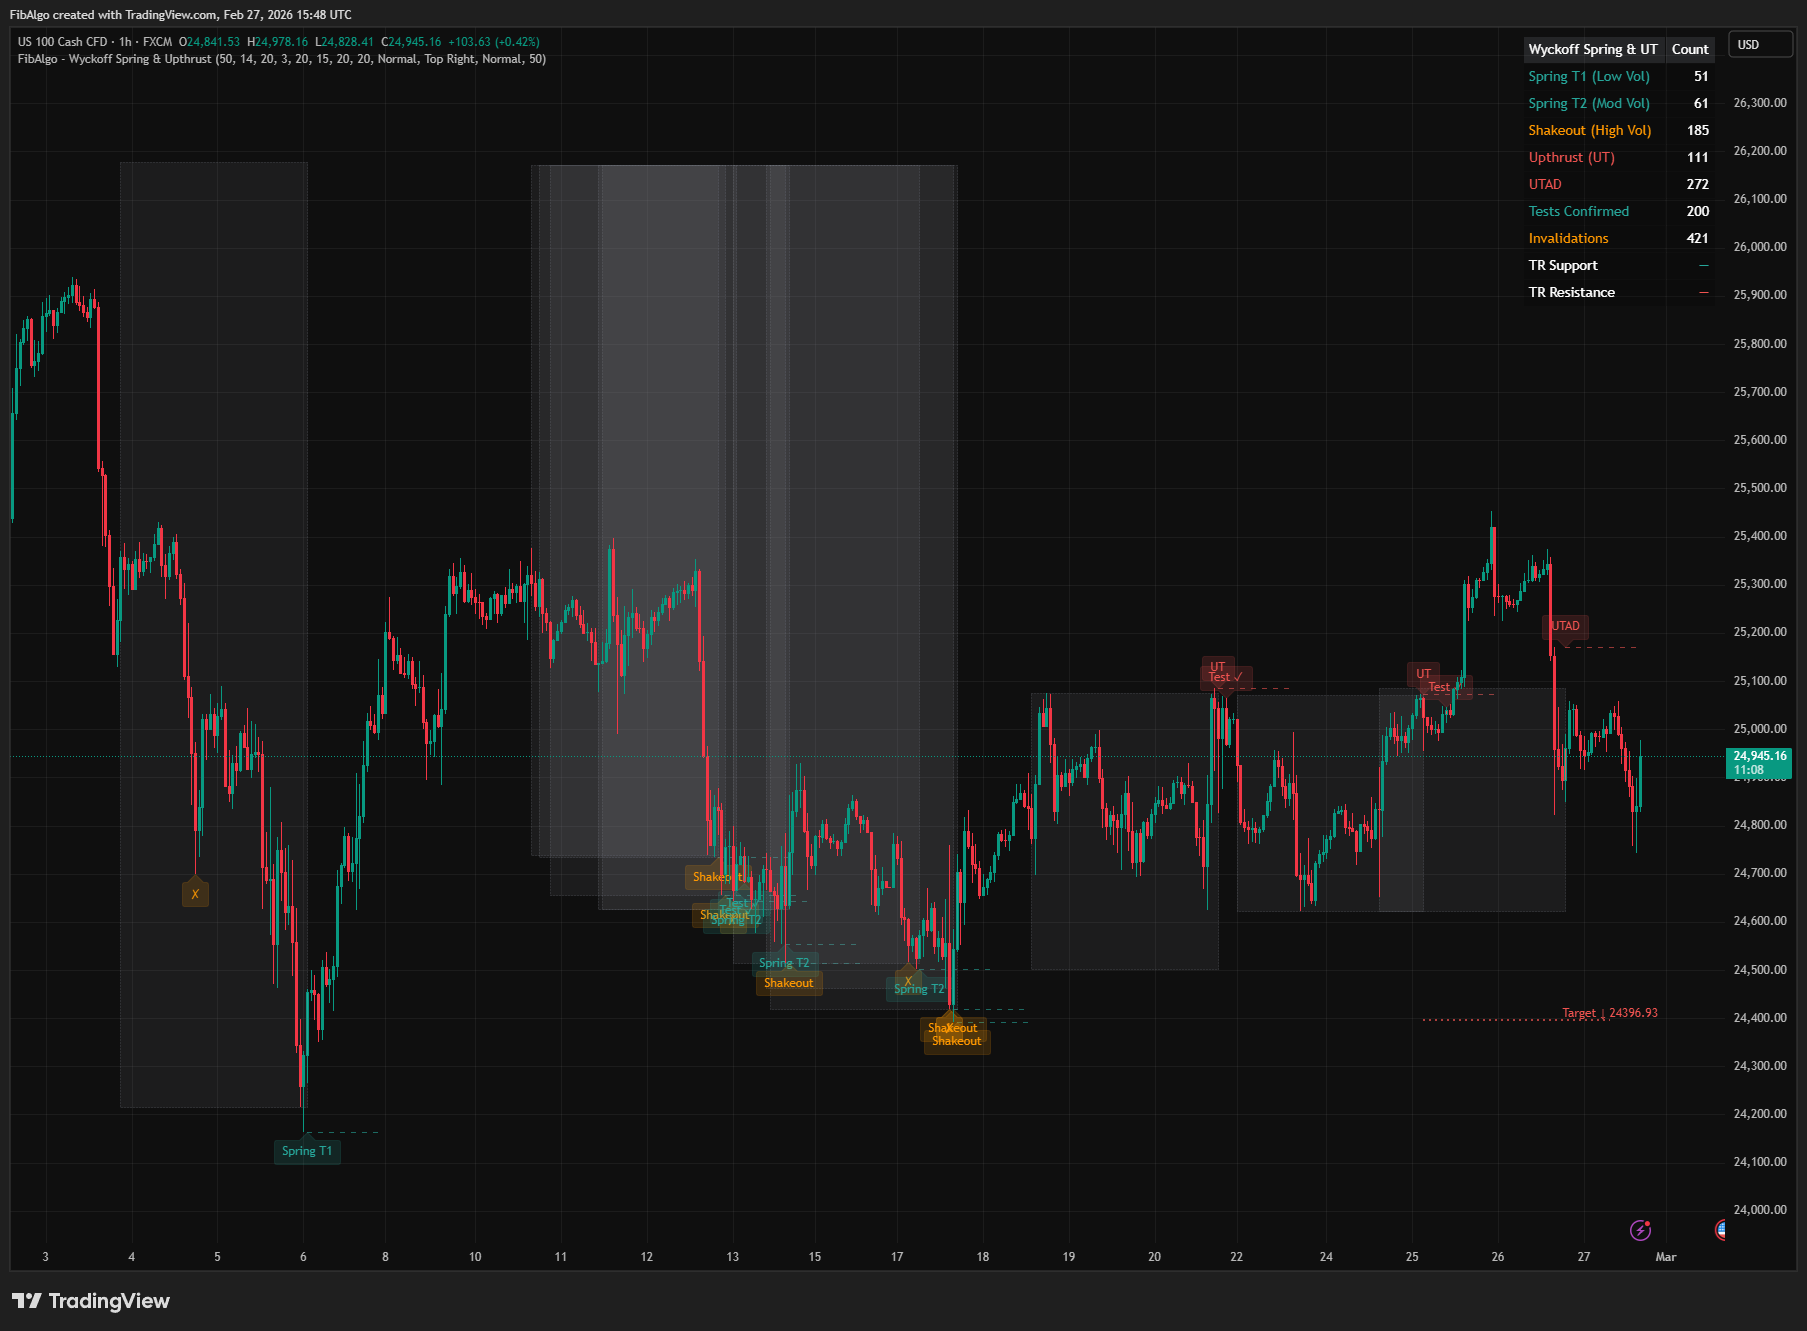
- Spring Type 3 / Shakeout events are aggressive — always wait for a test before acting.
- Upthrusts near TR resistance signal potential distribution — combine with volume analysis for confirmation.
- UTAD events (late-stage upthrusts) are particularly significant — they often precede markdown phases.
- Adjust the TR Lookback Period to match the typical consolidation length for your instrument.
- Set up alerts for your preferred event types to receive real-time notifications.
Limitations
- This indicator does not generate buy or sell signals. It identifies Wyckoff spring and upthrust patterns for educational and analytical purposes.
- Trading Range detection uses a simple highest/lowest approach — complex or irregular TRs may not be captured perfectly.
- Spring and upthrust classification depends on volume data availability. Instruments with unreliable volume data may produce less accurate classifications.
- The Recovery Bar Limit determines how quickly a break must be recovered — very fast or very slow recoveries outside this window will be missed.
- Past pattern detection does not guarantee future price behavior.
- Maximum 500 drawing objects (lines, labels, boxes) are supported by Pine Script.
Tags
#Wyckoff Method#Signals#Volume Based