Overview
FibAlgo - Screener (PEZ) is a multi-symbol companion screener for the FibAlgo - Perfect Entry Zone indicator. It displays a real-time table that monitors up to 10 symbols simultaneously, showing Fibonacci range positions, trend direction, buy/sell zone status, volatility, and trend strength — all from a single chart.
Rather than switching between charts manually, this screener applies a simplified version of the PEZ Fibonacci analysis — zigzag pivot detection, Fibonacci range positioning, and zone activity detection — across multiple symbols and timeframes, presenting the results in a customizable dashboard table.
Multi-Symbol Fibonacci Scanning
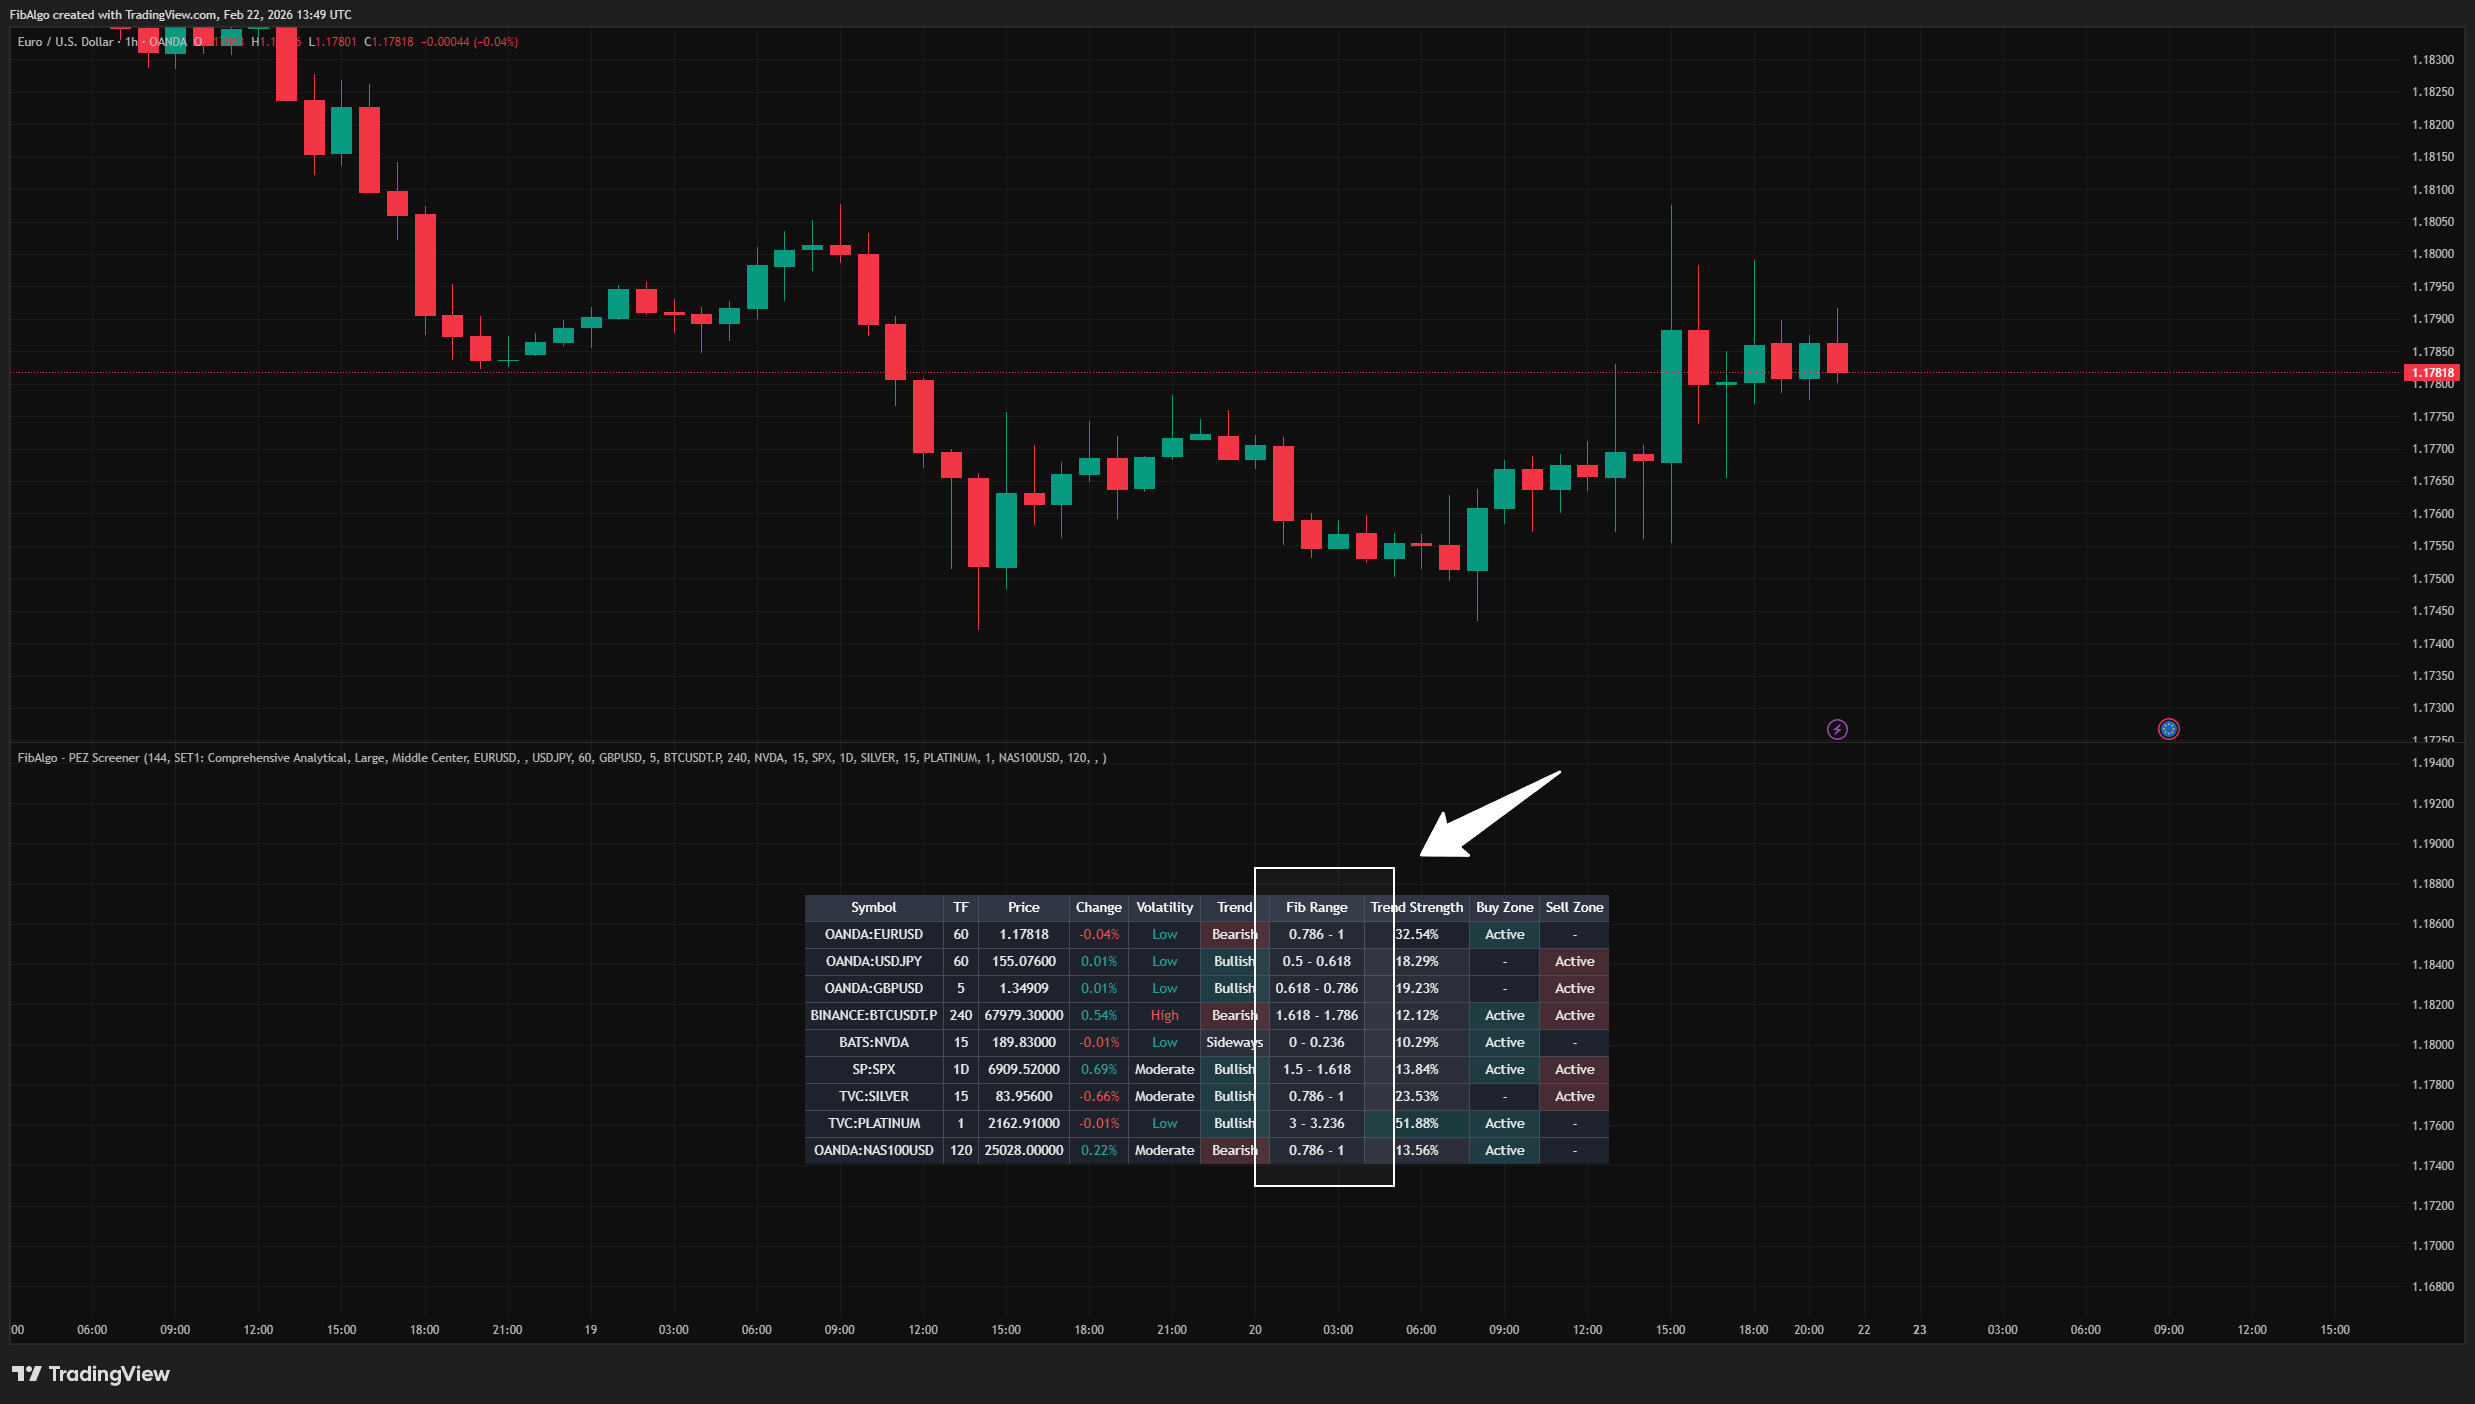
The screener applies zigzag pivot detection and Fibonacci range analysis to each symbol independently via request.security(). For every symbol, the system identifies the most recent pivot structure (A → B pivots), determines the current Fibonacci range the price sits within, and calculates whether a buy or sell zone is active.
Zone Activity Logic
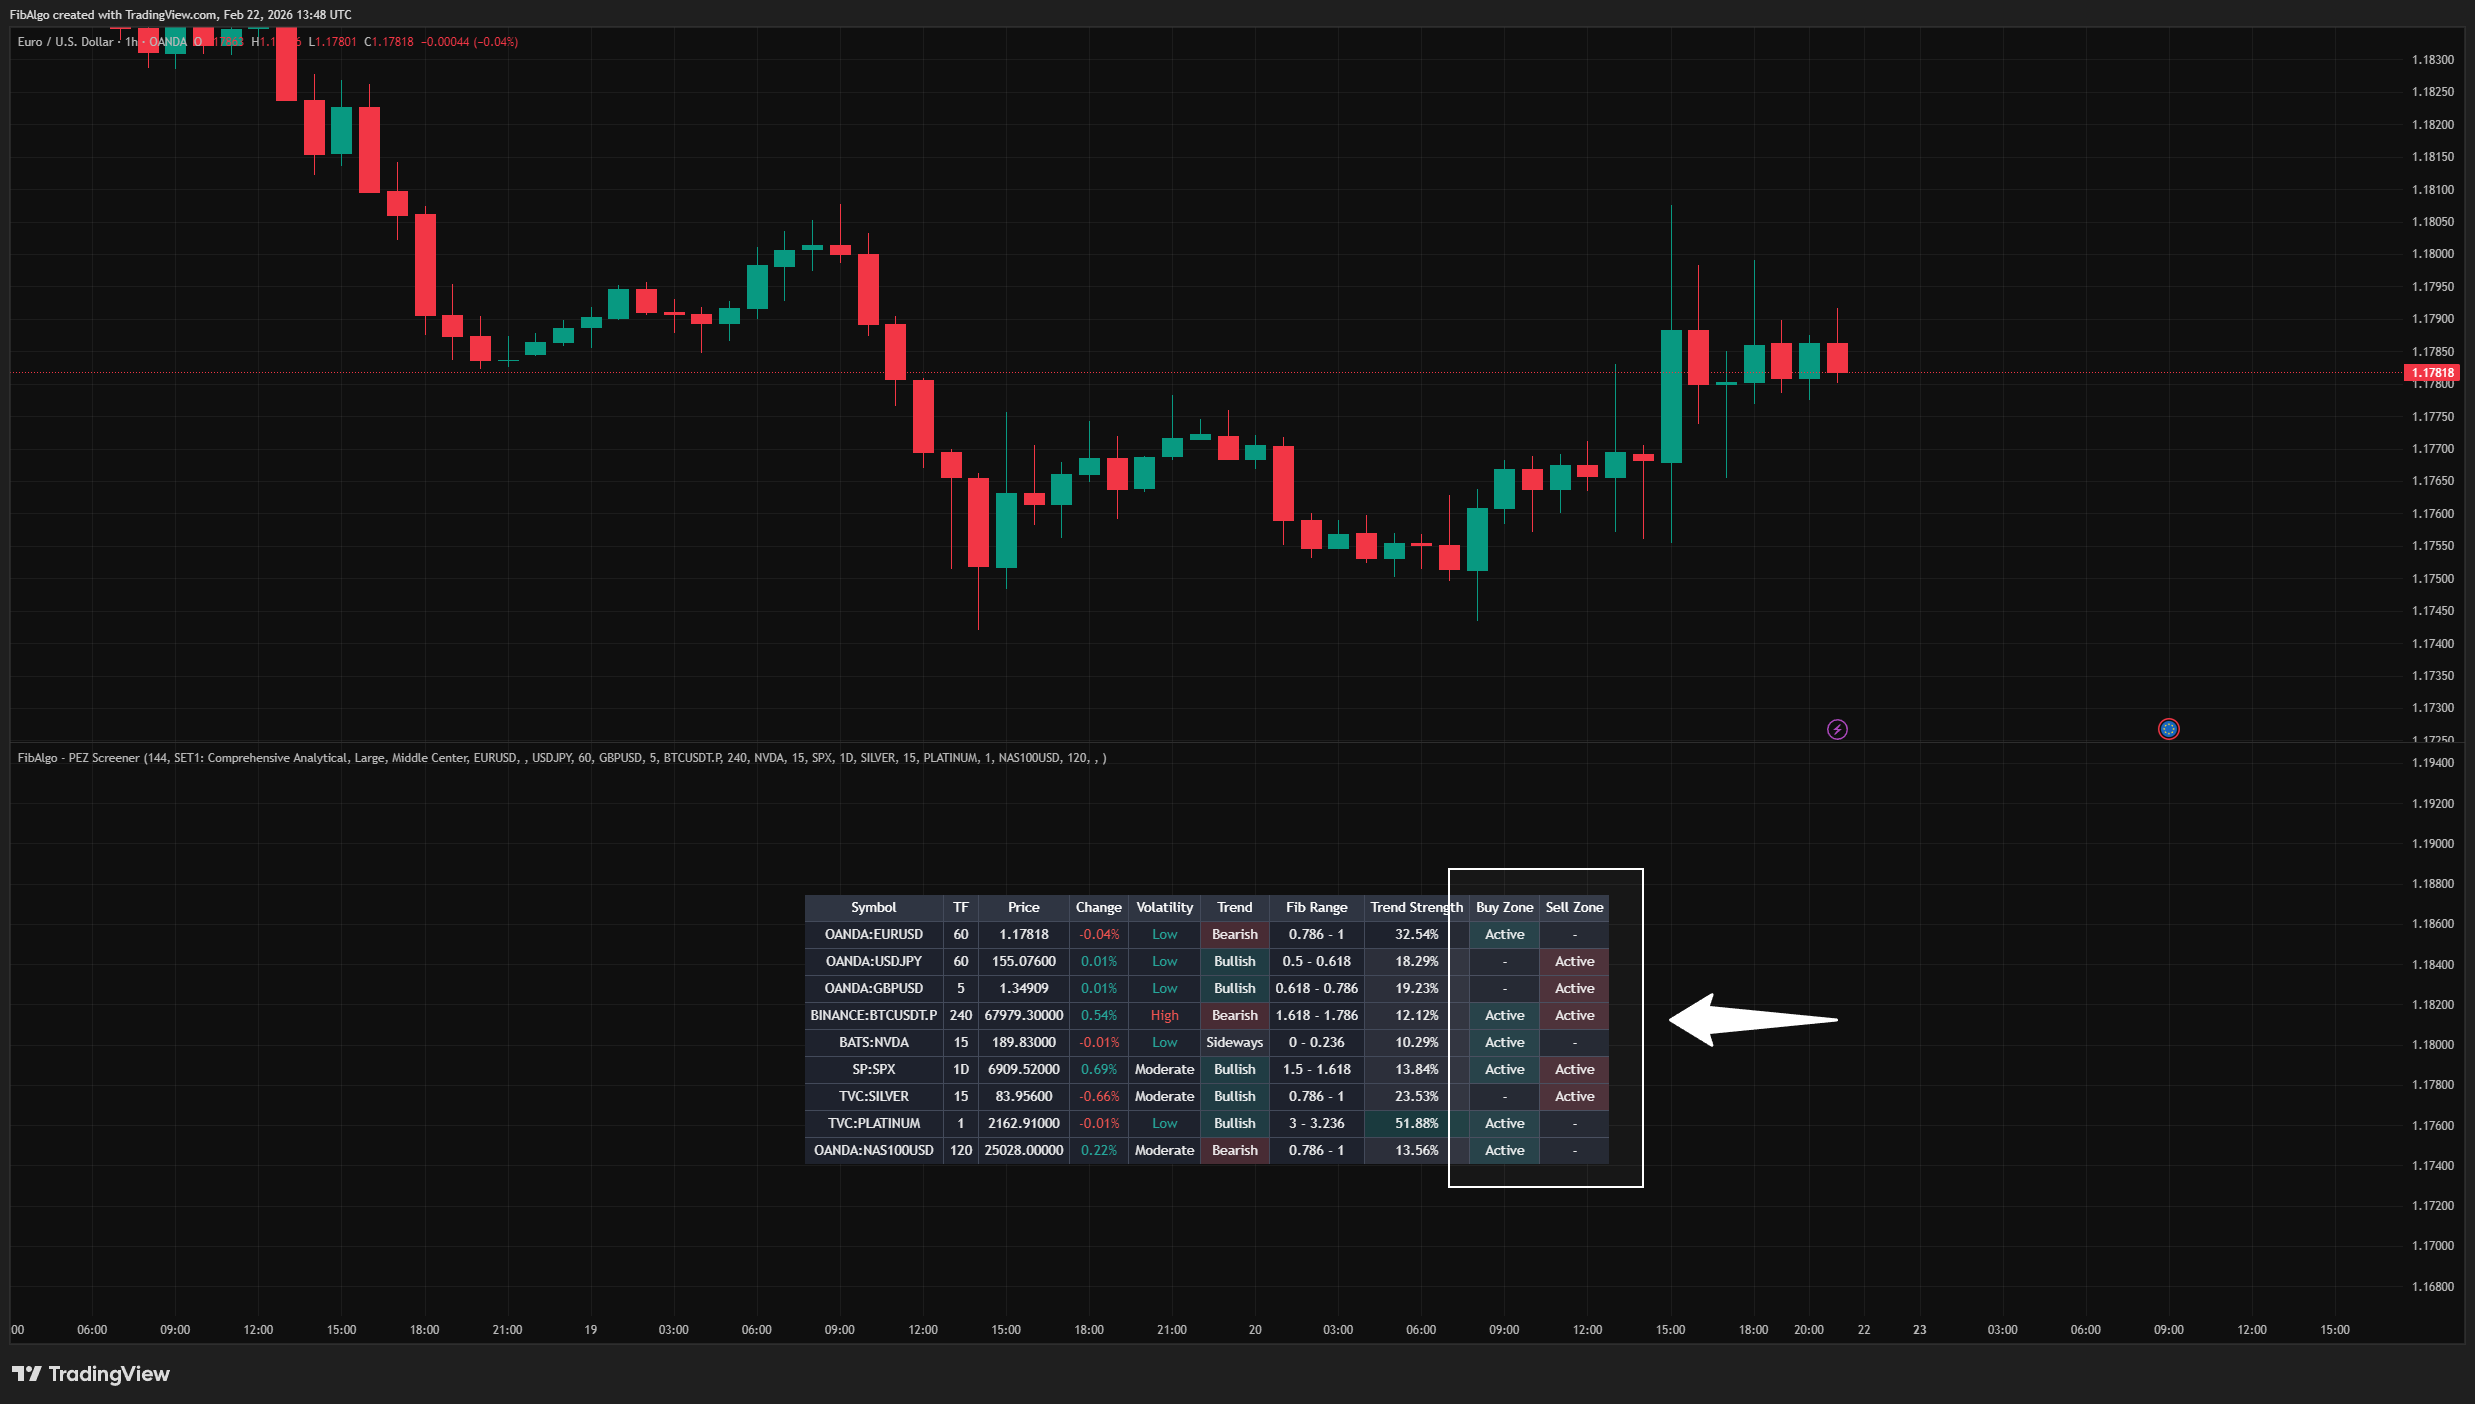
For each scanned symbol, the screener determines zone status based on the current Fibonacci level position and pivot direction:
- When the last pivot is a Peak High (uptrend) and the Fib level is below 3.0, a Buy Zone is flagged as Active.
- When the last pivot is a Peak High and the Fib level is above 1.0, a Sell Zone is flagged as Active.
- The logic inverts for Peak Low (downtrend) pivots.
This allows quick identification of symbols that are currently sitting in potential entry areas.
Trend and Volatility Context
Each symbol row also includes:
- Trend Direction — Determined by comparing the current close to the midpoint of the A and B pivots. Bullish if price is above midpoint in a downtrend structure, Bearish if below midpoint in an uptrend structure, Sideways otherwise.
- Trend Strength (ADX) — The Average Directional Index value, indicating how strong the current trend is regardless of direction.
- Volatility — ATR as a percentage of price, classified as Low, Moderate, or High based on configurable thresholds.
Step 1 — Symbol Configuration
The user adds up to 10 symbols with individual timeframe selections. Each empty symbol slot is automatically skipped. If no timeframe is specified, the chart's current timeframe is used.
Step 2 — Data Retrieval
For each active symbol, the screener calls request.security() with the full PEZ calculation function. This computes the zigzag, pivot structure, Fibonacci range, trend direction, ADX, volatility, and zone status on the target symbol's timeframe.
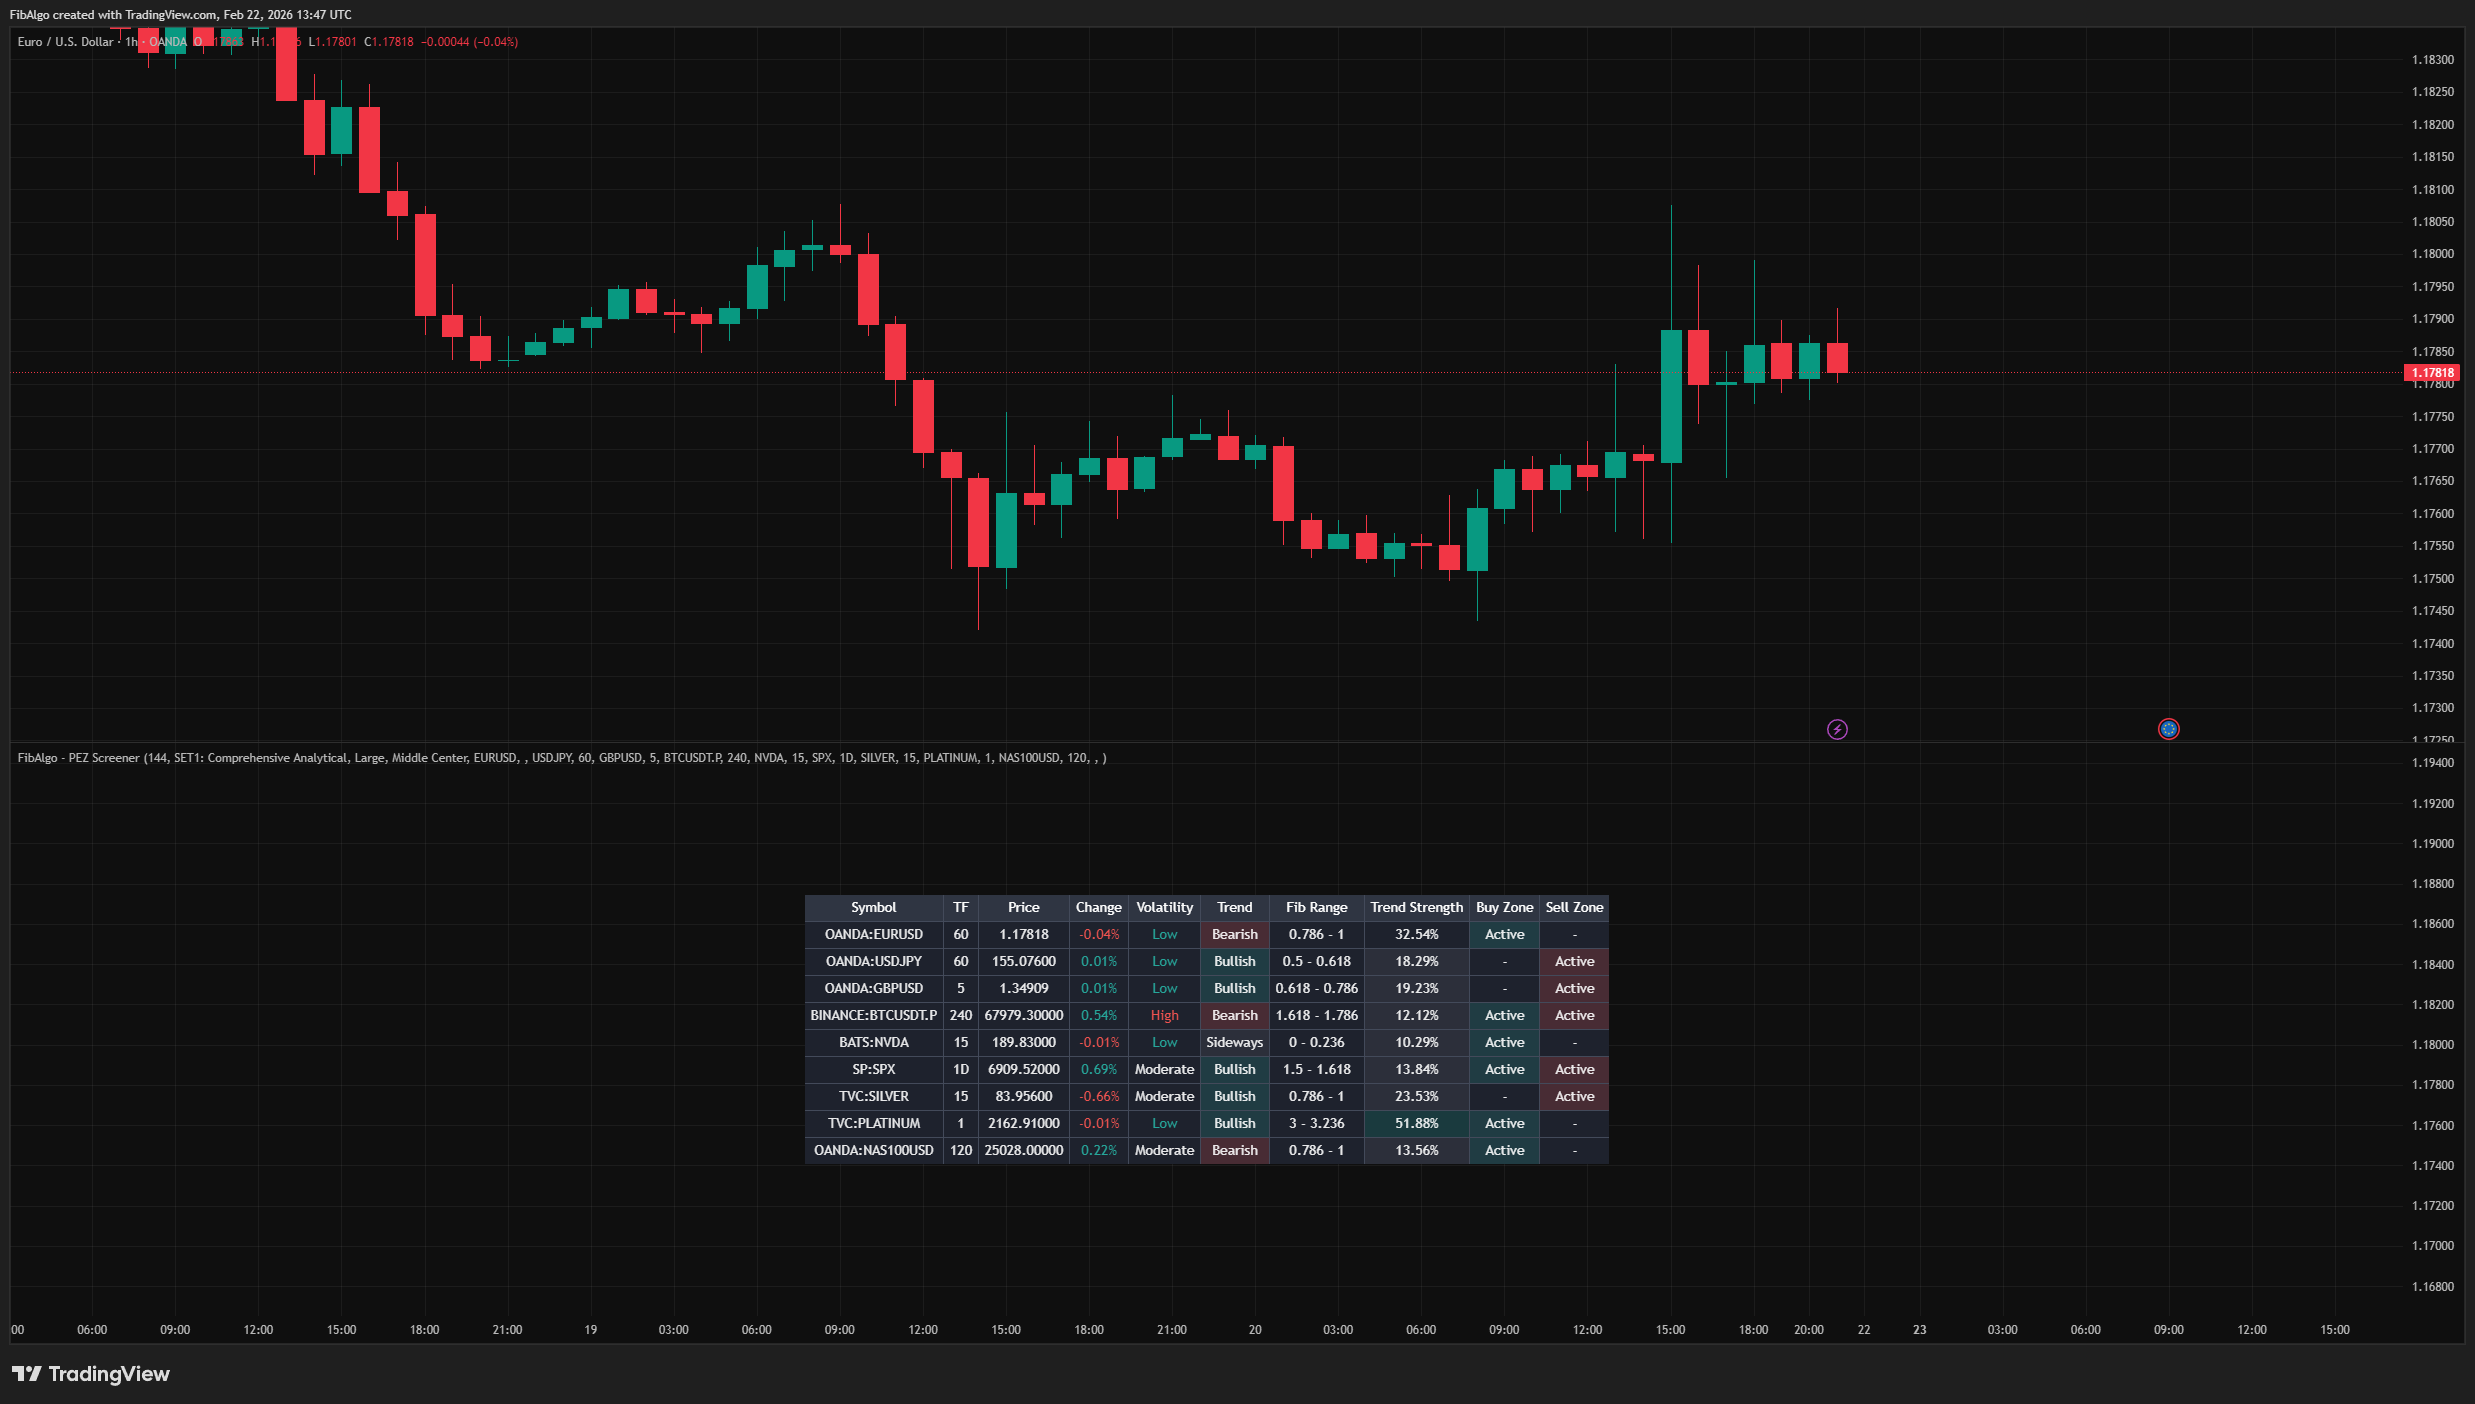
Step 3 — Table Rendering
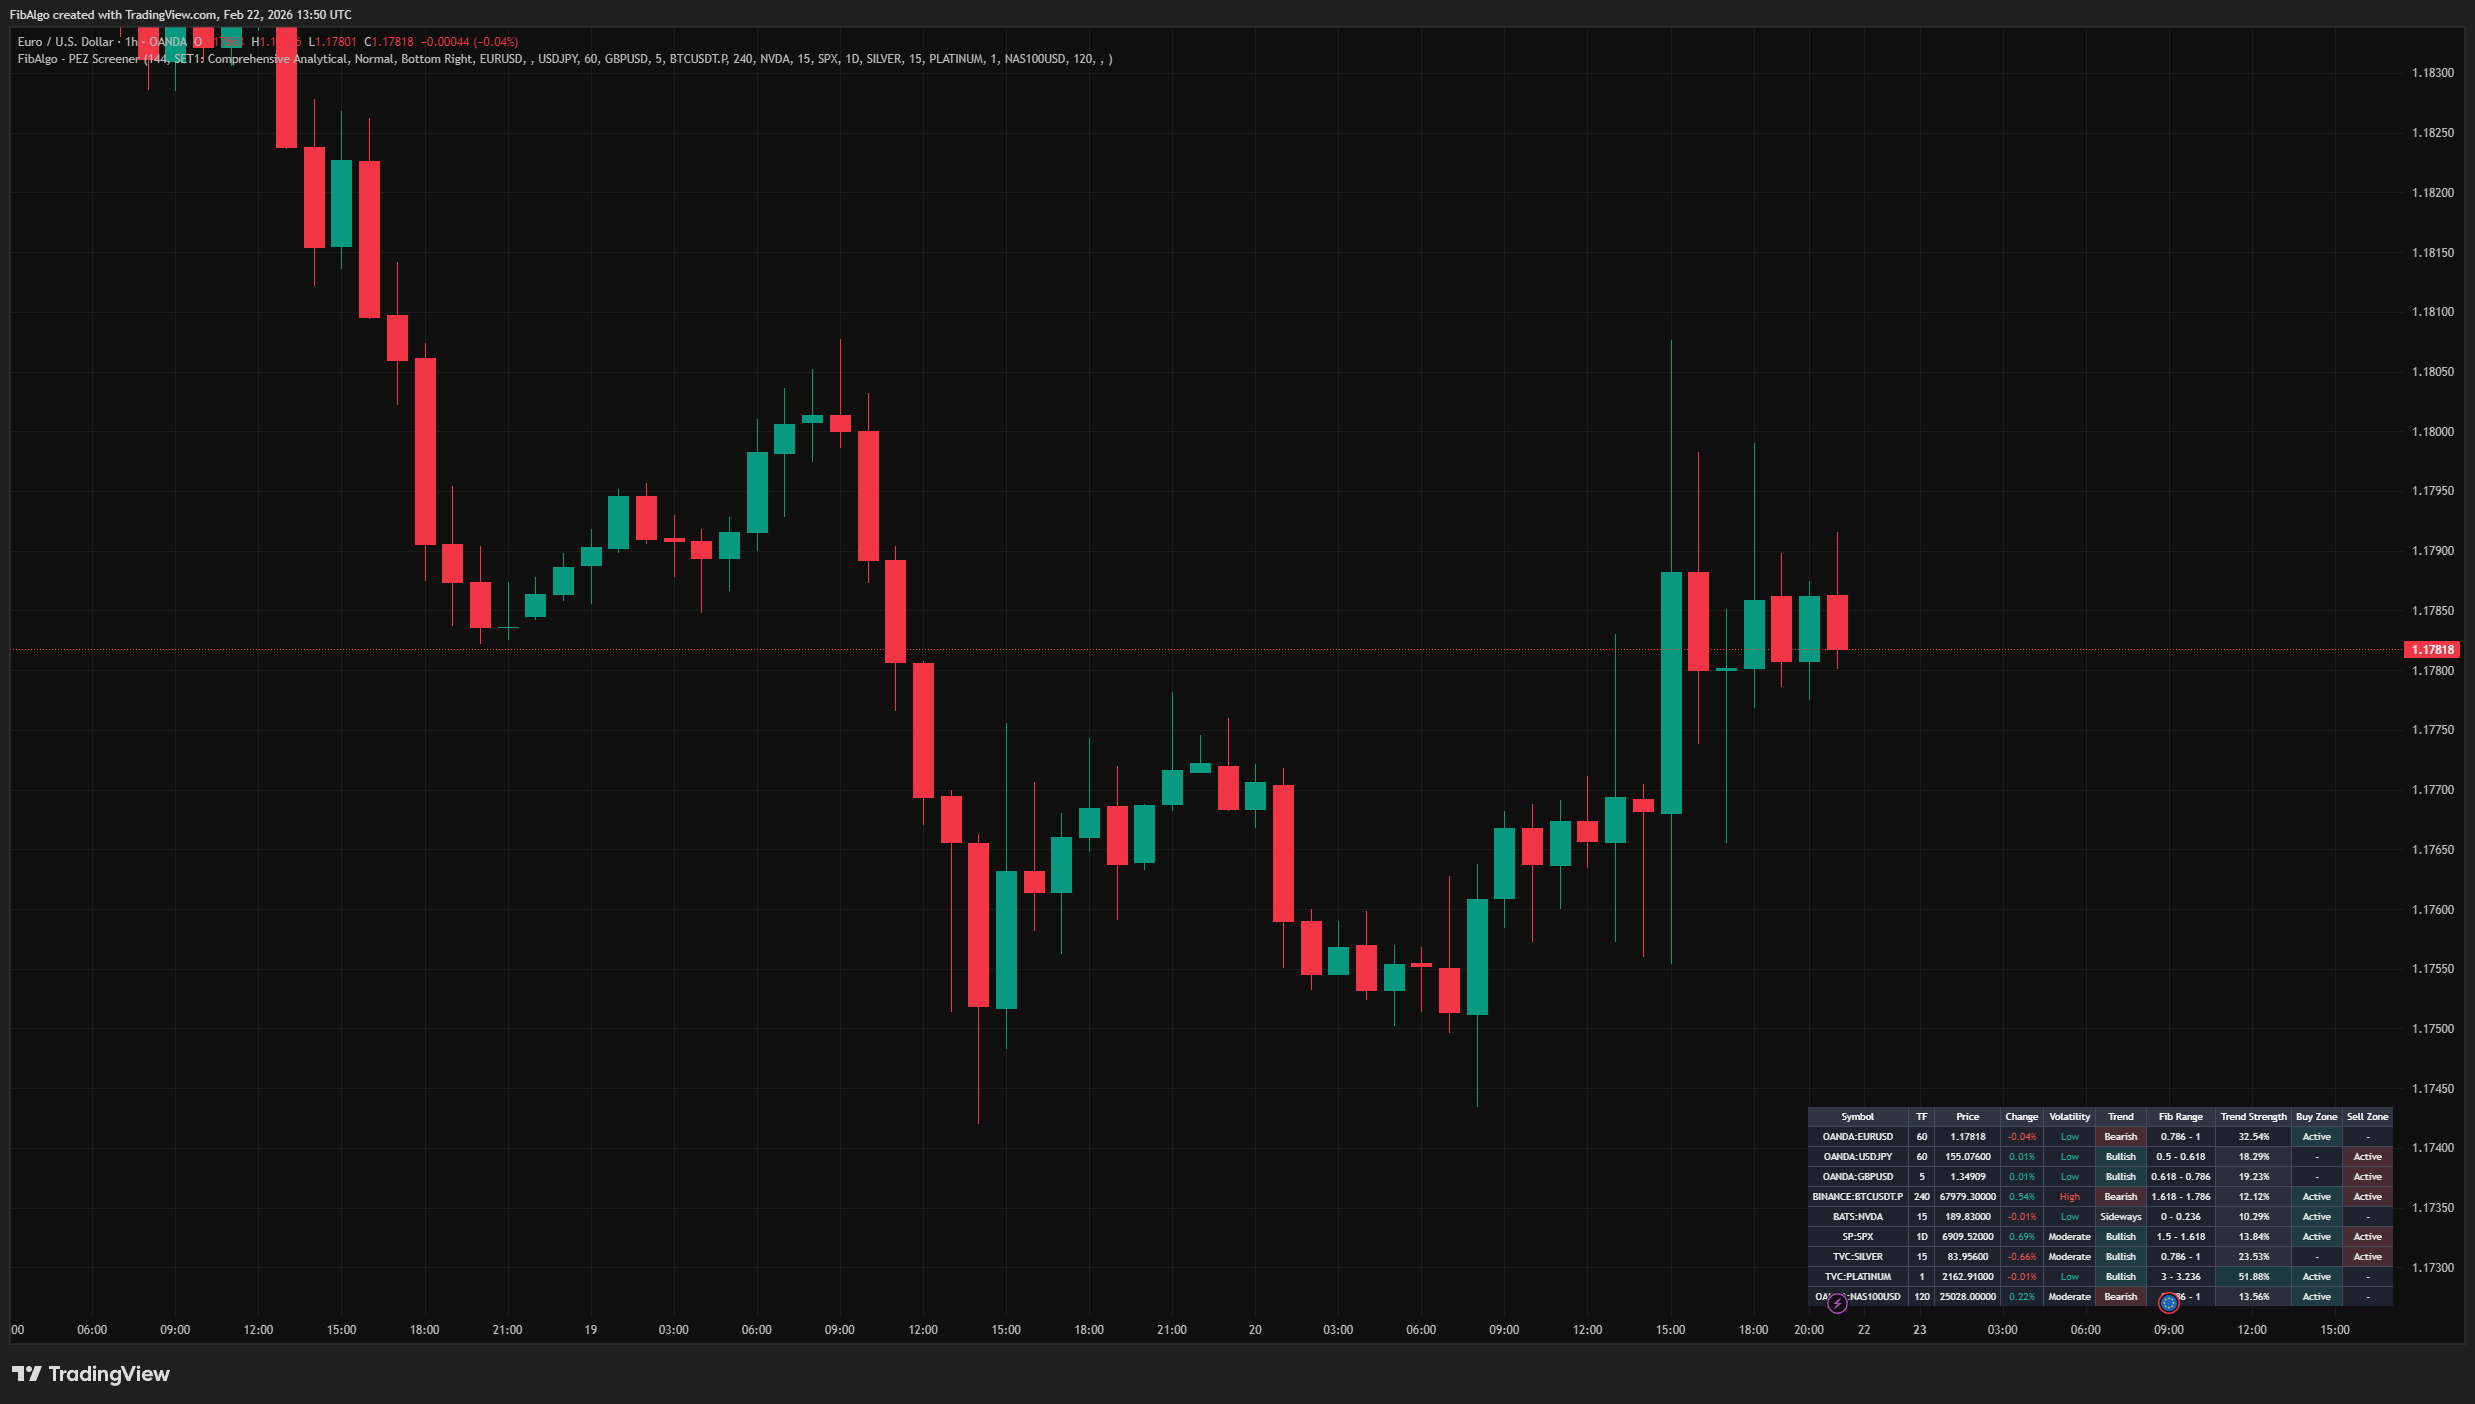
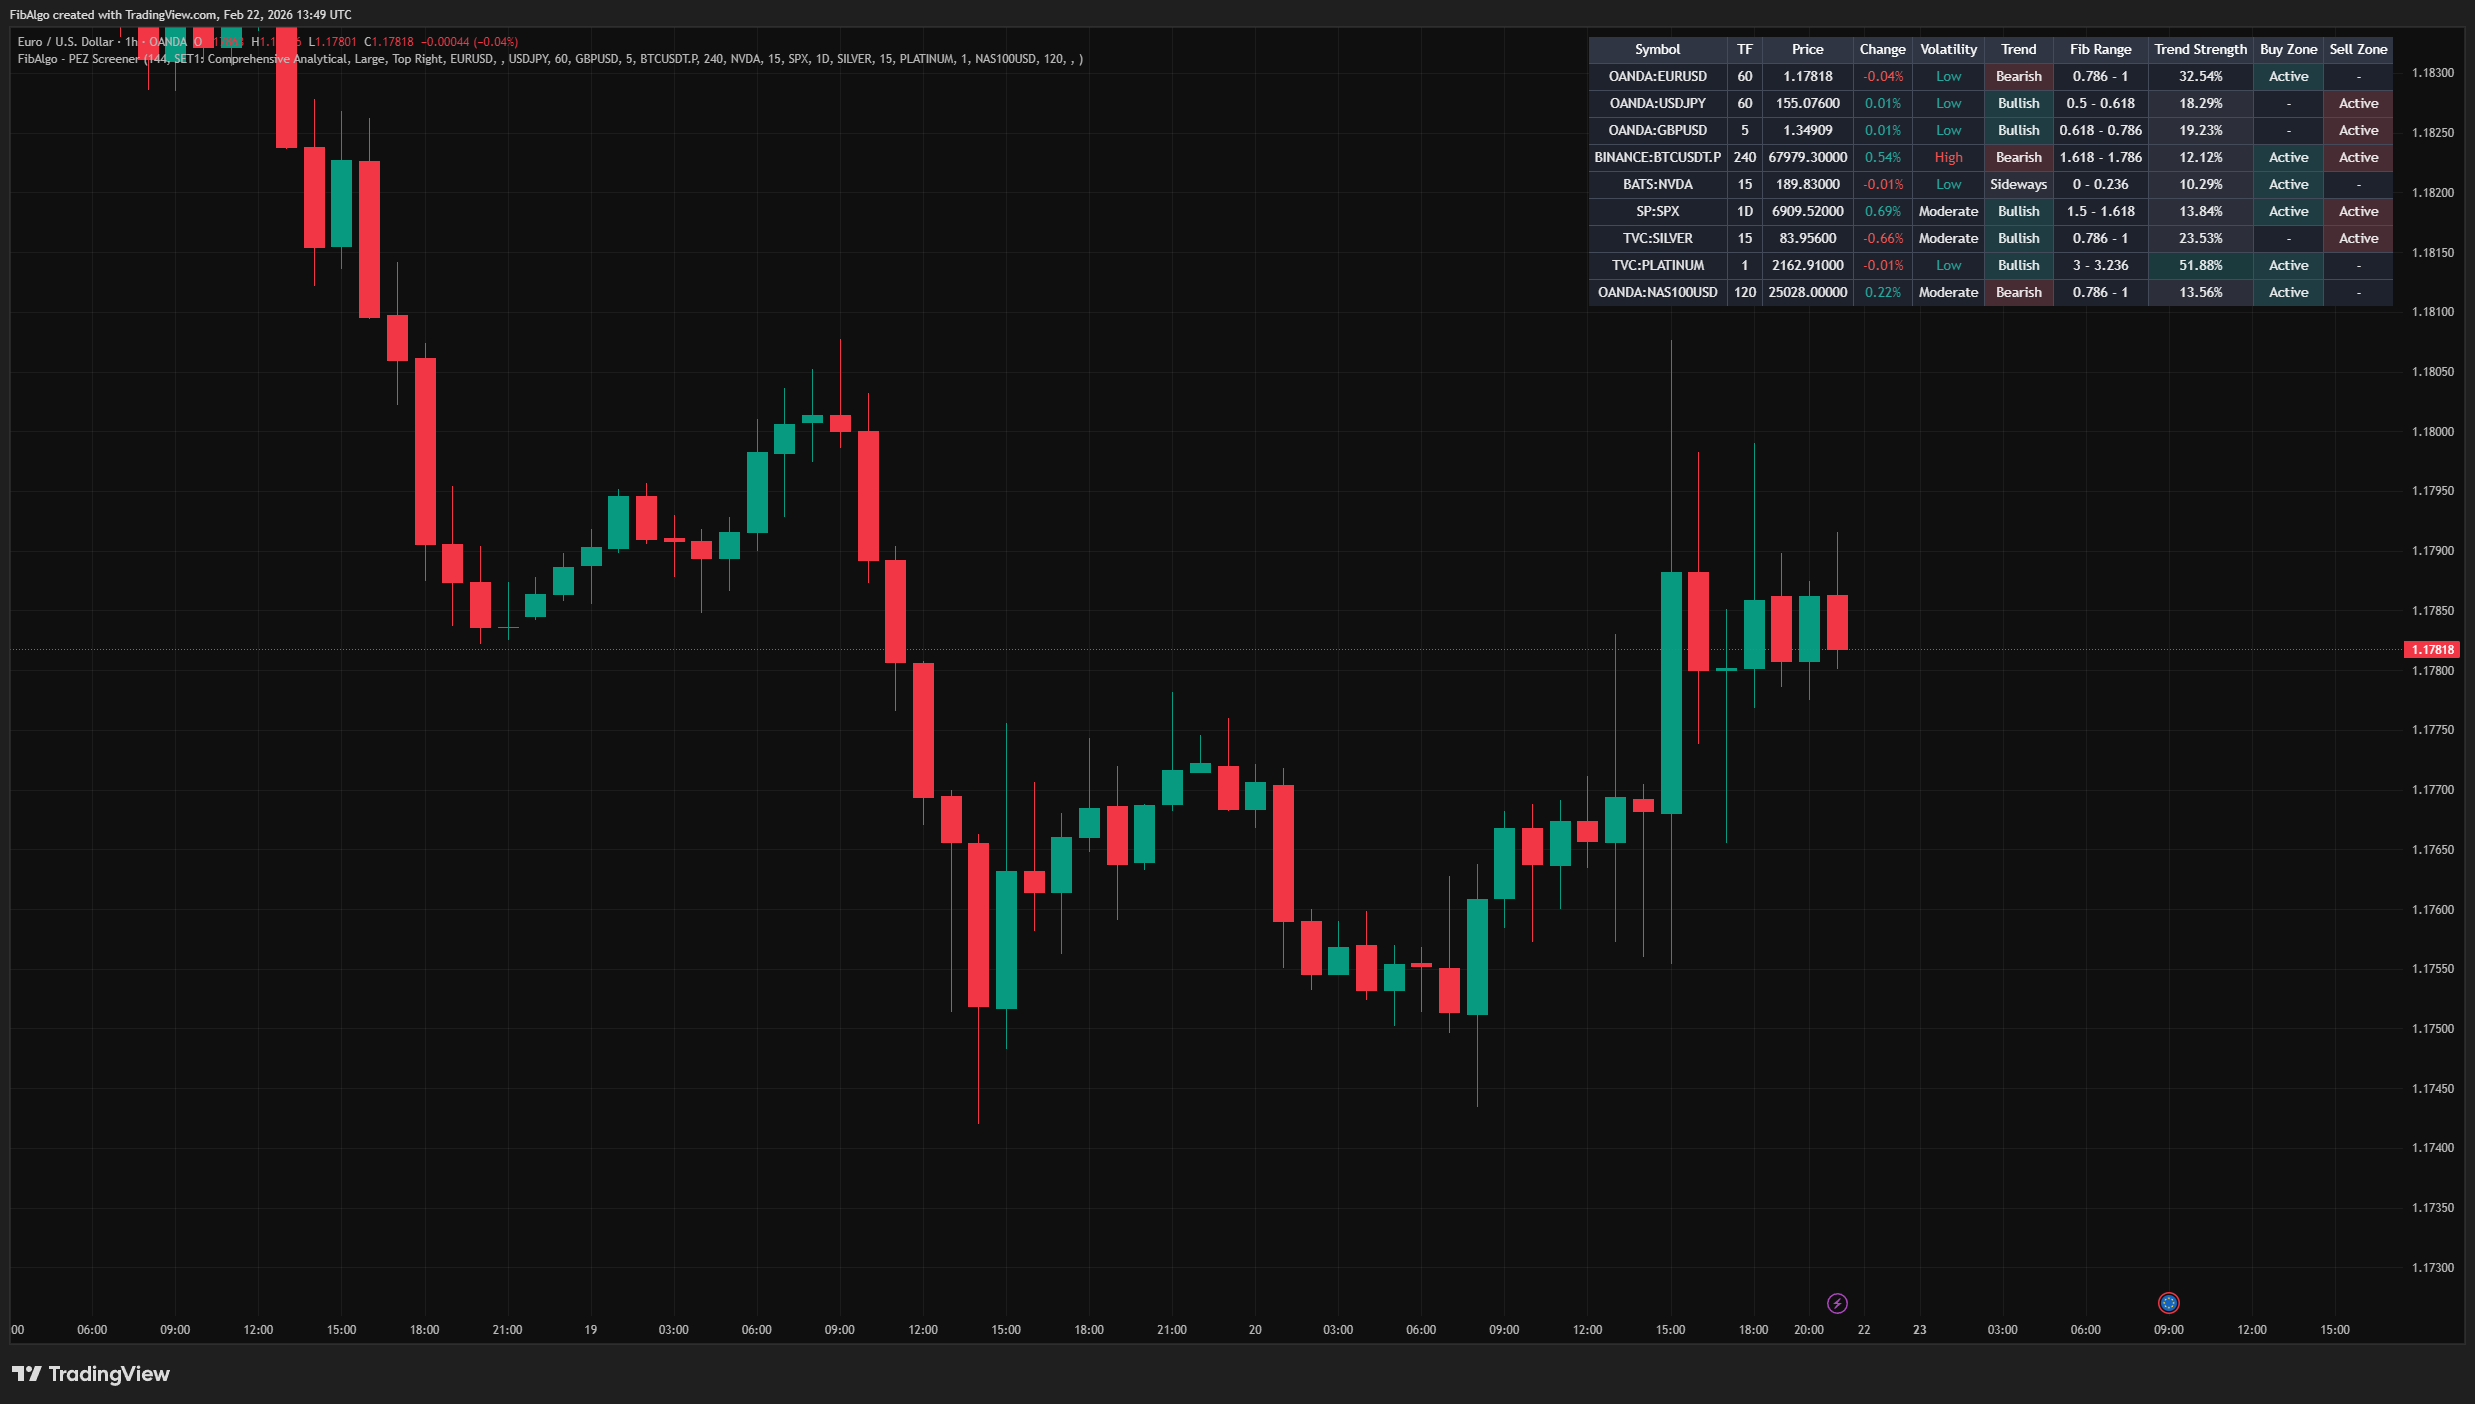
Results are displayed in a color-coded table:
- Green text for positive price changes, red for negative.
- Green background for active Buy Zones, red for active Sell Zones.
- Trend column background: green for Bullish, red for Bearish, gray for Sideways.
- Trend Strength background highlights strong trends (ADX > 50).
Multi-Symbol Dashboard
- Monitor up to 10 symbols simultaneously from a single chart.
- Individual timeframe selection for each symbol.
- Automatic detection of active symbols — empty slots are skipped.
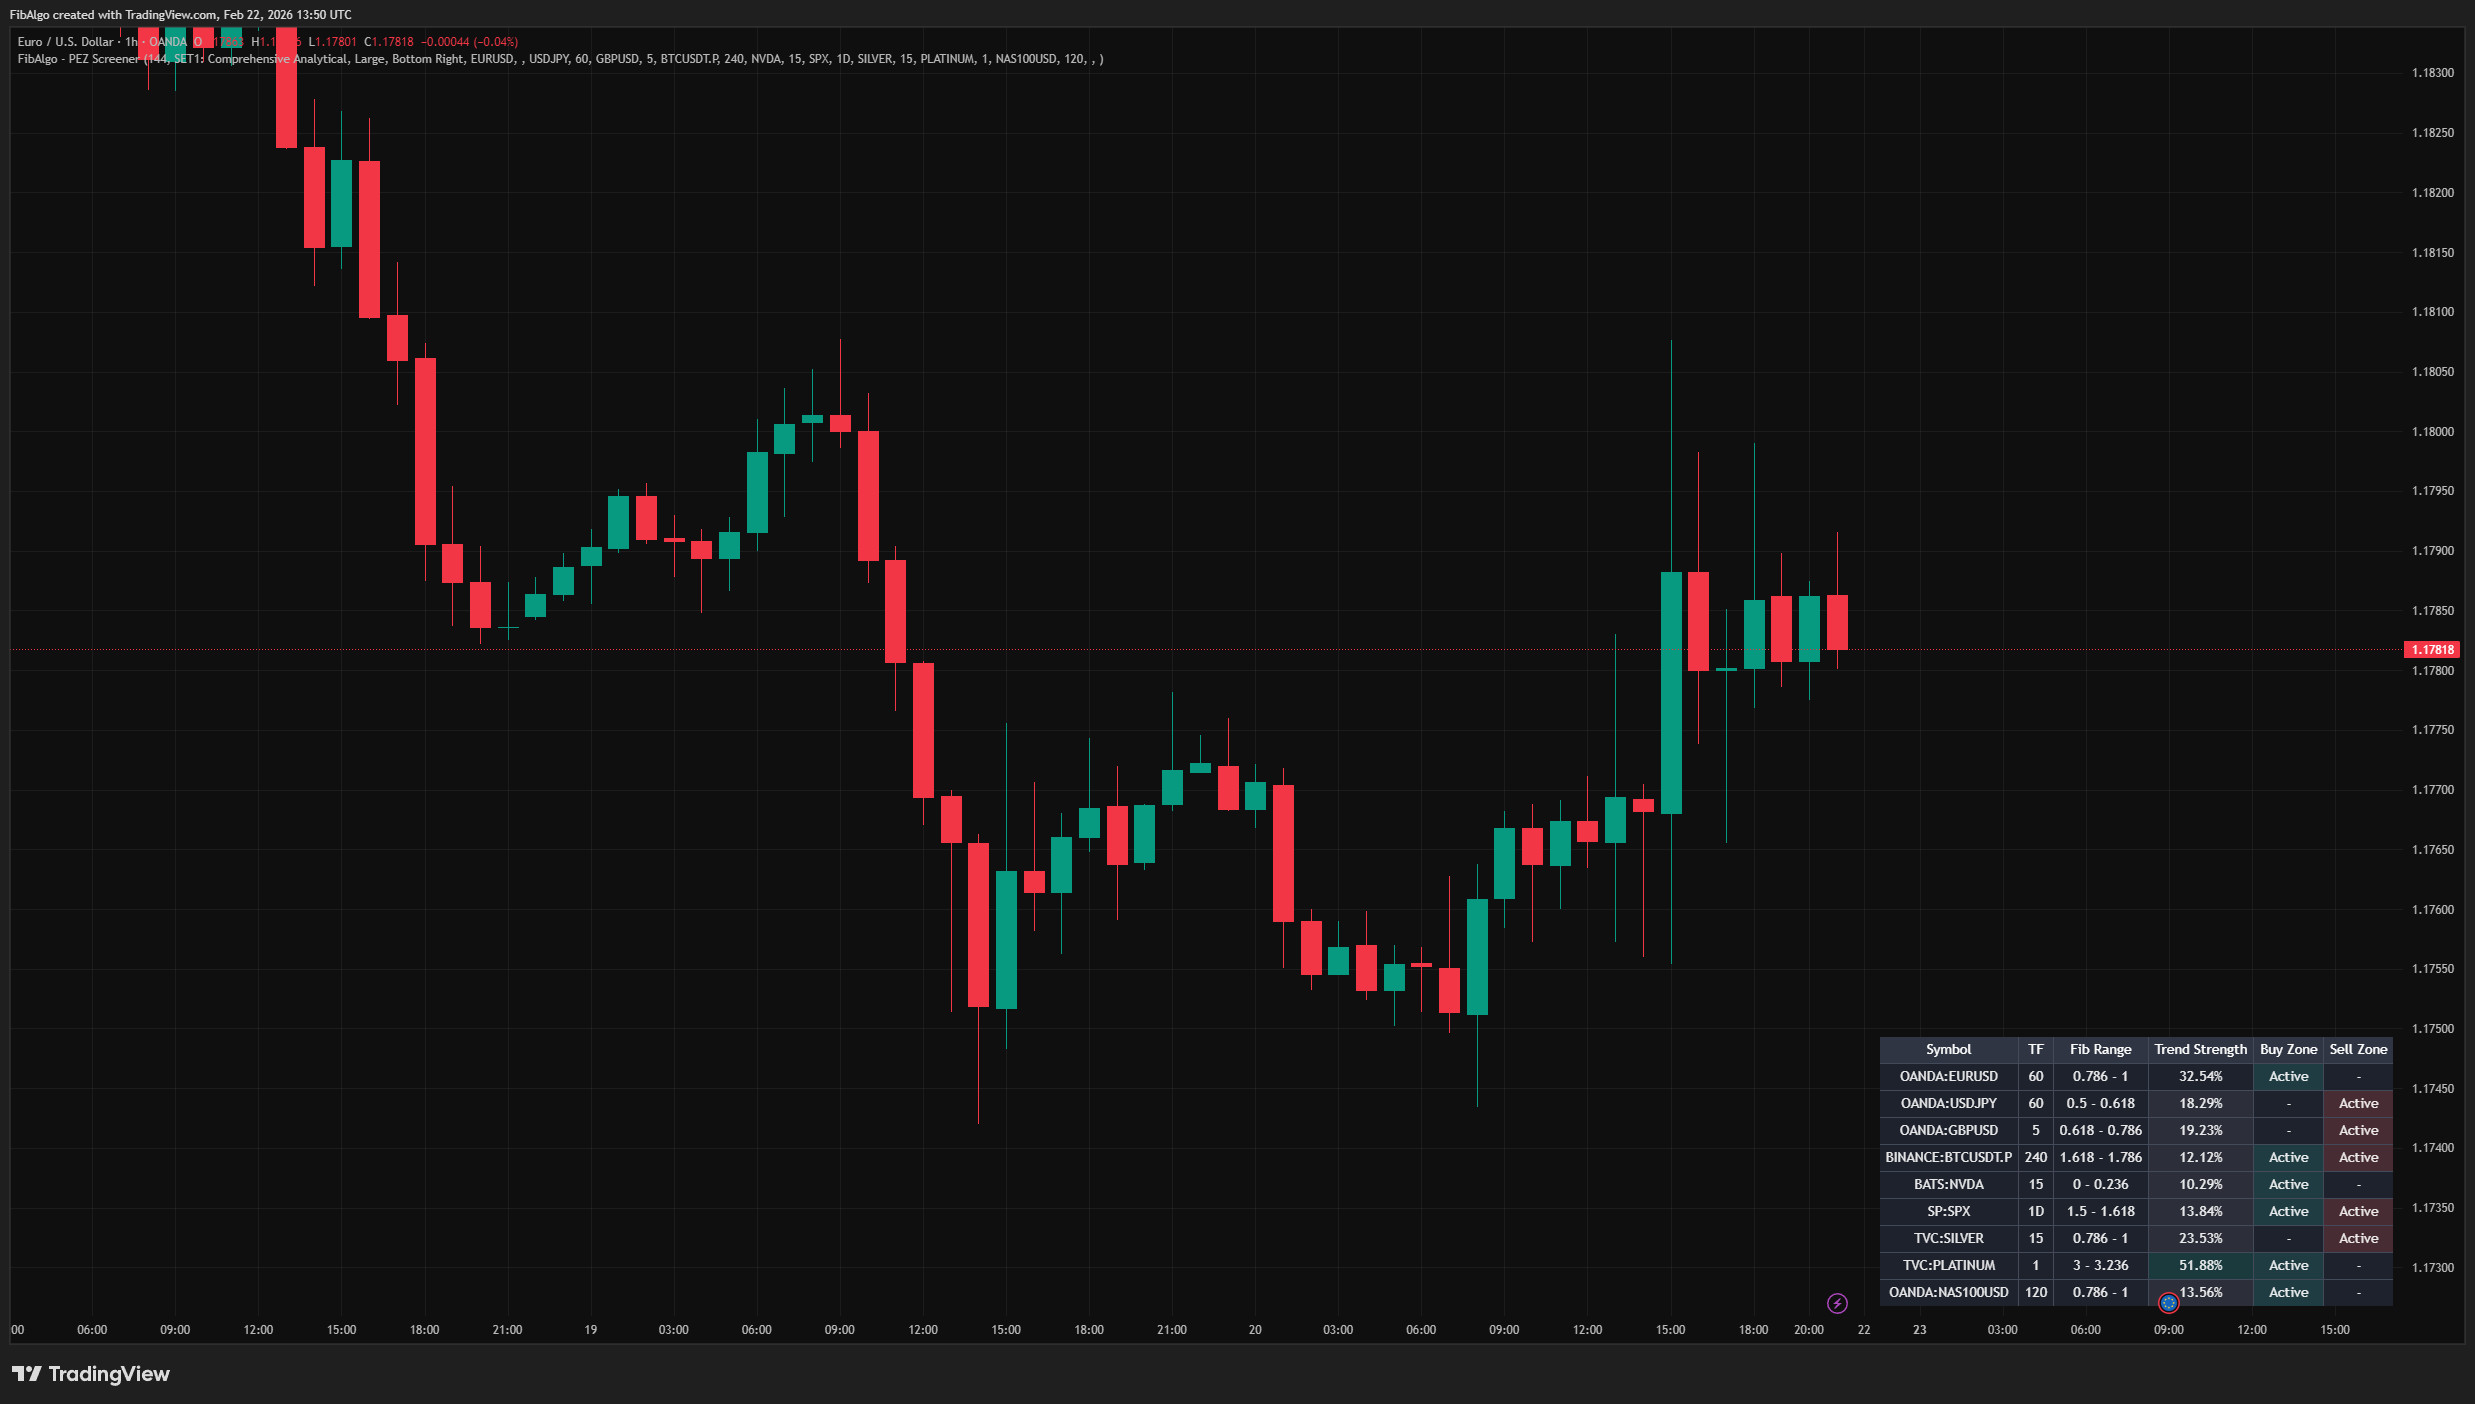
Customizable Table Layout
- 10 individually toggleable columns (Symbol, TF, Price, Change, Volatility, Trend, Fib Range, Trend Strength, Buy Zone, Sell Zone).
- Three table size options (Small, Normal, Large).
- Nine table position options (any corner, center, or edge).
Four Fibonacci Analysis Sets
- SET1: Comprehensive Analytical — 25 levels including deep extensions up to 4.0.
- SET2: Advanced Harmonic — Harmonic pattern ratios (0.886, 1.130, 1.272, etc.).
- SET3: Standard Trend — Classic Fibonacci levels for trending markets.
- SET4: Universal Standard — Minimal set focusing on the most significant ratios.
Real-Time Color Coding
- Buy/Sell zone activity highlighted with green/red backgrounds.
- Trend direction color-coded per row.
- Price change and volatility with contextual coloring.
- Strong trend highlighting for ADX values above 50.
Getting Started
Add the screener to any chart. Open the indicator settings and add your desired symbols in the "Symbol List" section. Each symbol has its own timeframe selector — leave it empty to use the chart's current timeframe.
Reading the Table
- Fib Range — Shows which Fibonacci level range the price currently occupies (e.g., "0.618 - 0.786").
- Buy Zone / Sell Zone — "Active" means the symbol is currently in a potential entry area based on its Fibonacci position.
- Trend — Bullish, Bearish, or Sideways based on price relative to the pivot midpoint.
- Trend Strength — ADX percentage. Values above 25 suggest a trending market, above 50 a strong trend.
- Volatility — Low, Moderate, or High based on ATR relative to price.
Suggested Workflow
1. Add the symbols you regularly trade or monitor.
2. Scan the table for symbols showing "Active" in the Buy Zone or Sell Zone columns. 3. Check the Trend and Trend Strength columns for additional context — an active zone aligned with a strong trend may warrant closer examination on the full chart. 4. Switch to the symbol's chart and apply the main indicator for detailed zone analysis, including confidence scores, repeat counts, and zone flip states. 5. Use the Volatility column as additional context when comparing symbols.- This screener is a monitoring tool, not a trading system. It does not generate buy/sell orders.
- The screener uses request.security() for each symbol. TradingView limits the number of security calls per indicator. With 10 symbols and 8 data fields each, the indicator approaches these limits.
- Zone activity is a simplified representation of the full PEZ indicator's zone logic. For detailed confidence scores, repeat counts, and zone flip states, use the main indicator on the specific symbol's chart.
- Fibonacci range calculations depend on having sufficient price history for zigzag pivot detection. Newly listed instruments or very short timeframes may show "N/A" until enough data accumulates.
- ADX and ATR values are computed on each symbol's selected timeframe. Comparing values across different timeframes requires understanding that these metrics are timeframe-dependent.
The Fibonacci analysis methodology and zigzag pivot detection are based on well-established technical analysis principles. The multi-symbol screener architecture, dynamic table rendering, and column visibility system are original contributions.
Frequently Asked Questions
Unlock exclusive FibAlgo tools
Our best trading indicators plus AI-powered analysis for advanced trading.
Unlock now