Overview
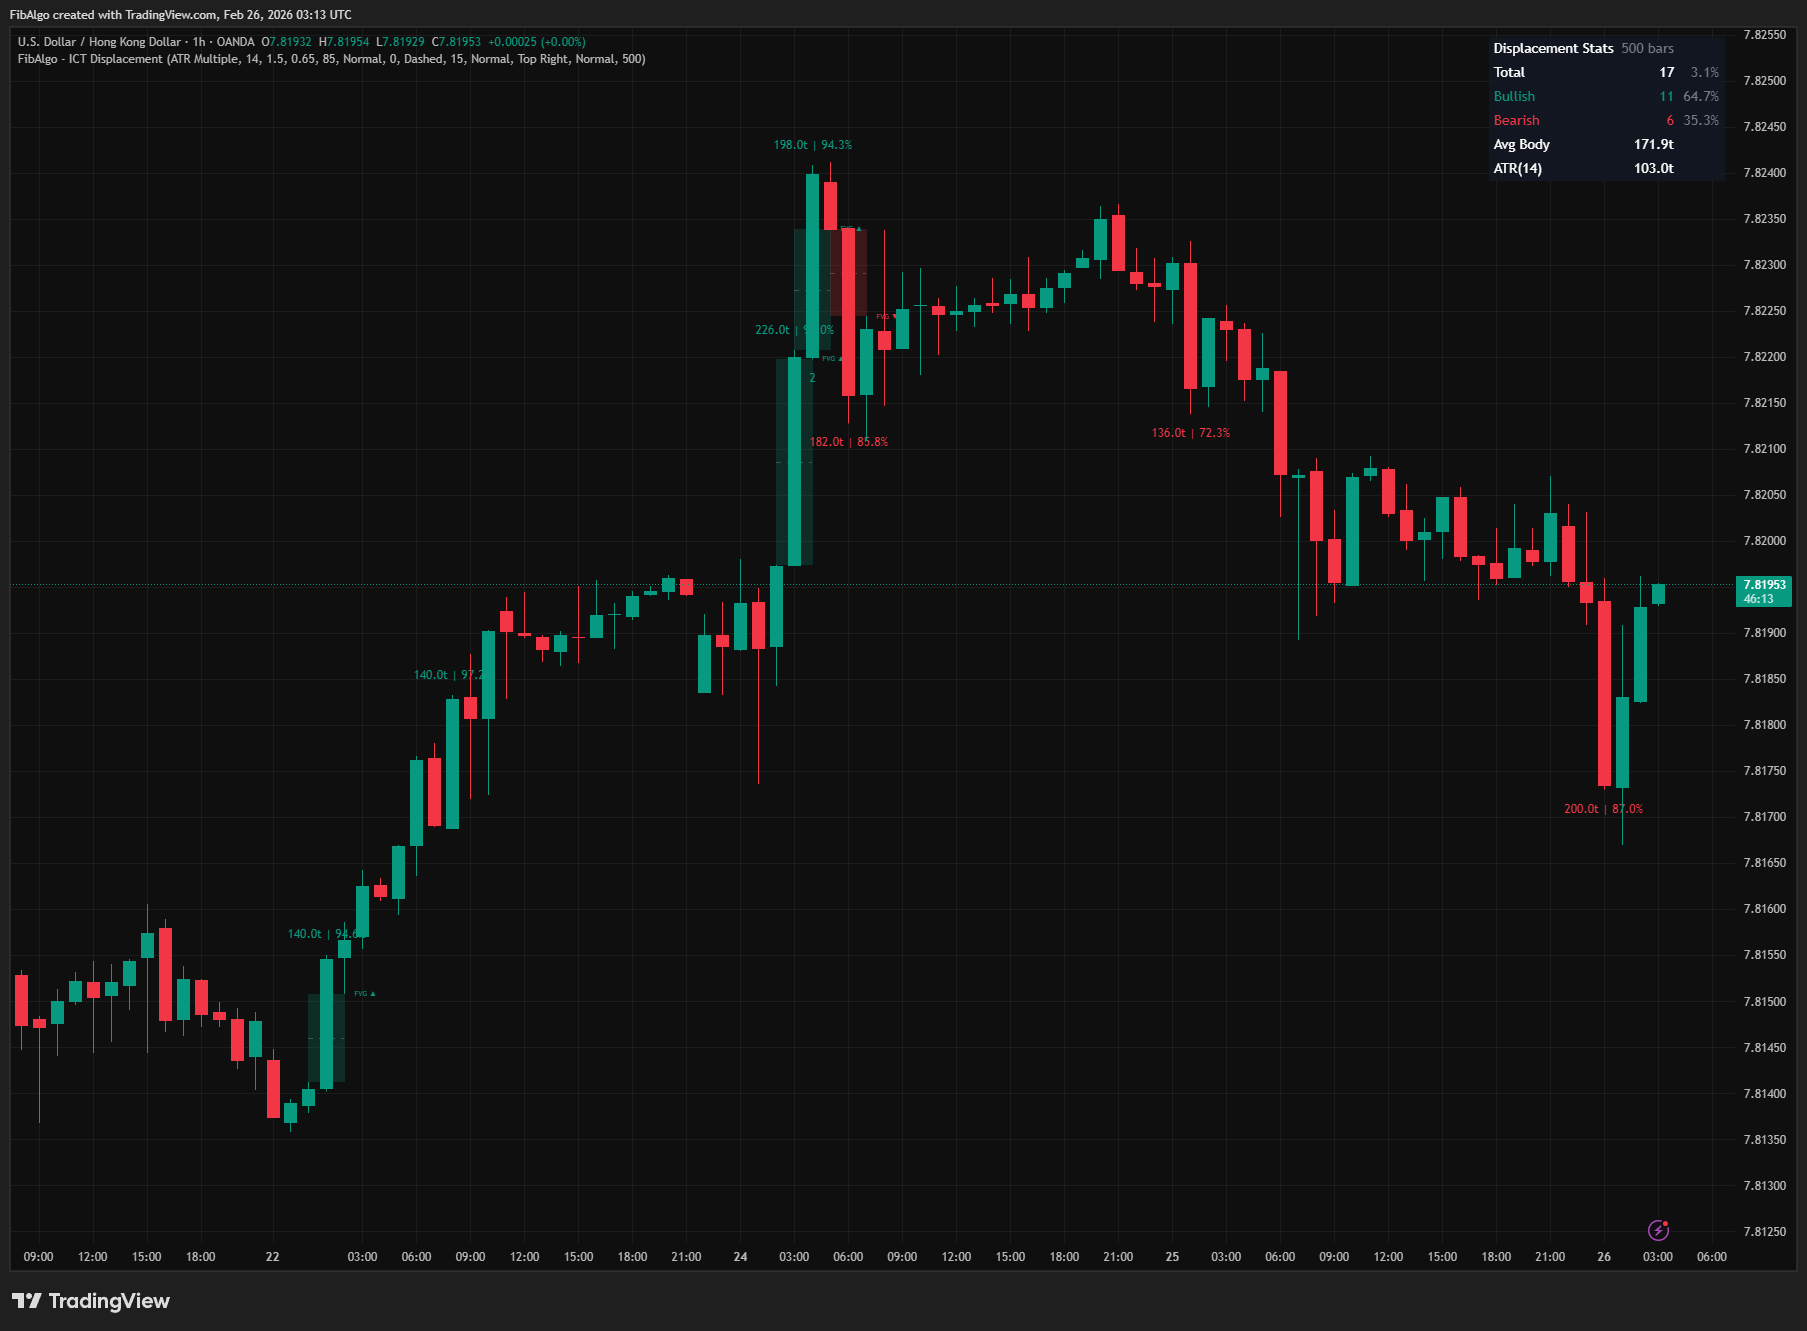
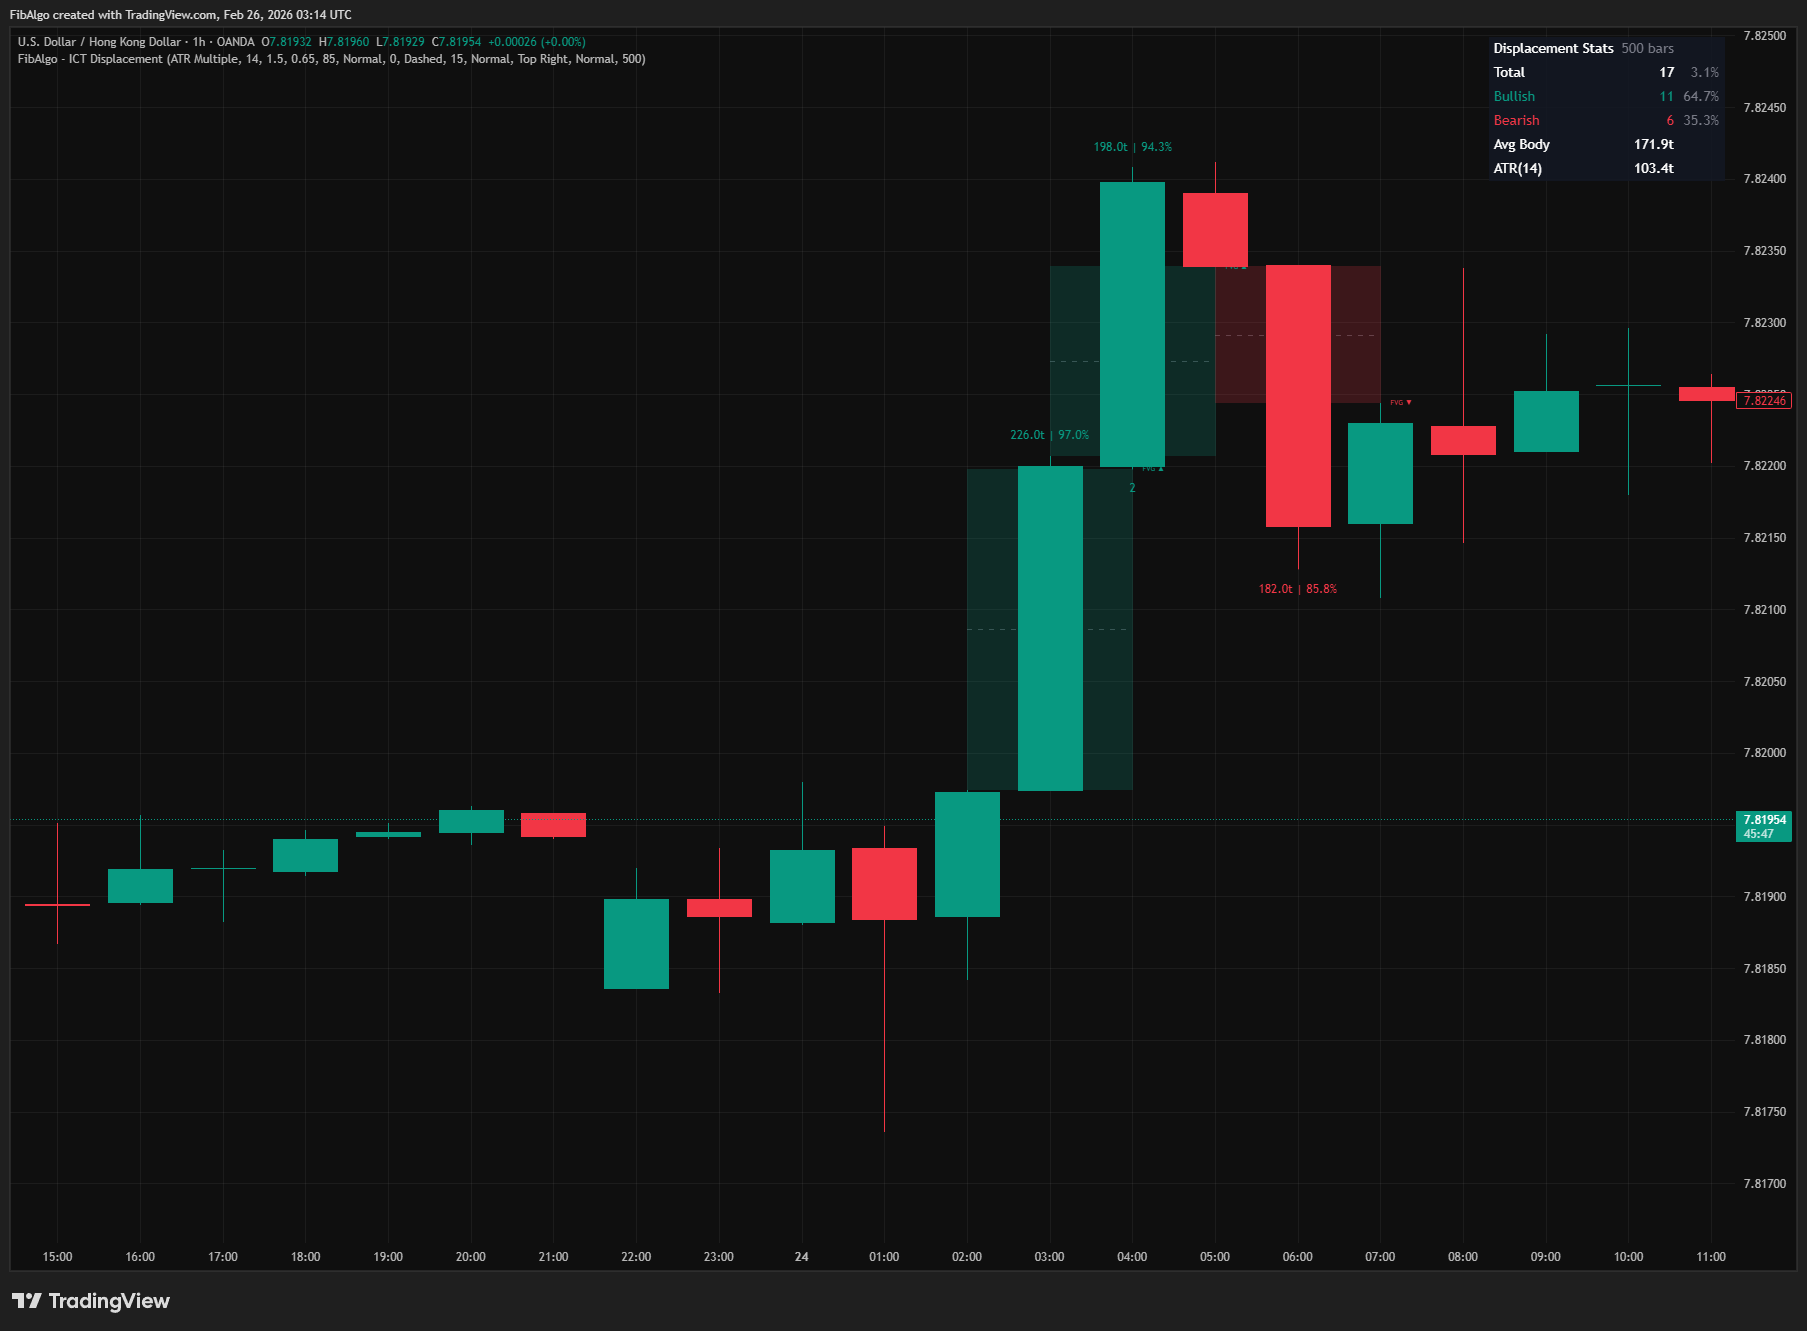
This indicator detects and highlights ICT Displacement candles — large, aggressive candles that represent significant institutional order flow. It uses dual detection methods (ATR Multiple and Body/Range Ratio) to identify displacement events, then visualizes them with a glow effect, bar coloring, and measurement labels showing body size in ticks and body-to-range percentage. The indicator also tracks consecutive displacement streaks, detects Fair Value Gaps (FVGs) created by displacement candles, and provides a real-time summary statistics table.
Key Concepts
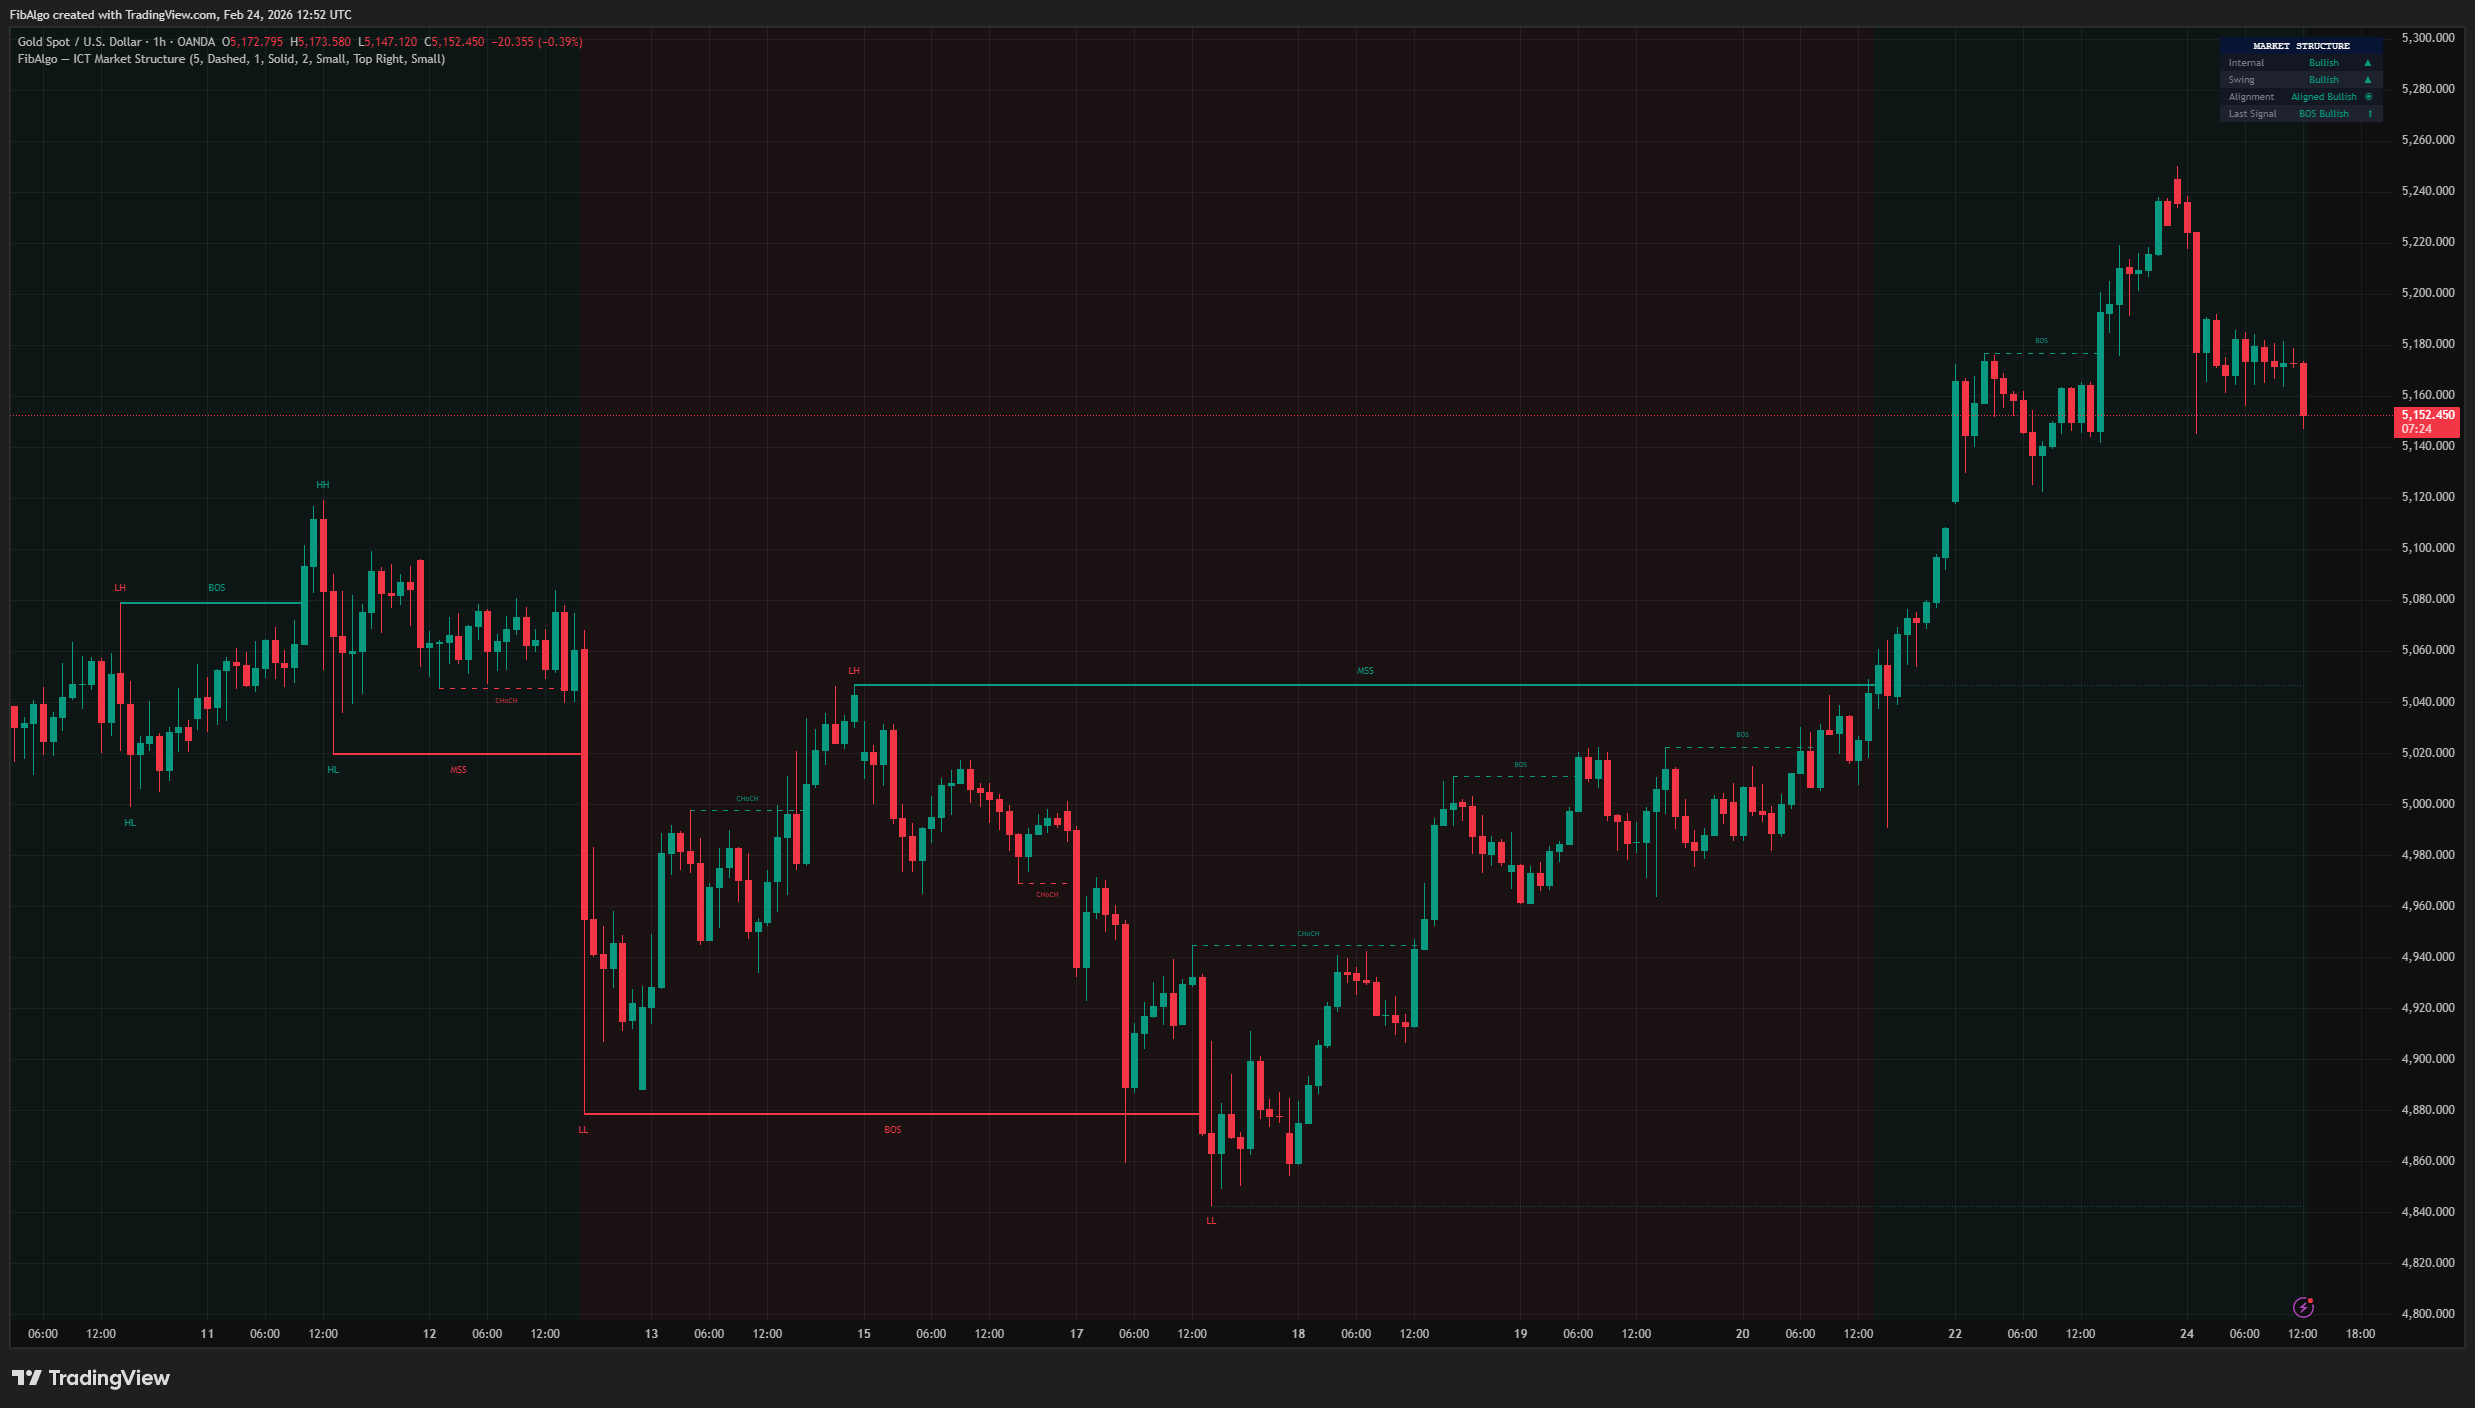
- Displacement — A large, aggressive candle (or series of candles) that moves price significantly in one direction, indicating strong institutional order flow. ICT defines displacement as a candle with an unusually large body relative to recent volatility, often leaving minimal wicks in the move direction. Displacement validates Order Blocks, creates Fair Value Gaps, and confirms Market Structure Shifts. It is the "engine" behind institutional price delivery.
- Institutional Candle — A candle whose body is at least 60–70% of the total candle range (high to low). This body-to-range ratio threshold separates candles with strong directional commitment from those with large wicks (indecision). ICT uses the institutional candle concept as the foundational filter for identifying displacement events.
- Displacement FVG — A standard 3-candle Fair Value Gap (gap between candle 1's high/low and candle 3's low/high) where the middle candle is a displacement candle. These FVGs carry higher significance because they are created by strong institutional momentum — price is more likely to respect and react at these zones compared to FVGs created by normal-sized candles.
- Consecutive Displacement (Streak) — Multiple displacement candles firing in the same direction without interruption. A streak of 2+ displacement candles in the same direction signals sustained institutional pressure. A streak of 3+ is a particularly strong signal that often precedes continuation or marks the core of a significant move.
How It Works
1. Displacement Detection The indicator provides three detection methods, selectable from settings: - ATR Multiple: Candle body must exceed ATR(14) × multiplier (default 1.5). This adapts to current market volatility — a candle that qualifies on a volatile day would need proportionally more range. - Body/Range Ratio: Candle body must be at least a configurable percentage (default 65%) of the total candle range. This identifies institutional candles with strong directional commitment and minimal wicks. - Both (AND): The candle must satisfy BOTH conditions simultaneously — large body relative to ATR AND high body-to-range ratio. This is the strictest filter.Doji candles (close equals open) are automatically excluded since they have zero body size. The detection runs on every bar and produces a binary bullish/bearish displacement state.
2. Glow Effect When a displacement candle is detected, a semi-transparent box is drawn behind the candle spanning from its high to its low. The glow effect provides an immediate visual highlight without obscuring the candlestick itself. Transparency is configurable (50 = strong glow, 95 = subtle glow, default 85). The box border uses slightly less transparency than the fill for a subtle edge definition. 3. Bar Coloring and Measurement Labels Displacement candles can optionally override the default candle colors — bullish displacement bars turn the configured bullish color (default green), bearish displacement bars turn the configured bearish color (default red). A measurement label appears above bullish displacement candles and below bearish ones, showing: body size in ticks (e.g., "245.0t") and body-to-range percentage (e.g., "78.5%"). This gives traders instant quantitative data on the displacement's strength.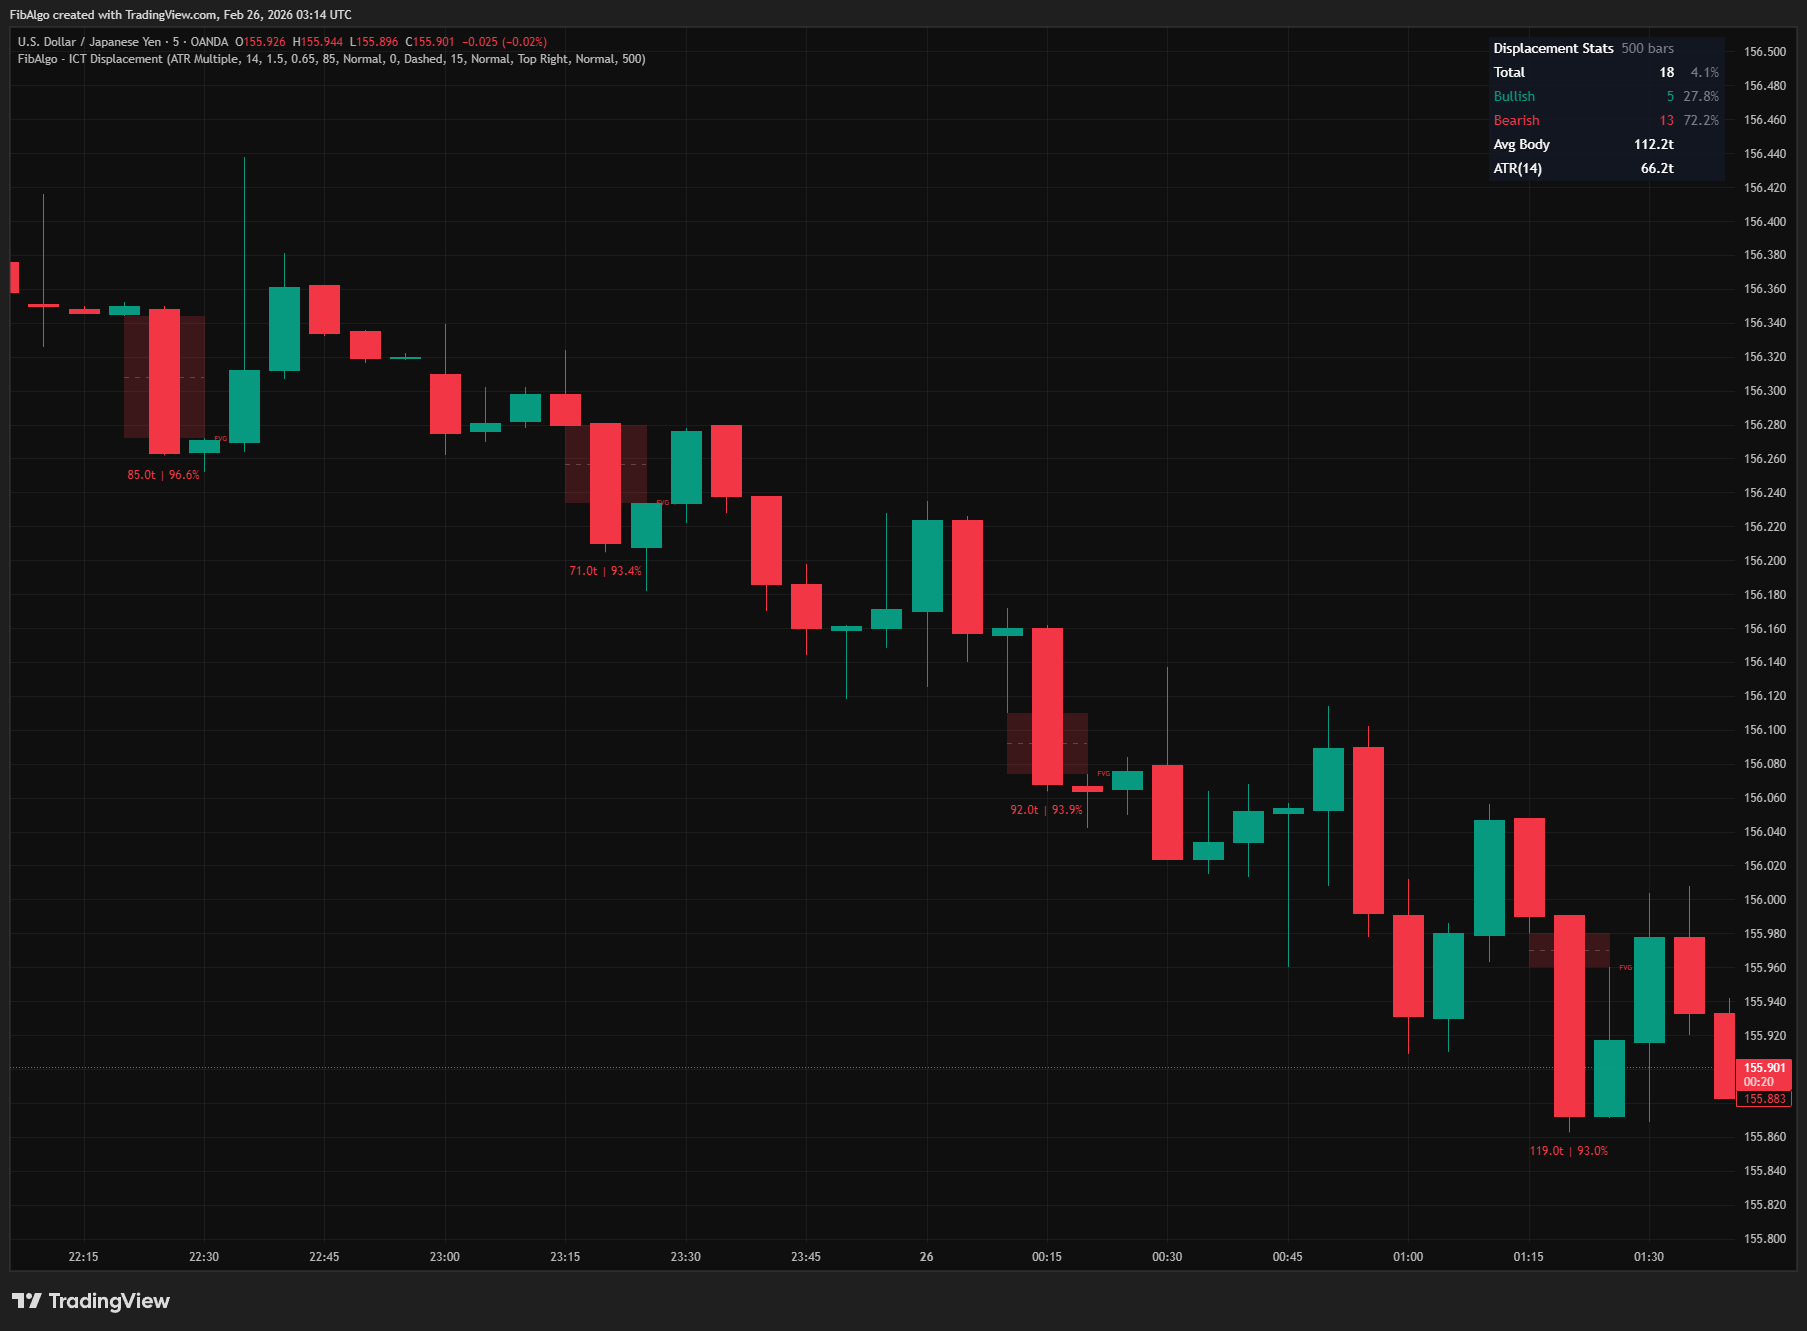
All alerts include the symbol and timeframe in the message and use once-per-bar frequency. A master "Enable Alerts" toggle disables all alert processing when off.
7. Summary Table A real-time statistics table displays displacement data across a configurable lookback period (default 500 bars). The table shows: Total displacement count and percentage of total bars, Bullish count and percentage of displacements, Bearish count and percentage of displacements, Average displacement body size in ticks, and Current ATR value in ticks. This provides a quick overview of displacement frequency and directional bias.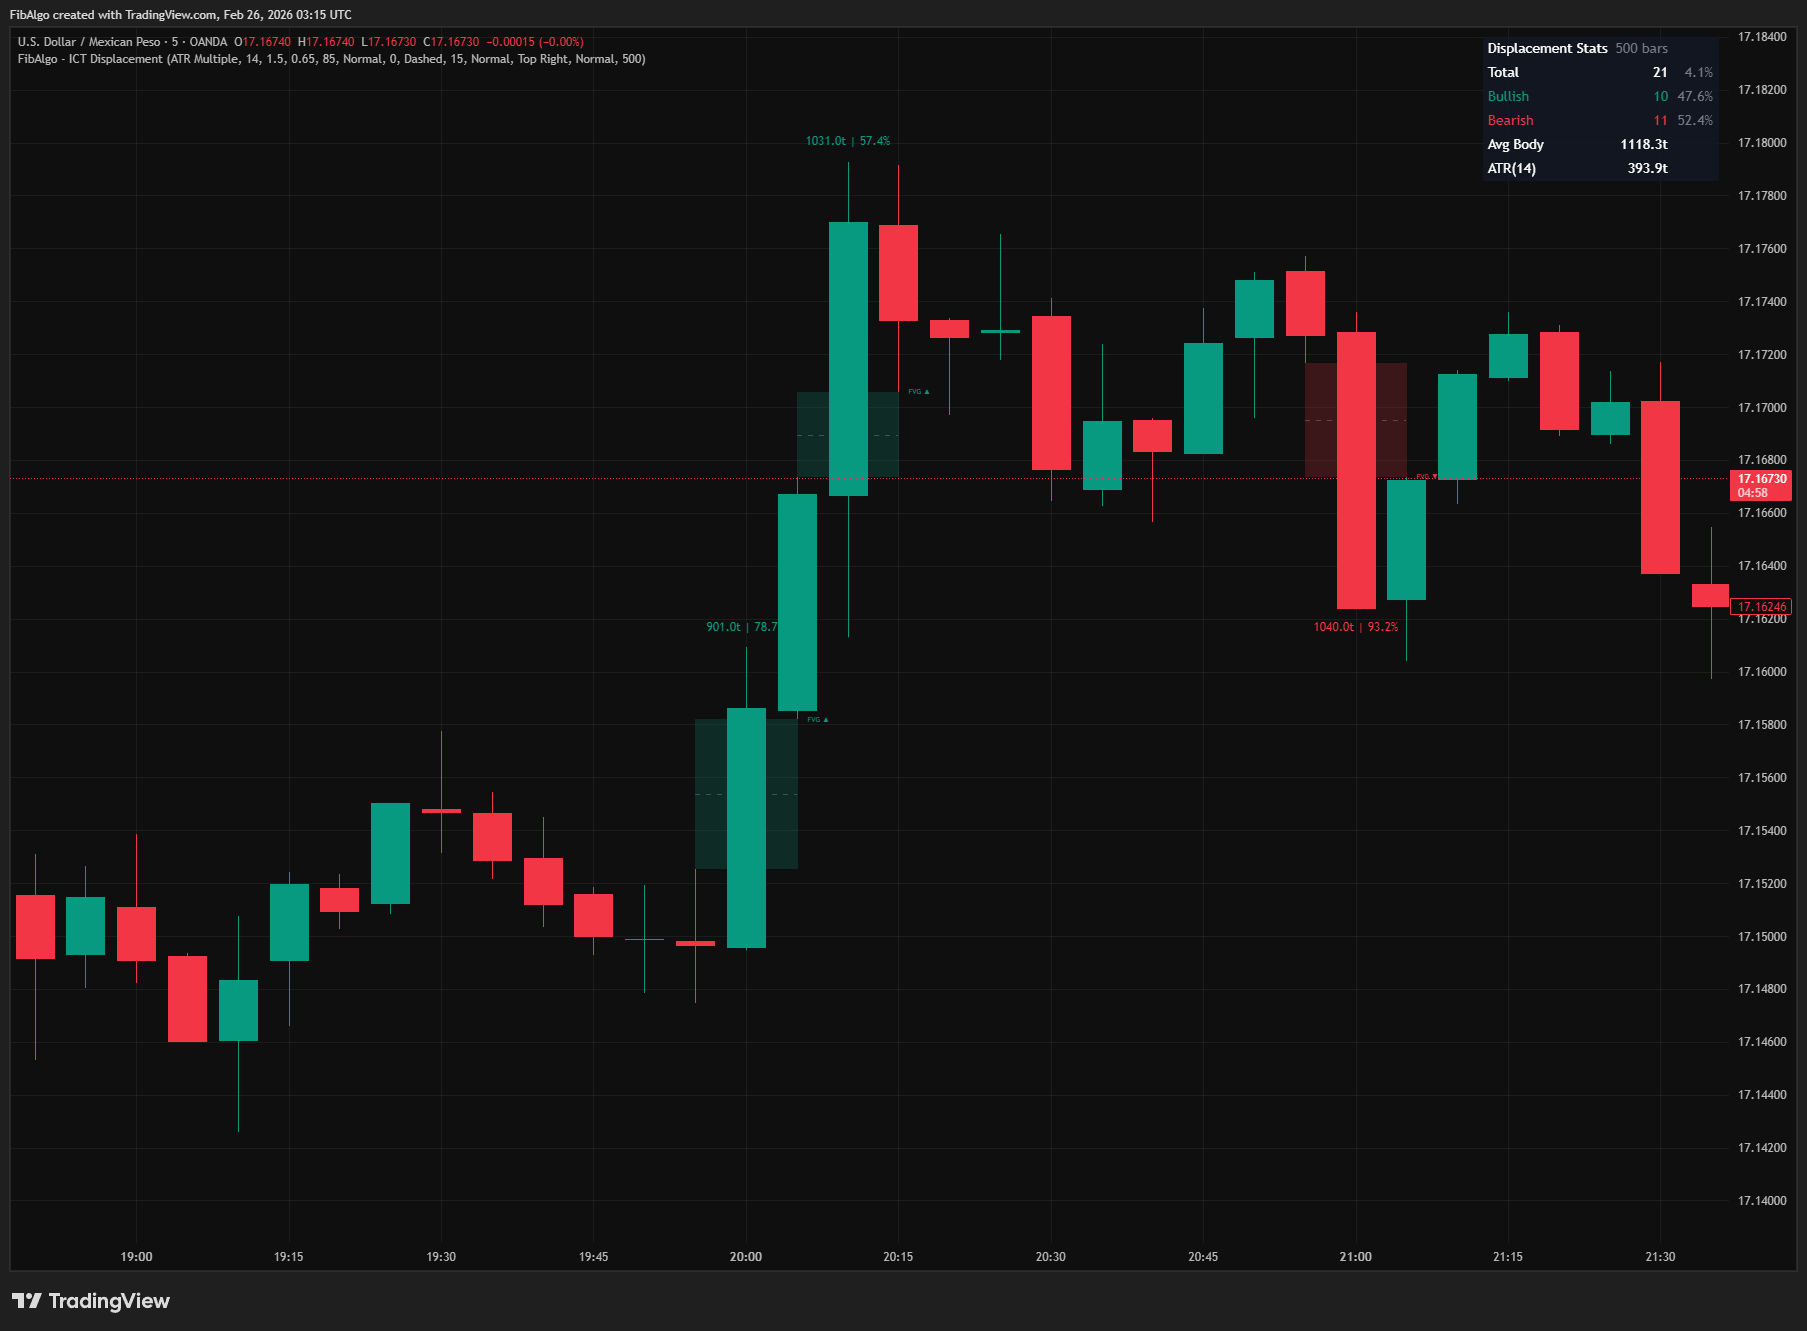
Features
- Dual Detection Method — Choose between ATR Multiple (volatility-adaptive), Body/Range Ratio (institutional candle filter), or Both (AND) for the strictest filtering. Instantly switch methods from settings without changing any other configuration.
- Glow Effect Highlighting — Semi-transparent background box behind each displacement candle provides a clean, professional visual highlight. Configurable transparency from strong (50) to subtle (95). Non-intrusive — the candlestick remains fully visible.
- Bar Coloring — Optional candle color override for displacement bars. Bullish and bearish displacement colors are independently configurable. Instantly spot displacement candles in a busy chart.
- Measurement Labels — Each displacement candle displays its body size in ticks and body-to-range percentage. Provides quantitative displacement strength data at a glance. Configurable label size (Tiny/Small/Normal).
- Displacement FVG Detection — Automatically identifies 3-candle FVGs where the middle candle is a displacement bar. Drawn as colored boxes with optional CE midlines. Separate from the glow effect, these highlight the specific gaps created by institutional momentum.
- CE Midline for FVGs — Optional 50% midpoint line for displacement FVGs. Configurable color and style (Solid/Dashed/Dotted). Marks the Consequent Encroachment level — ICT's key precision reaction point within a gap.
- Streak Tracking — Counts consecutive displacement candles in the same direction. Displays count label at 2+ streaks. Alerts at 3+ streaks for significant sustained institutional pressure.
- FVG History Management — Configurable number of displacement FVGs to display (1–50, default 15). Oldest FVGs are auto-deleted with all drawing objects to stay within TradingView's 500-object drawing limits.
- Summary Statistics Table — Real-time table showing total/bullish/bearish displacement count, percentages, average body size, and current ATR over a configurable lookback period. Provides macro context at a glance.
- 3 Alert Conditions — Displacement detected (with body %), FVG created, and 3+ streak. Each alert has an independent toggle and includes symbol + timeframe. Master enable switch for all alerts.
- Volatility-Adaptive Detection — ATR-based detection automatically adjusts to the instrument's current volatility. A candle that qualifies as displacement during low-volatility periods would need proportionally more range during high-volatility periods.
- Full Color Customization — Independent color settings for bullish/bearish displacement glow, bar coloring, FVG boxes, CE lines, and label text. All elements can be independently enabled or disabled.
How to Use
- Confirm Institutional Activity: Displacement candles confirm that institutions are actively pushing price. When you see a displacement candle with a high body percentage (75%+), it indicates strong directional commitment. Use these to validate Order Blocks, Market Structure Shifts, and directional bias.
- Trade Displacement FVGs: When a displacement candle creates an FVG, that gap is a high-probability retracement zone. Wait for price to retrace to the FVG zone (or its CE midline) and look for continuation in the displacement direction. Displacement FVGs are stronger than regular FVGs because they were created by verified institutional momentum.
- Streak as Momentum Confirmation: A streak of 2+ displacement candles signals sustained institutional pressure. A streak of 3+ is a strong momentum signal. Use streaks to confirm trend continuation or the beginning of a significant move. Avoid fading a 3+ streak — the institutions are committed.
- ATR Context from Table: The summary table's ATR value and average displacement body size help calibrate your expectations. If the average displacement body is 2–3× ATR, recent displacements have been especially strong. Compare bullish vs. bearish displacement counts to gauge directional bias over the lookback period.
- Method Selection: Use "ATR Multiple" for volatility-adaptive detection (best for general use). Use "Body/Range Ratio" when you want to focus specifically on institutional candle characteristics (minimal wicks). Use "Both (AND)" when you want only the highest-conviction displacement events.
- Combine with ICT Framework: Use displacement detection alongside Market Structure (direction), Order Blocks (entry levels), Fair Value Gaps (retracement zones), Premium/Discount (range positioning), Killzones (session timing), and Liquidity Levels (targets). A displacement candle with a streak of 3 creating an FVG inside a discount zone during London Killzone is a high-confluence setup.
Limitations
- Displacement detection is relative to recent volatility (ATR) or candle structure (body/range ratio). What qualifies as displacement in a low-volatility environment may not qualify during high-volatility periods when using ATR Multiple. Adjust the ATR Multiplier or switch to Body/Range Ratio for consistency across volatility regimes.
- The Body/Range Ratio method does not account for absolute candle size — a small candle with a very large body-to-range ratio (e.g., a 2-tick candle with 95% body) will qualify even though it may not represent significant institutional activity. Combine with ATR Multiple ("Both" mode) to filter these out.
- FVG detection checks the standard 3-candle pattern where the MIDDLE candle must be a displacement candle. If a displacement candle exists but the surrounding candles overlap (no gap), no FVG will be detected. This is by design — only true gaps are highlighted.
- Streak tracking resets when ANY non-displacement candle appears or the direction changes. Even a single small candle breaking the streak resets the counter, even if another displacement candle appears on the very next bar (the new count starts at 1).
- The summary table recalculates all statistics from scratch on the last bar using a lookback loop. On very large lookback values (5000 bars), this may cause slight script execution overhead on lower timeframes.
- Drawing object limits: TradingView allows 500 boxes, 500 lines, and 500 labels. Each displacement candle uses up to 2 objects (glow box + measurement label). Each FVG uses up to 3 objects (box + CE line + label). Streak labels add additional objects. With default settings on most timeframes, usage stays well within limits. On very low timeframes with high displacement frequency, consider reducing FVG History Count.
- Glow effect opacity is uniform for all displacement candles. There is no graduated intensity based on displacement strength — all qualifying candles receive the same glow. Use measurement labels to compare relative strength between displacement events.
- This indicator identifies displacement events — it does not generate buy/sell signals. Use it within the broader ICT framework alongside Market Structure, Order Blocks, Fair Value Gaps, Premium/Discount, Killzones, and Liquidity Levels for complete trade setups.