Overview
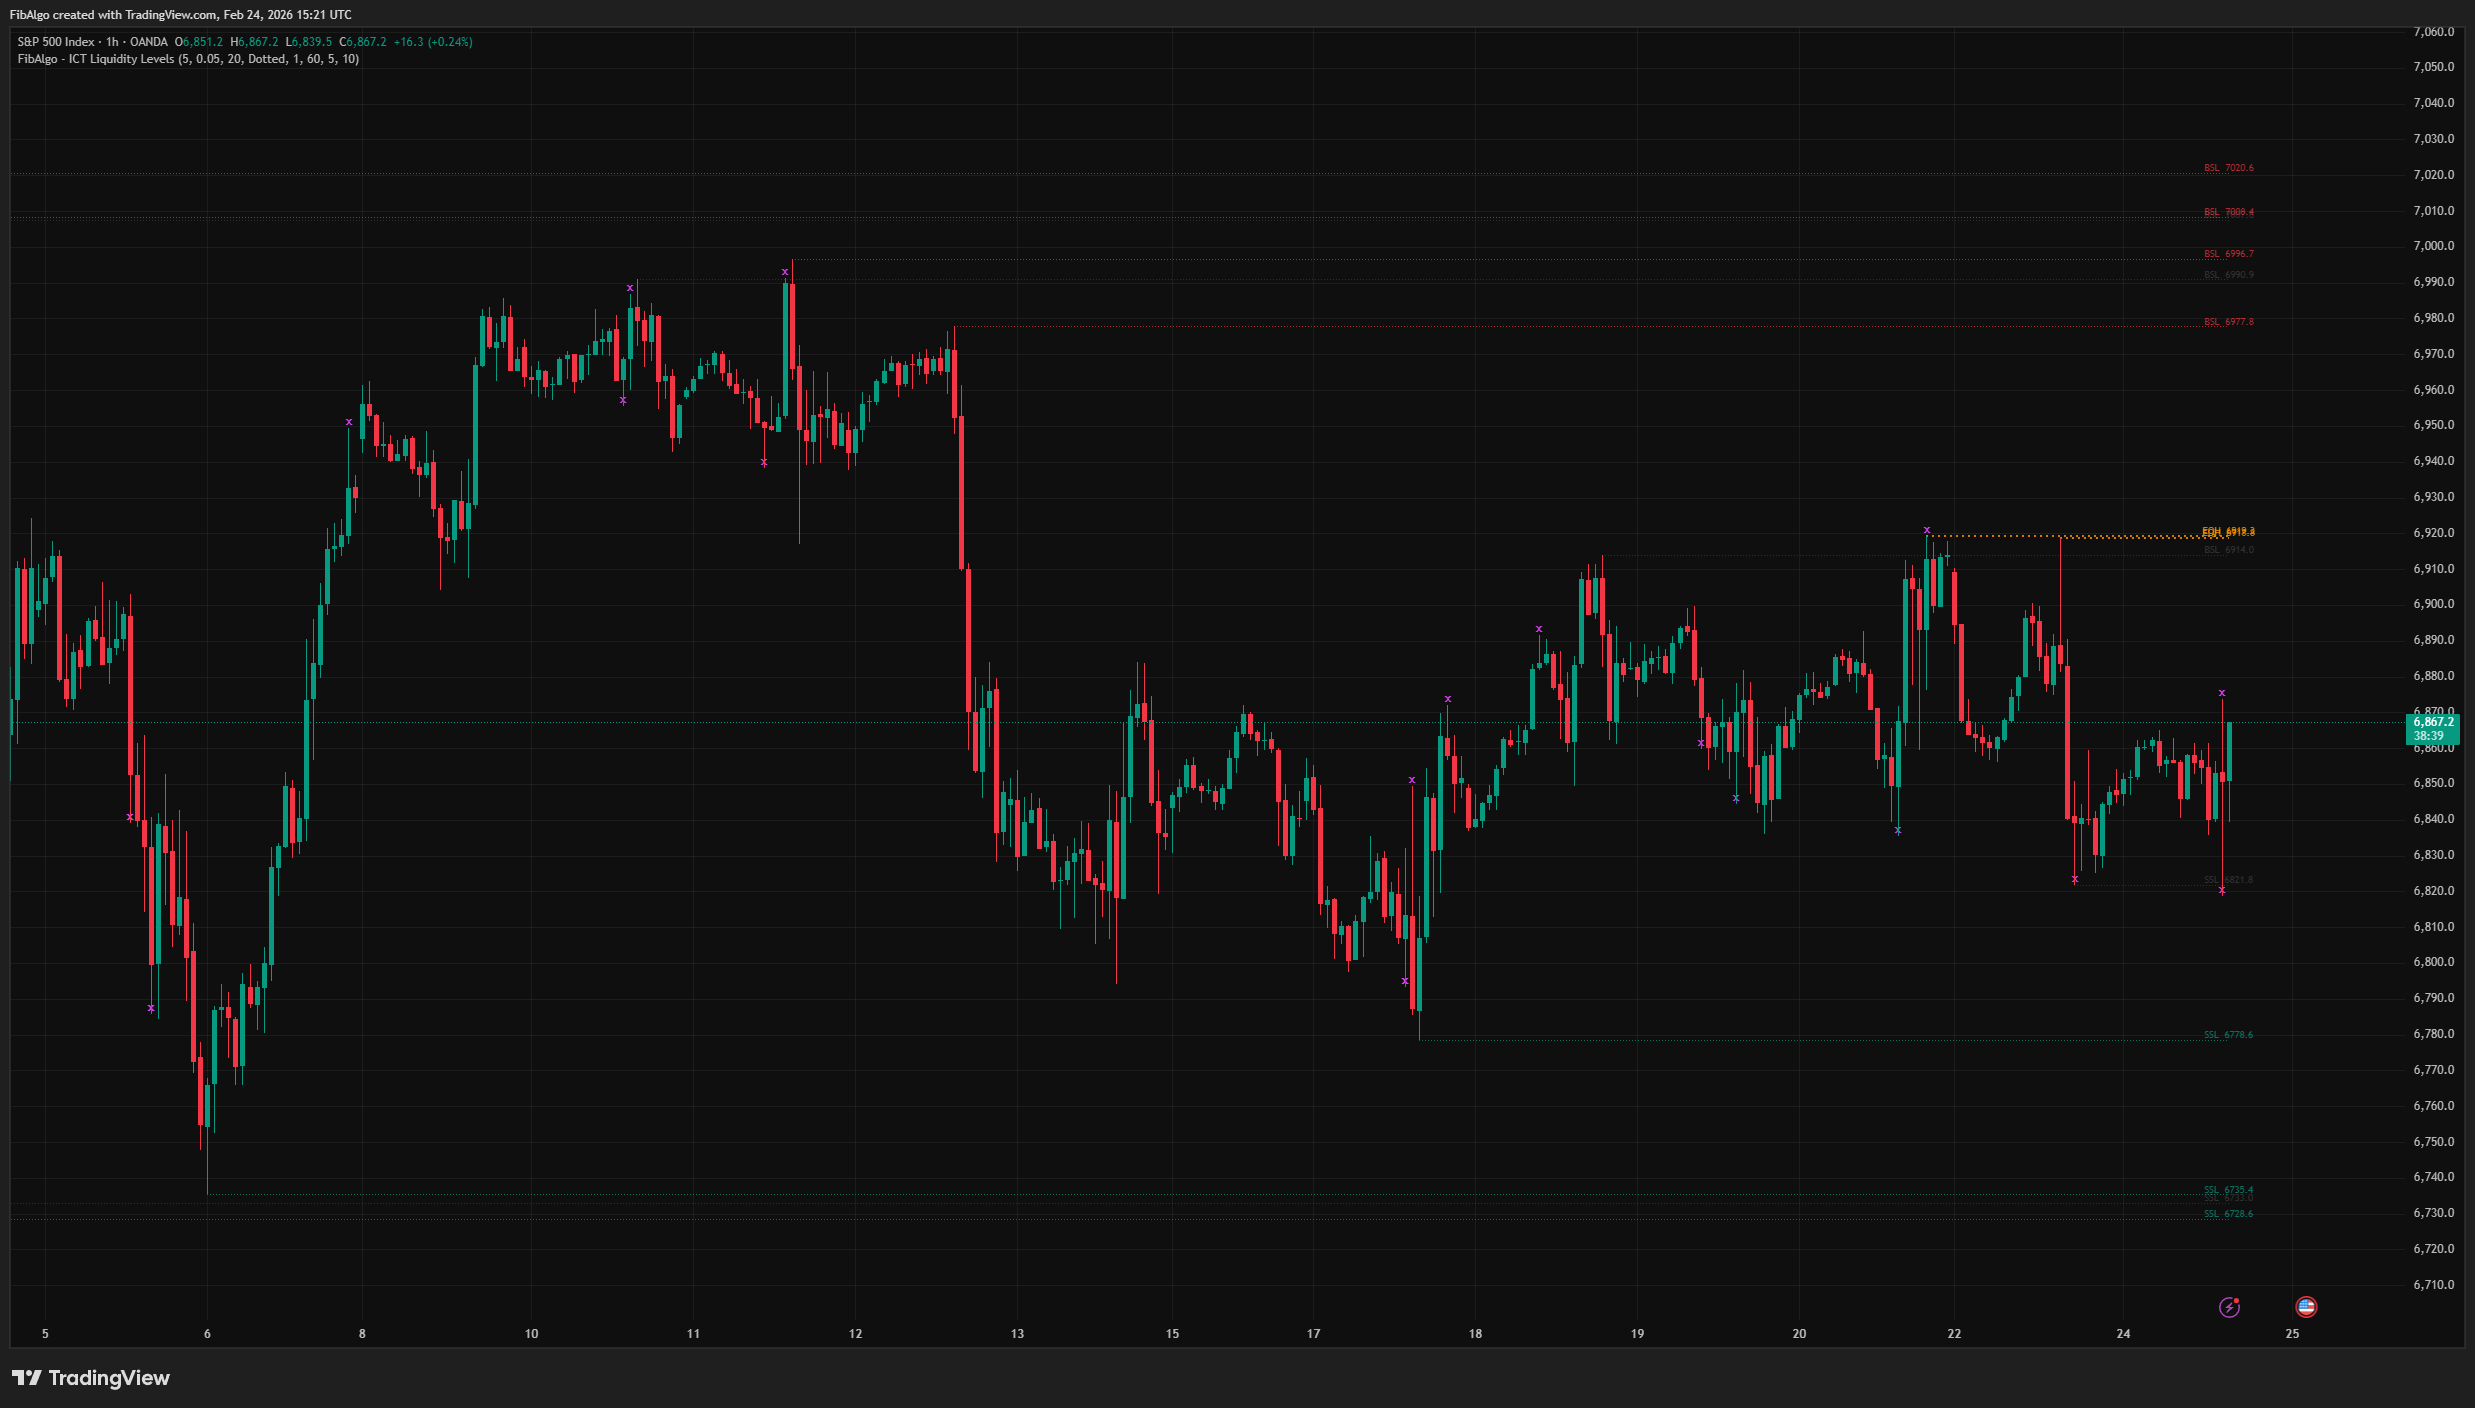
This indicator maps ICT (Inner Circle Trader) Liquidity Levels — the resting stop-loss orders that accumulate above swing highs and below swing lows. It detects Buy Side Liquidity (BSL), Sell Side Liquidity (SSL), Equal Highs (EQH), Equal Lows (EQL), and Liquidity Sweeps (Turtle Soup), with full Higher Timeframe (HTF) support for multi-timeframe confluence. Levels extend in real time, labels display the exact price, and swept levels are marked and invalidated automatically.
Key Concepts
- Buy Side Liquidity (BSL) — Resting buy stop orders above swing highs. When traders place stop losses above swing highs or set buy stop entries, they create a pool of liquidity that institutional players target. Drawn as a horizontal line at the swing high price.
- Sell Side Liquidity (SSL) — Resting sell stop orders below swing lows. Stop losses below swing lows and sell stop entries create a liquidity pool that smart money hunts. Drawn as a horizontal line at the swing low price.
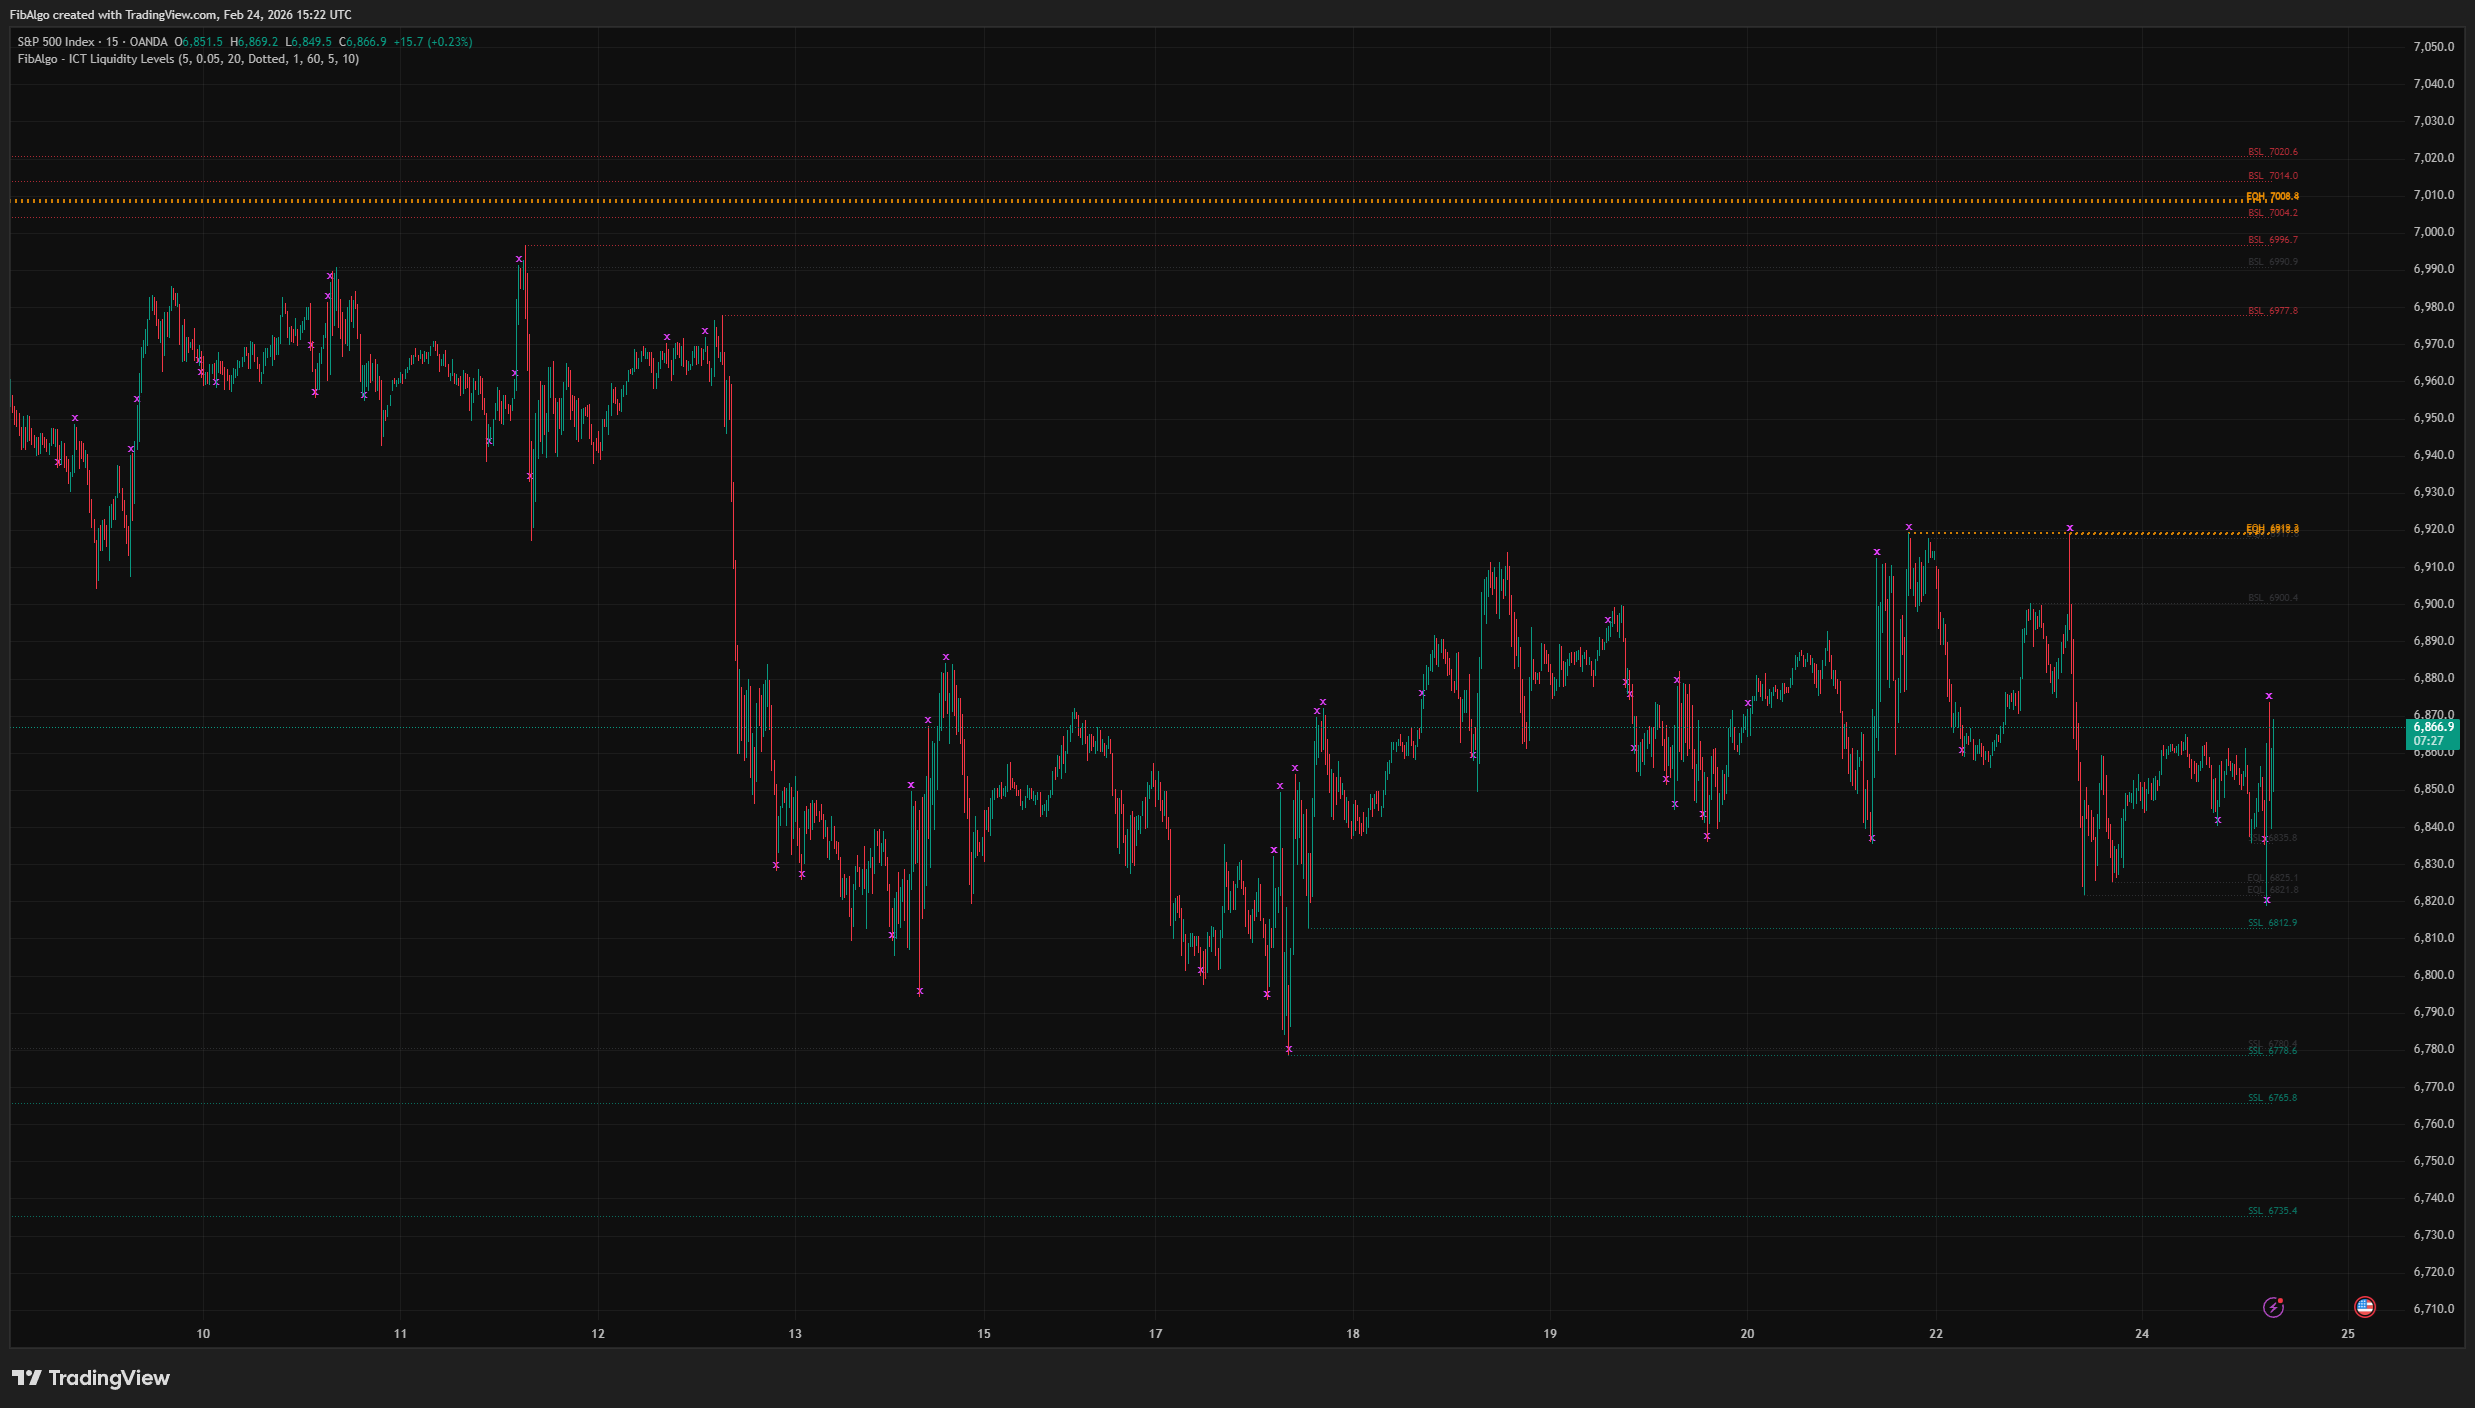
- Equal Highs (EQH) — When two or more swing highs form at approximately the same price, a concentrated BSL pool builds. Market makers view this double/triple top pattern as a magnet — the clustered stops above represent a high-value liquidity target.
- Equal Lows (EQL) — When two or more swing lows align at the same price, a concentrated SSL pool forms below. This double/triple bottom pattern attracts institutional stop hunts.
- Liquidity Sweep (Turtle Soup) — When price wicks beyond a liquidity level but closes back inside, the stop orders have been triggered (swept) without genuine structural breakout. This "stop hunt" — also known as Turtle Soup — is a classic ICT reversal signal.
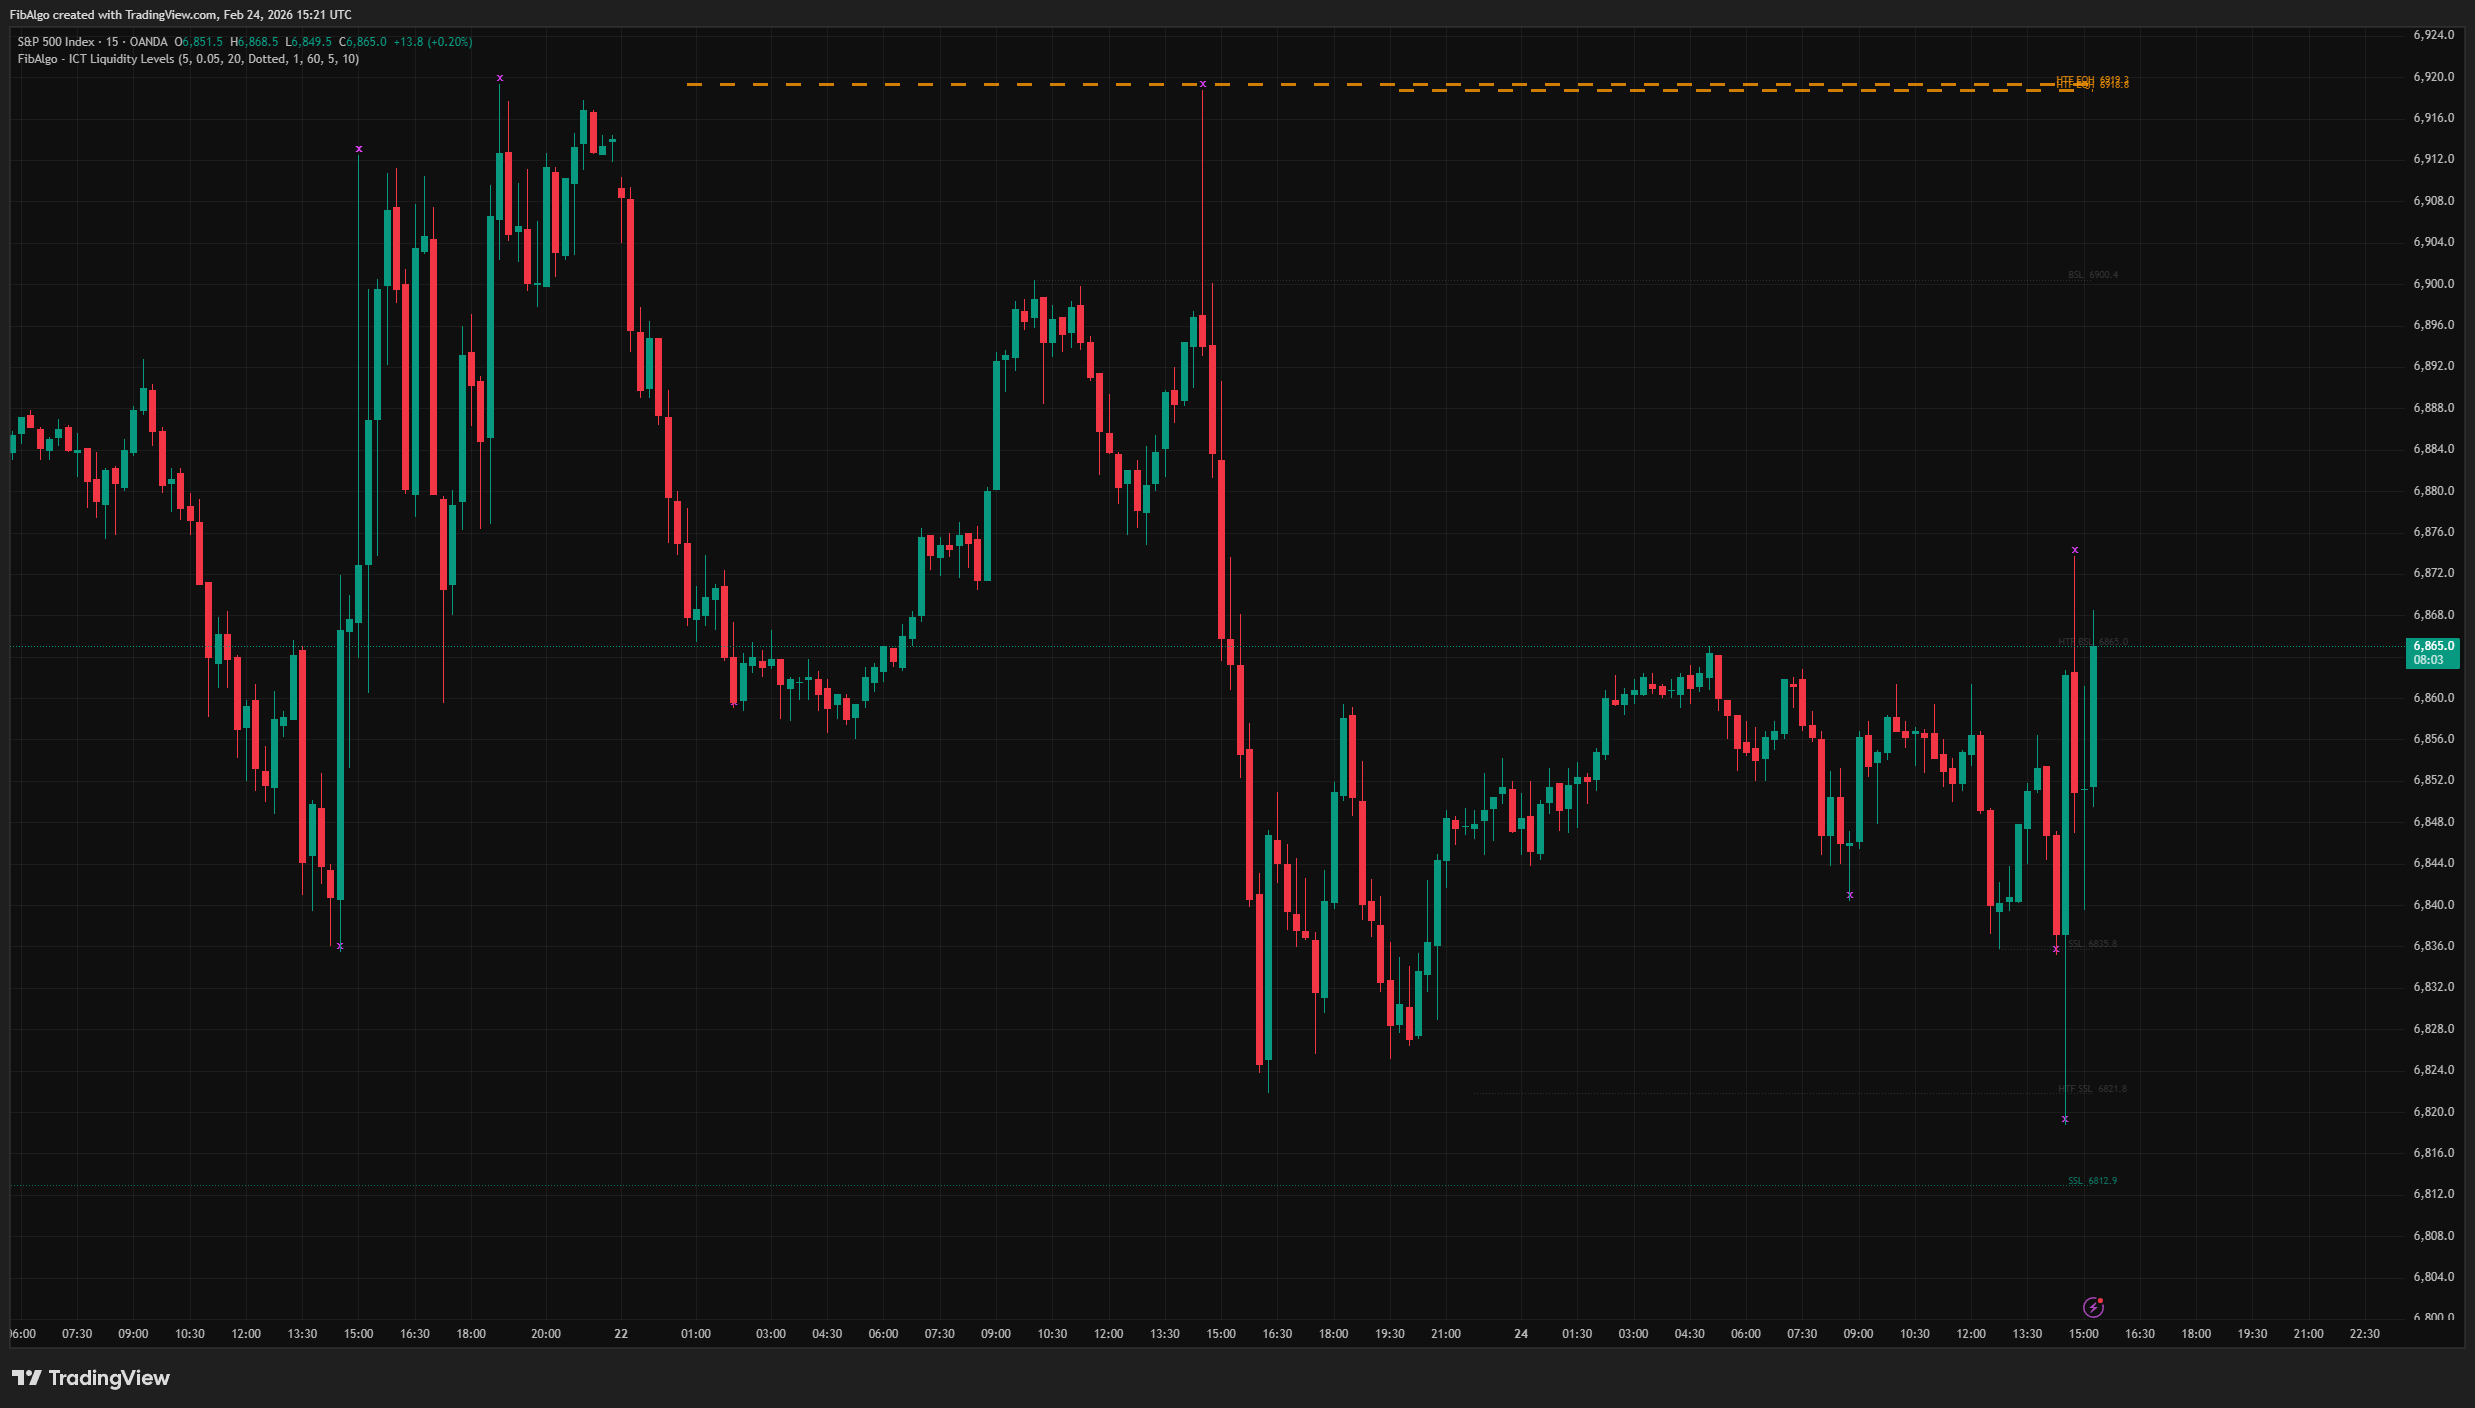
- Higher Timeframe (HTF) Liquidity — Liquidity levels from higher timeframes carry more significance because they represent larger pools of resting orders. The indicator plots HTF levels alongside current-timeframe levels for confluence analysis.
How It Works
1. Swing Detection The indicator uses ta.pivothigh and ta.pivotlow with a configurable Swing Length parameter. A swing high is confirmed when the high is higher than the surrounding bars on both sides; a swing low is confirmed when the low is lower. Each confirmed swing creates a new liquidity level. 2. Equal Highs / Equal Lows When a new swing high forms within a tolerance (default 0.05%) of an existing BSL level, both levels are classified as Equal Highs (EQH). The existing level is upgraded — its color changes to the EQH color and line width increases. The same logic applies to Equal Lows (EQL). This tolerance-based matching accounts for natural price variations that still represent the same institutional liquidity pool. 3. Liquidity Sweep Detection Sweep detection runs independently of display settings (decoupled detection). On every bar, the indicator checks each active level:- BSL Sweep: High penetrates above the level but close remains below — buy stops were triggered.
- SSL Sweep: Low penetrates below the level but close remains above — sell stops were triggered.
- An italic 𝘅 marker appears at the sweep point.
- The line fades to gray (dotted, width 1) indicating the level has been raided.
- An alert fires (if enabled) with "[HTF] BSL/SSL Swept" including price and symbol.
Features
- BSL / SSL Detection — Automatic identification of buy side and sell side liquidity at confirmed swing highs and lows.
- Equal Highs / Equal Lows — Tolerance-based matching detects concentrated liquidity pools where multiple swings align at the same price. EQH/EQL levels receive distinct colors and increased line width.
- Liquidity Sweep (Turtle Soup) — Real-time detection of stop hunts: wick beyond + close inside. Italic 𝘅 marker at the sweep point, line fades to gray.
- Decoupled Detection / Display — Sweep detection always runs regardless of the "Show Sweeps" toggle. Turning off the visual does not disable the underlying logic or alerts.
- Higher Timeframe Levels — Fetch HTF swing data via request.security for multi-timeframe confluence. HTF levels shown with dashed lines, opaque colors, and increased width.
- HTF-LTF Overlap Prevention — When both timeframes have a level at the same price, only the HTF level is displayed. Bidirectional check prevents duplication.
- Automatic Level Invalidation — Levels are removed when price closes beyond them (sweep continuation or direct breakout). No stale levels remain on the chart.
- Right-Aligned Labels with Price — Clean flat-text labels (no balloon) display "BSL 105.50", "HTF EQH 106.20" etc., repositioned to the right edge every bar.
- Per-Type Display Limits — Independent caps for LTF BSL, LTF SSL, HTF BSL, and HTF SSL. Oldest levels removed first.
- Full Color Customization — Separate colors for BSL, SSL, EQH, EQL, Sweep Marker, HTF BSL, and HTF SSL.
- Alert System — Three configurable alerts: New Liquidity Level, Liquidity Sweep, and New Equal H/L. Each includes HTF prefix when applicable, price, symbol, and timeframe.
How to Use
- Identify Liquidity Targets: BSL levels above swing highs and SSL levels below swing lows show where stop orders are resting. Price is drawn toward these pools — use them as directional targets.
- Equal Highs / Lows as Magnets: EQH and EQL zones represent concentrated liquidity. When price approaches an EQH/EQL level, expect a sweep attempt. These are high-probability stop-hunt targets.
- Turtle Soup Reversal: When a sweep marker (𝘅) appears, it signals that liquidity was taken but price rejected the breakout. This is a classic reversal setup — look for confirmation from Order Blocks, FVGs, or market structure shifts.
- HTF Confluence: Enable HTF levels to see where larger-timeframe liquidity sits. When an HTF and LTF level align (or are near each other), the liquidity pool is more significant. HTF sweeps carry stronger reversal implications.
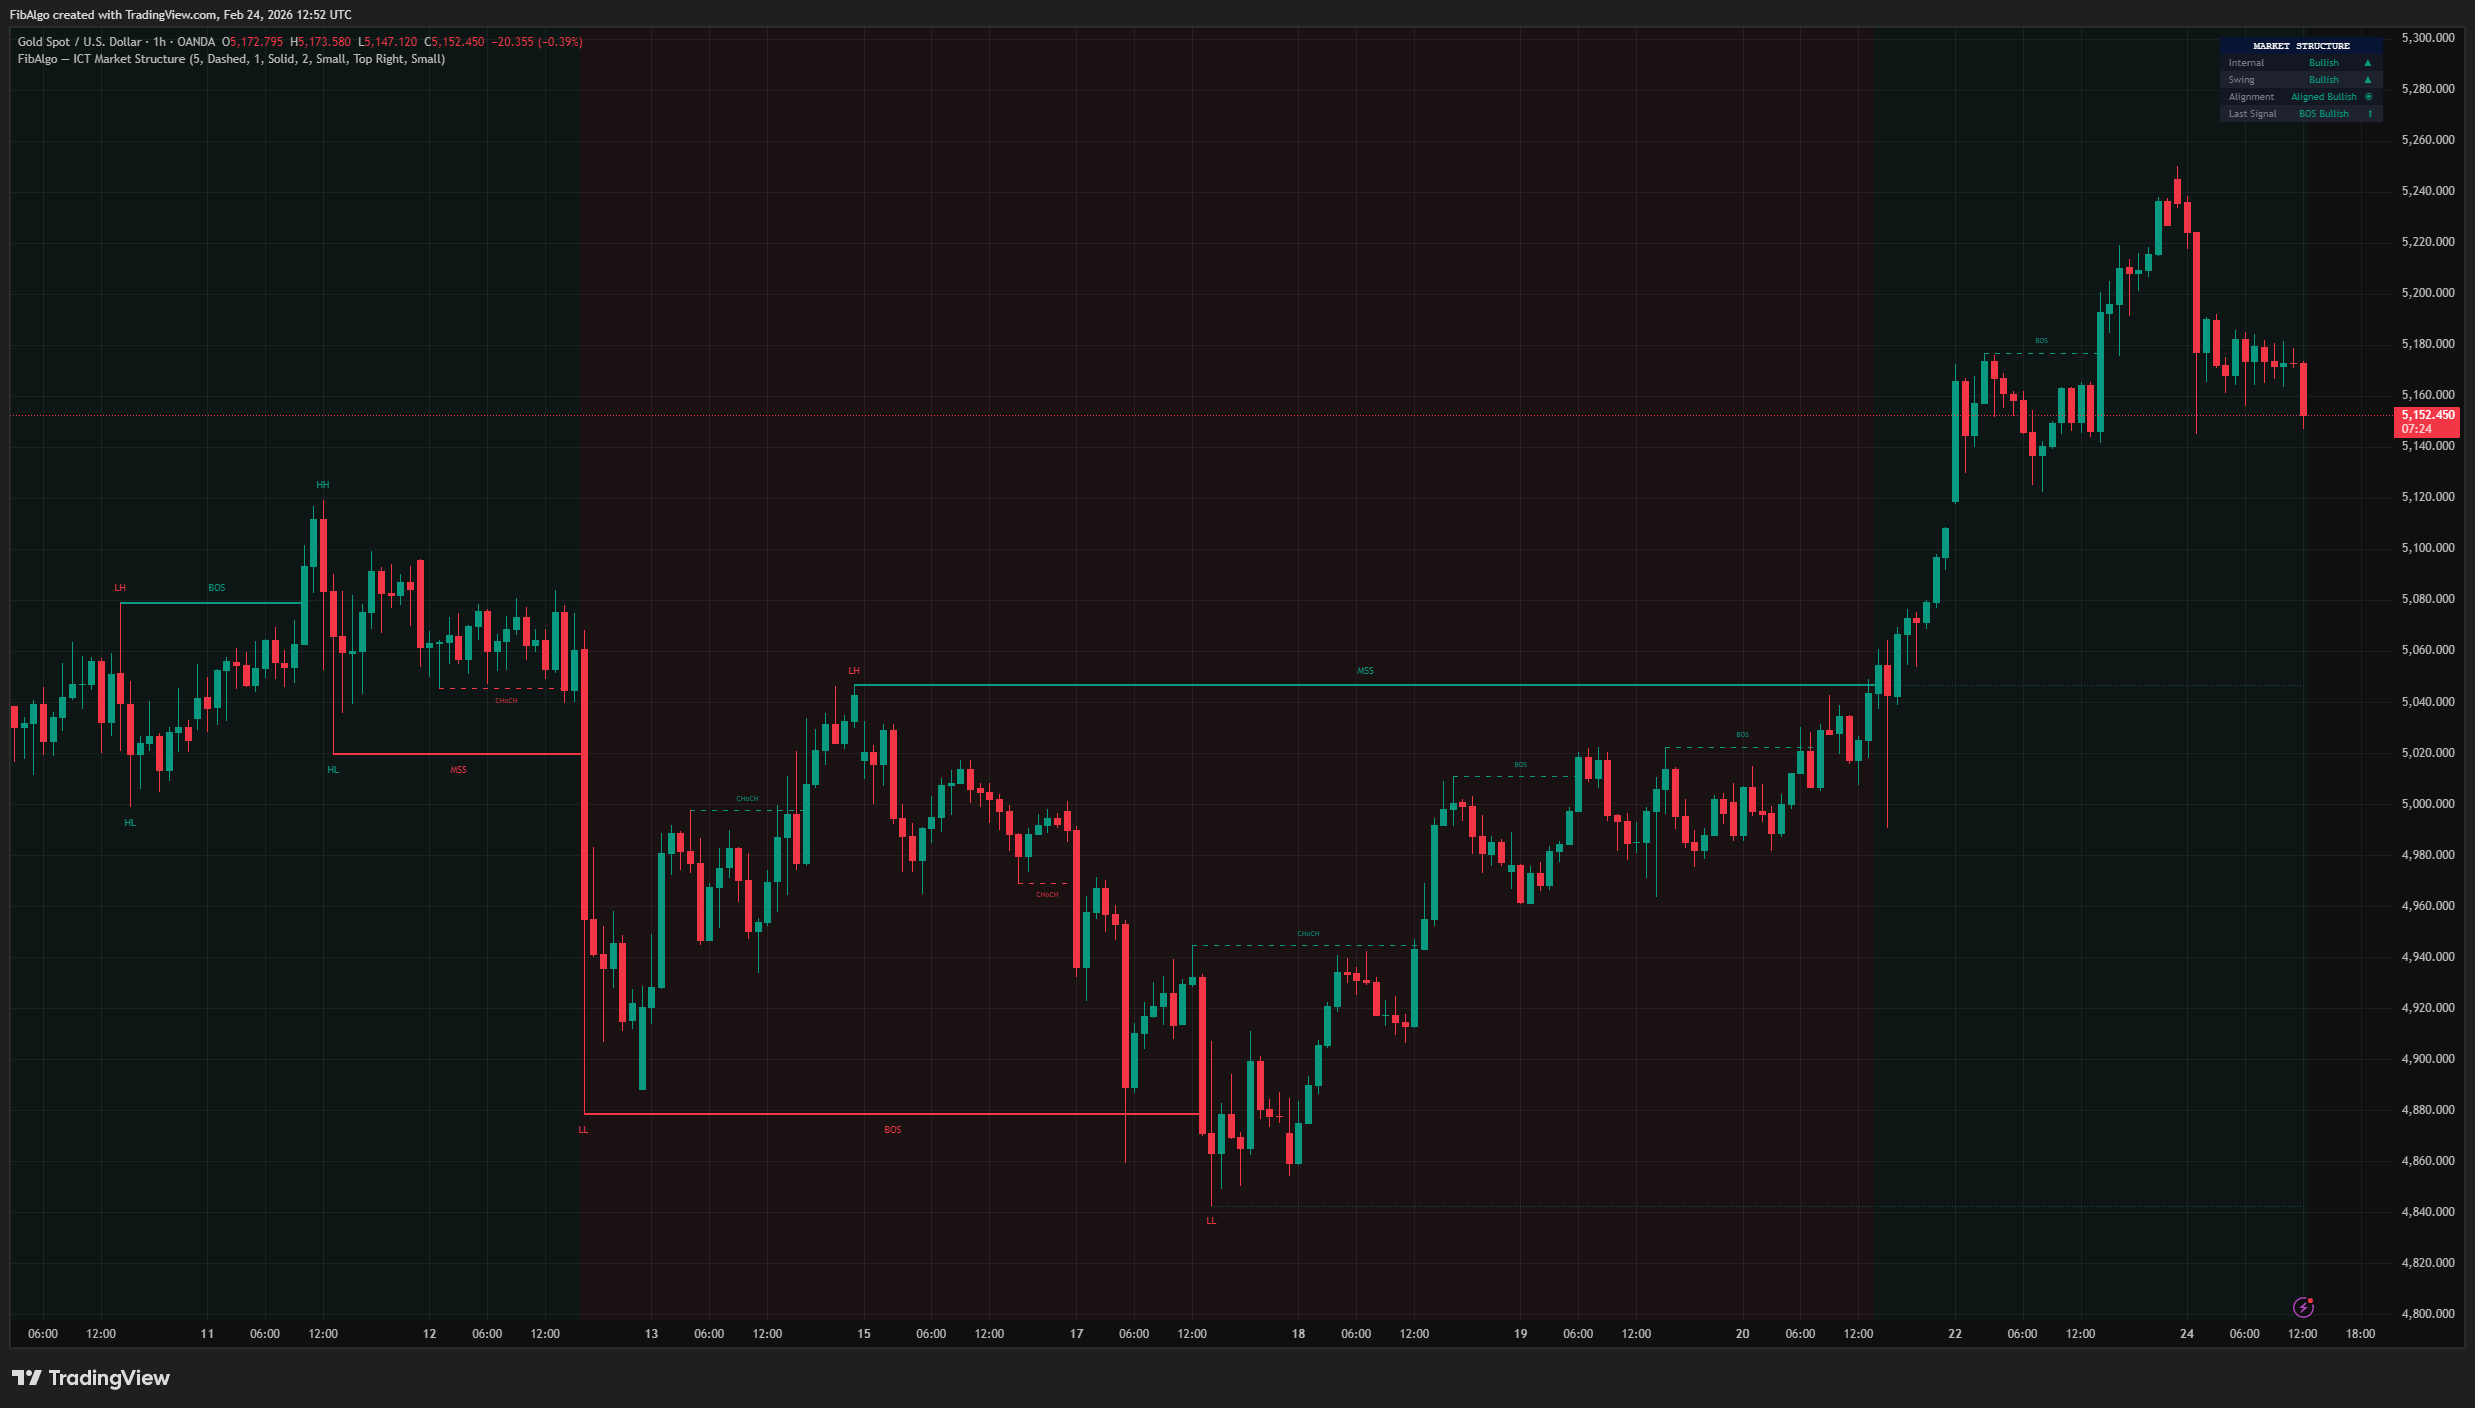
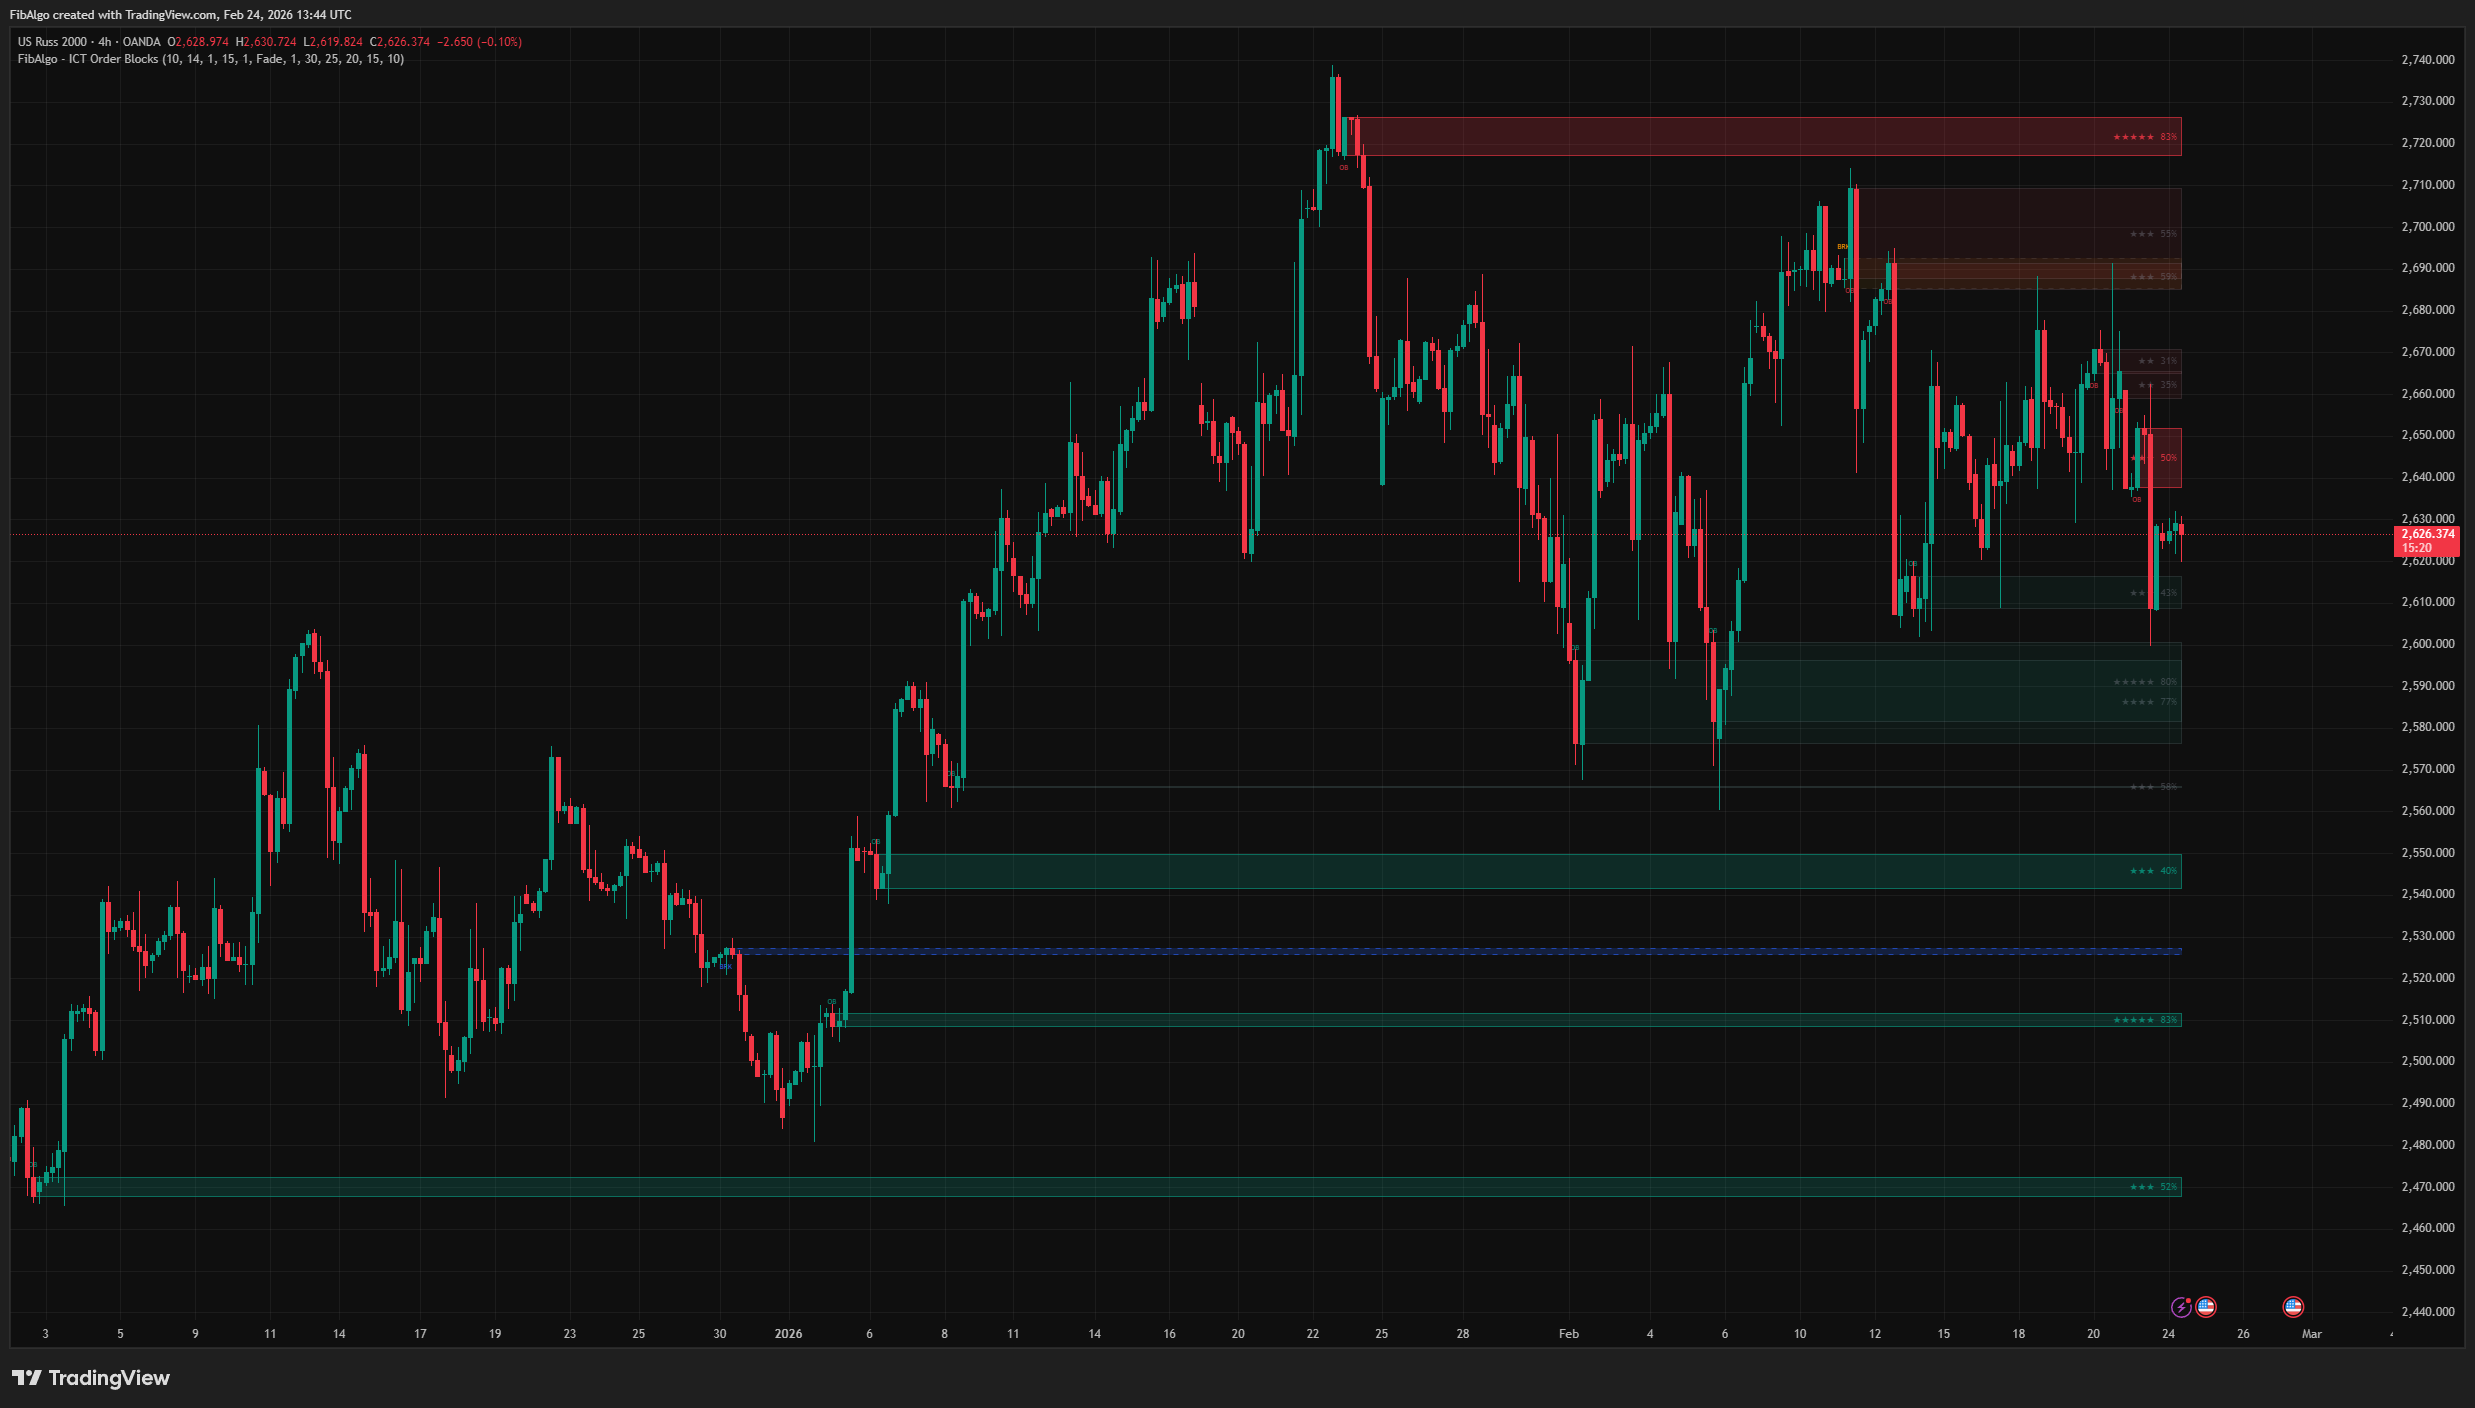
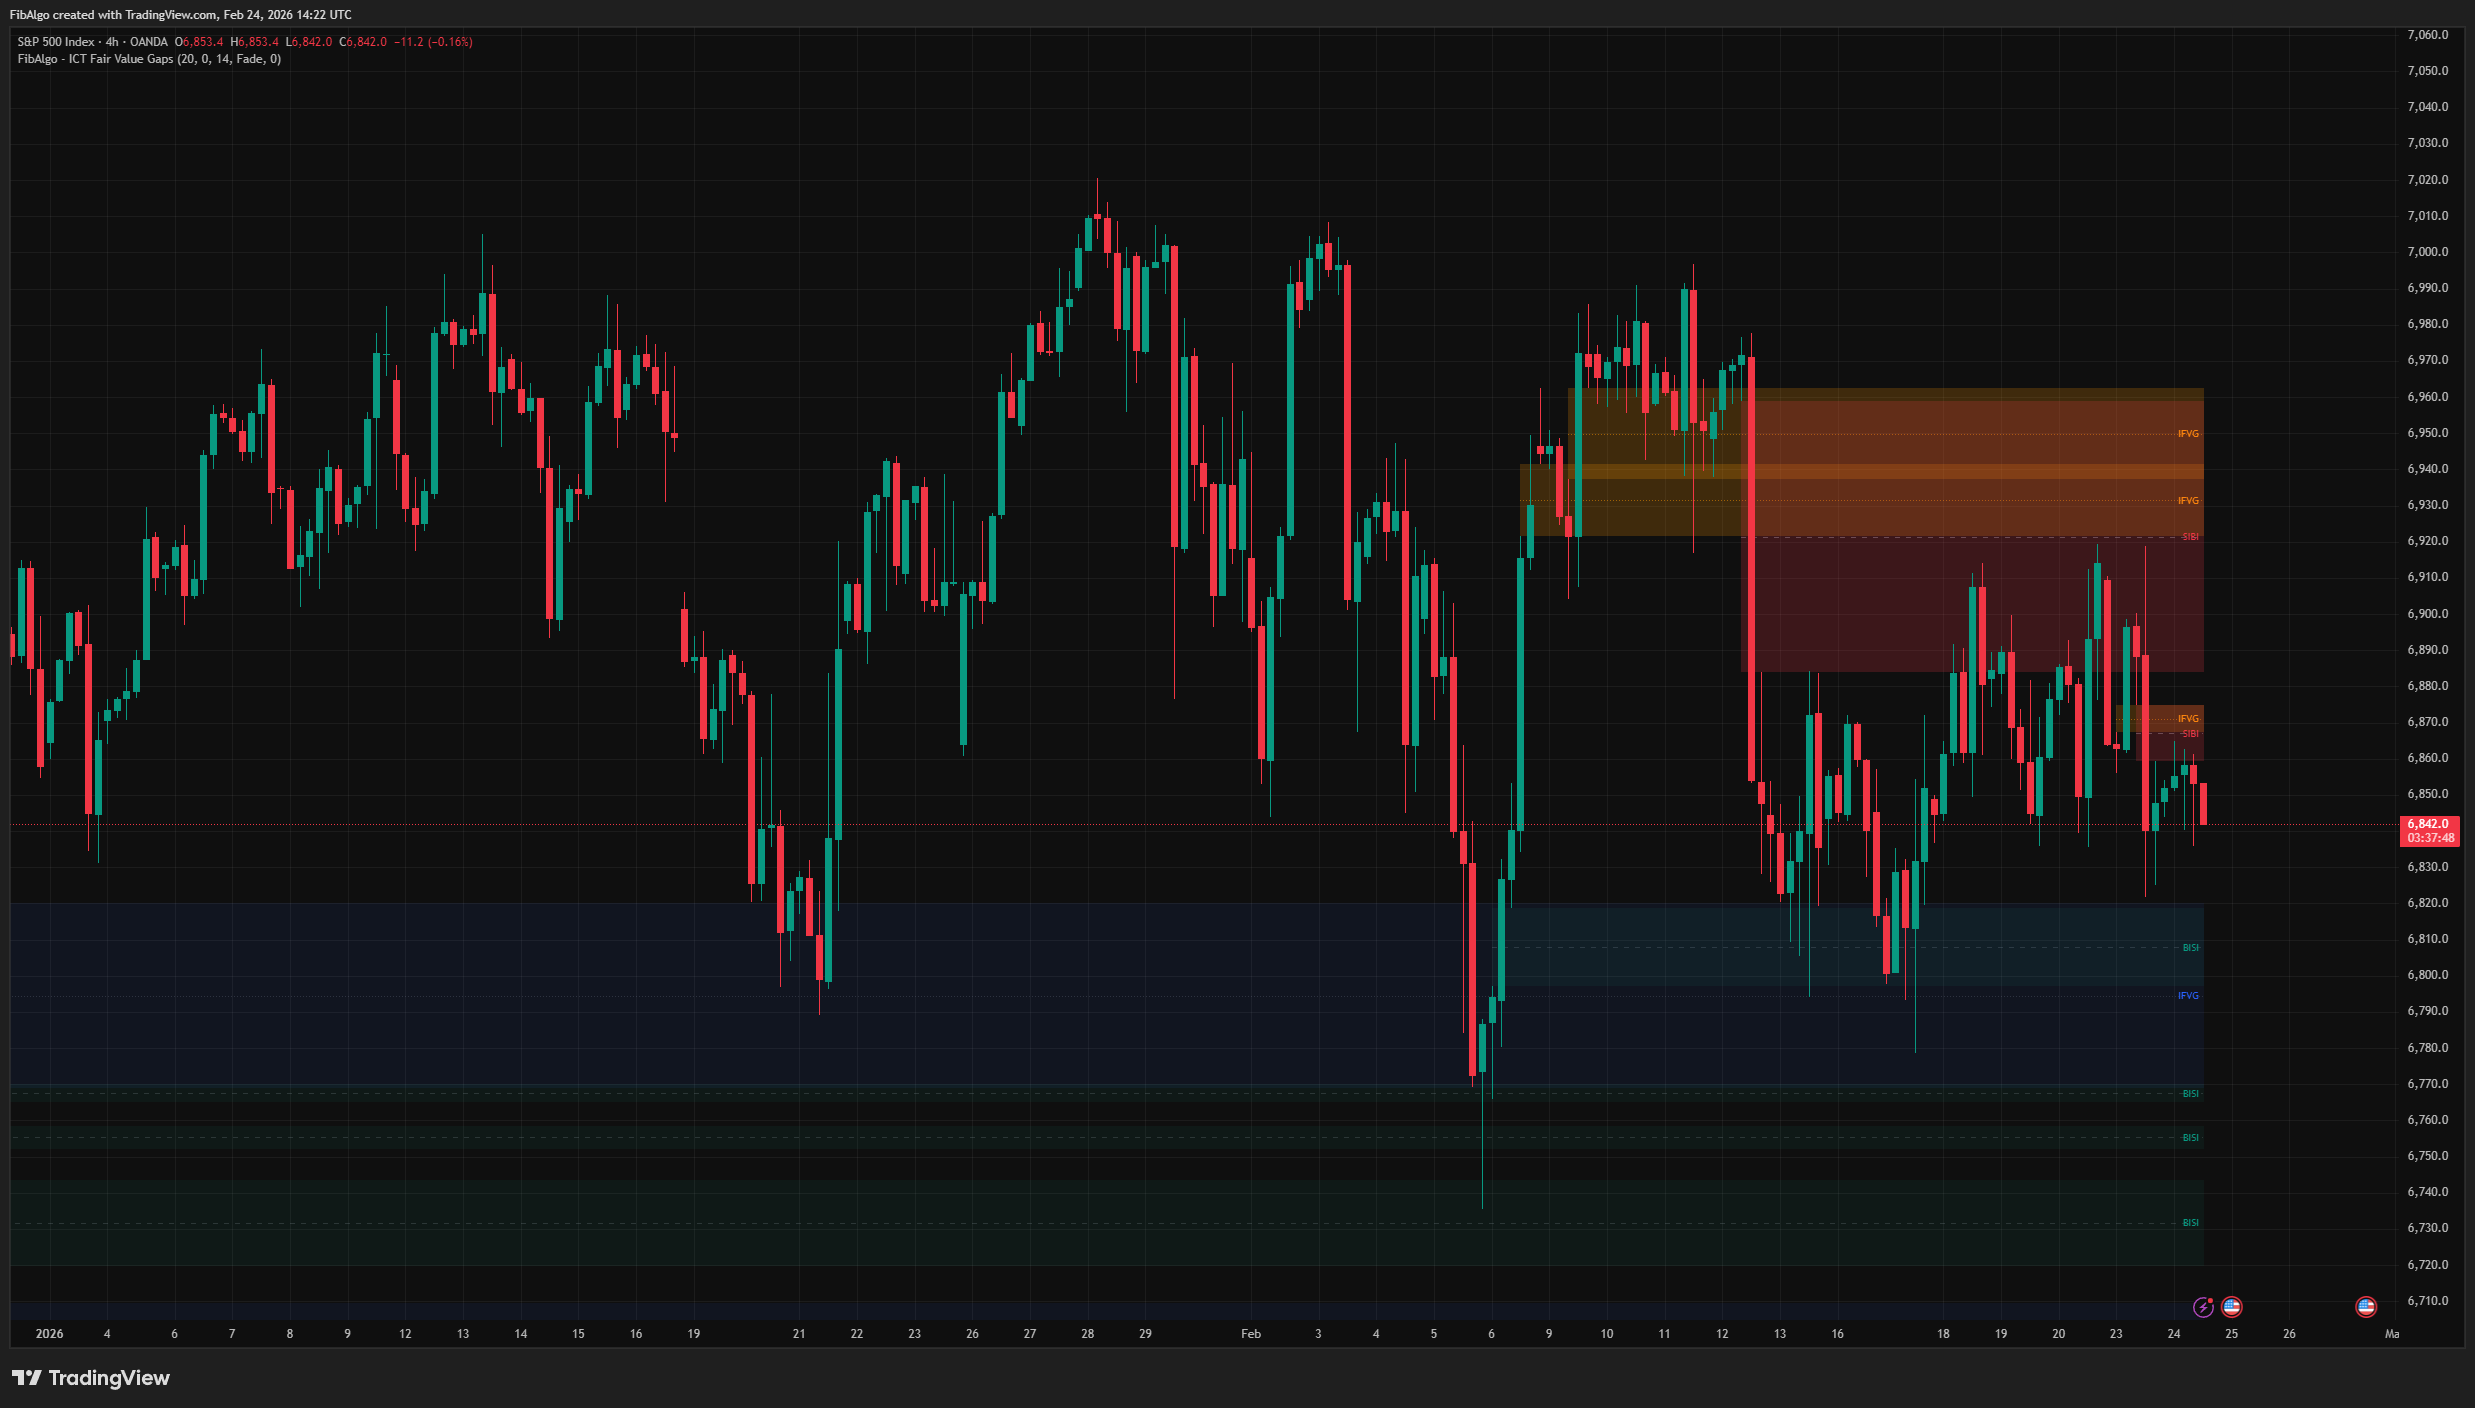
- Combine with ICT Tools: Liquidity levels work best alongside Order Blocks (where institutions placed orders), Fair Value Gaps (where price wants to rebalance), and Market Structure (BOS/CHoCH for trend direction). A sweep into an Order Block inside a FVG is a textbook ICT entry.
- Swing Length Tuning: Increase Swing Length to detect only major swing points (fewer, more significant levels). Decrease it for more granular liquidity mapping on lower timeframes.
Limitations
- Swing detection uses ta.pivothigh/ta.pivotlow, which require Swing Length bars to pass before confirmation. Levels appear with a delay equal to the Swing Length.
- HTF data is fetched via request.security. If the selected HTF is not higher than the chart timeframe, no HTF levels are created. The indicator validates this automatically.
- Equal H/L detection uses a percentage tolerance. On very low-priced instruments, the default 0.05% may need adjustment.
- Sweep detection checks wick vs. close on the same bar. Multi-bar sweep patterns (wick on bar 1, close back on bar 2) are not detected — only single-bar sweeps match the classic Turtle Soup definition.
- This indicator maps where liquidity rests and when it gets swept — it does not generate buy/sell signals. Combine with Order Blocks, Fair Value Gaps, market structure analysis, and proper risk management for complete trade setups.
Tags
#Liquidity#Smart Money#Support & Resistance