Overview
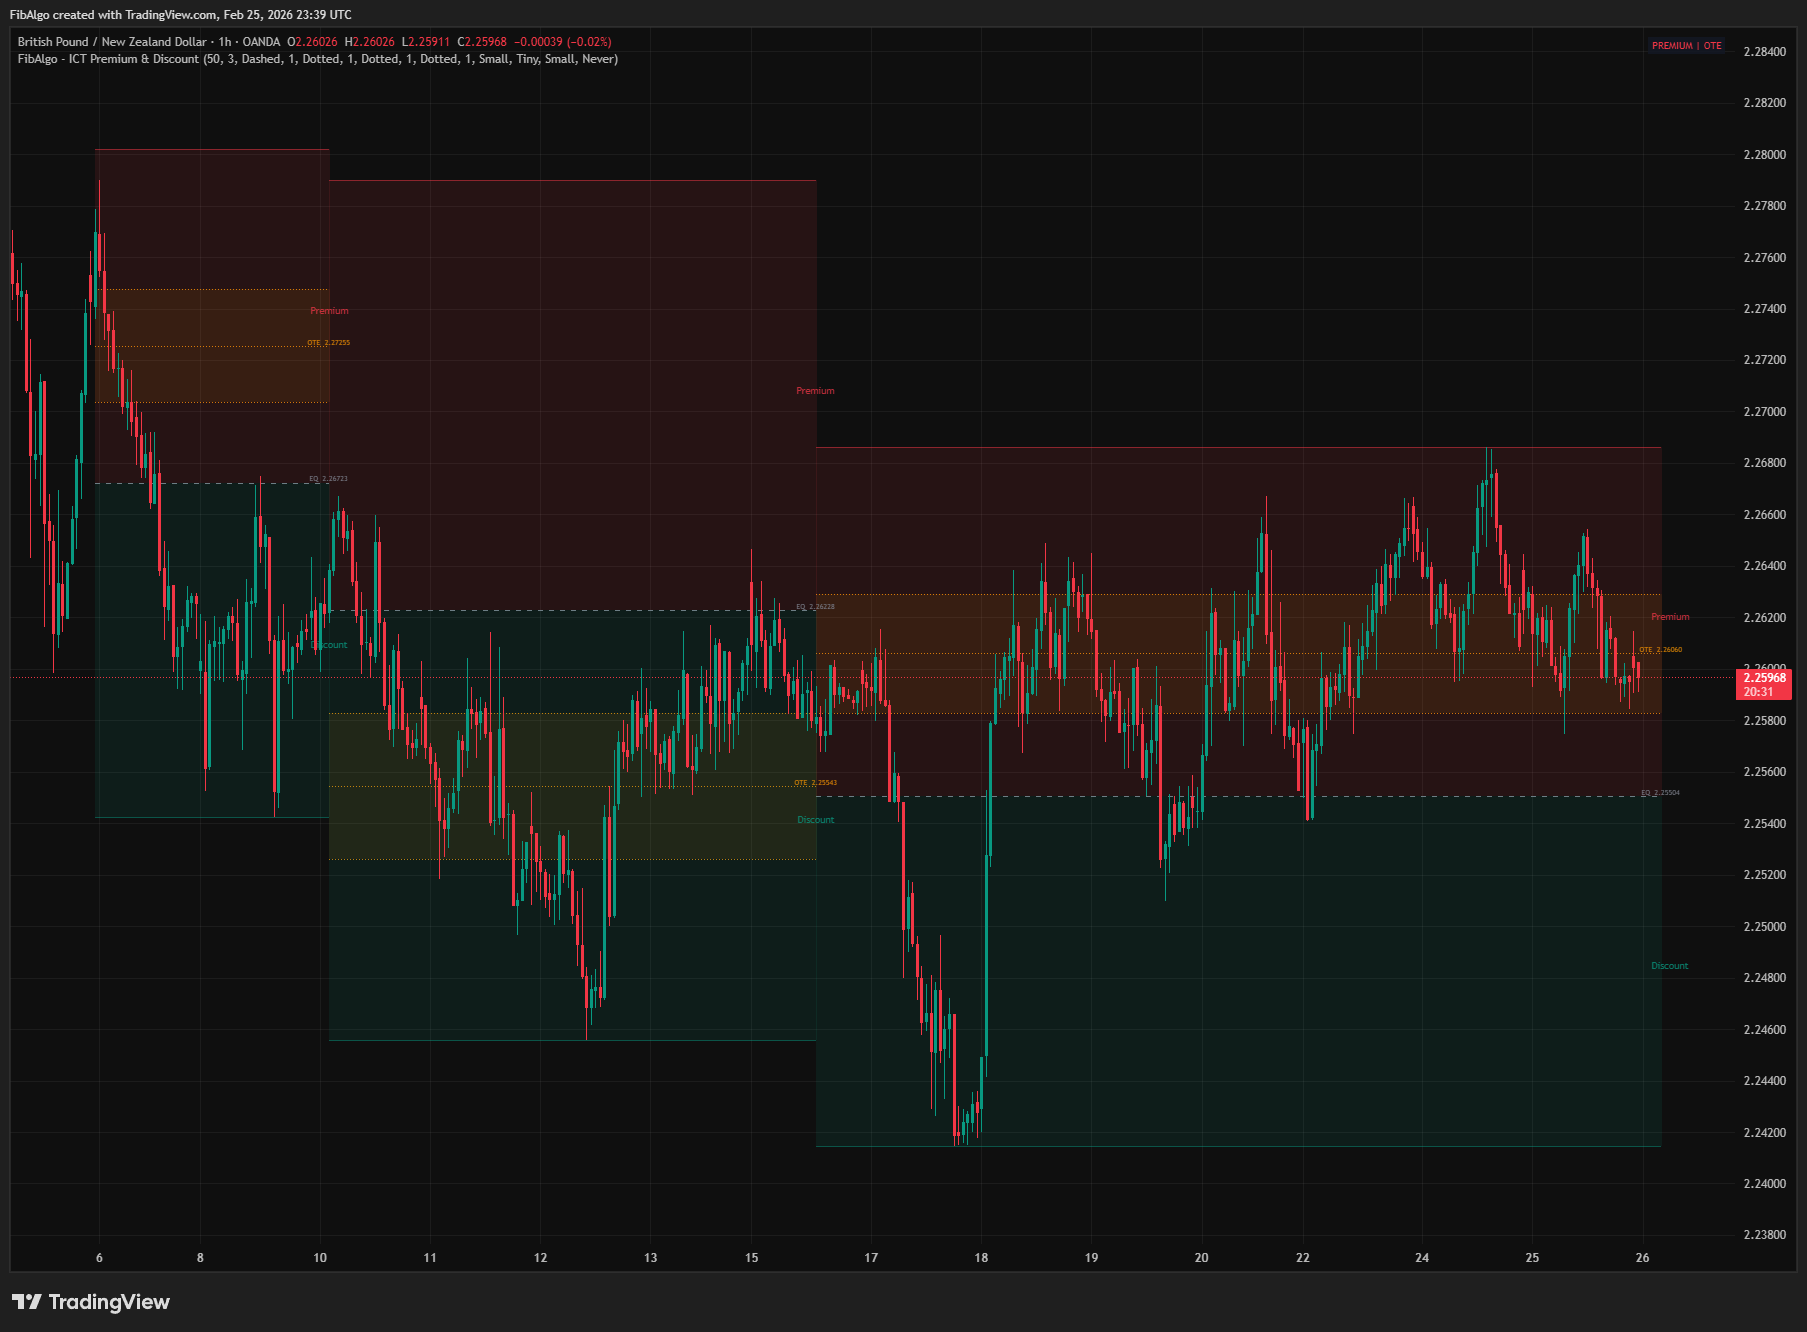
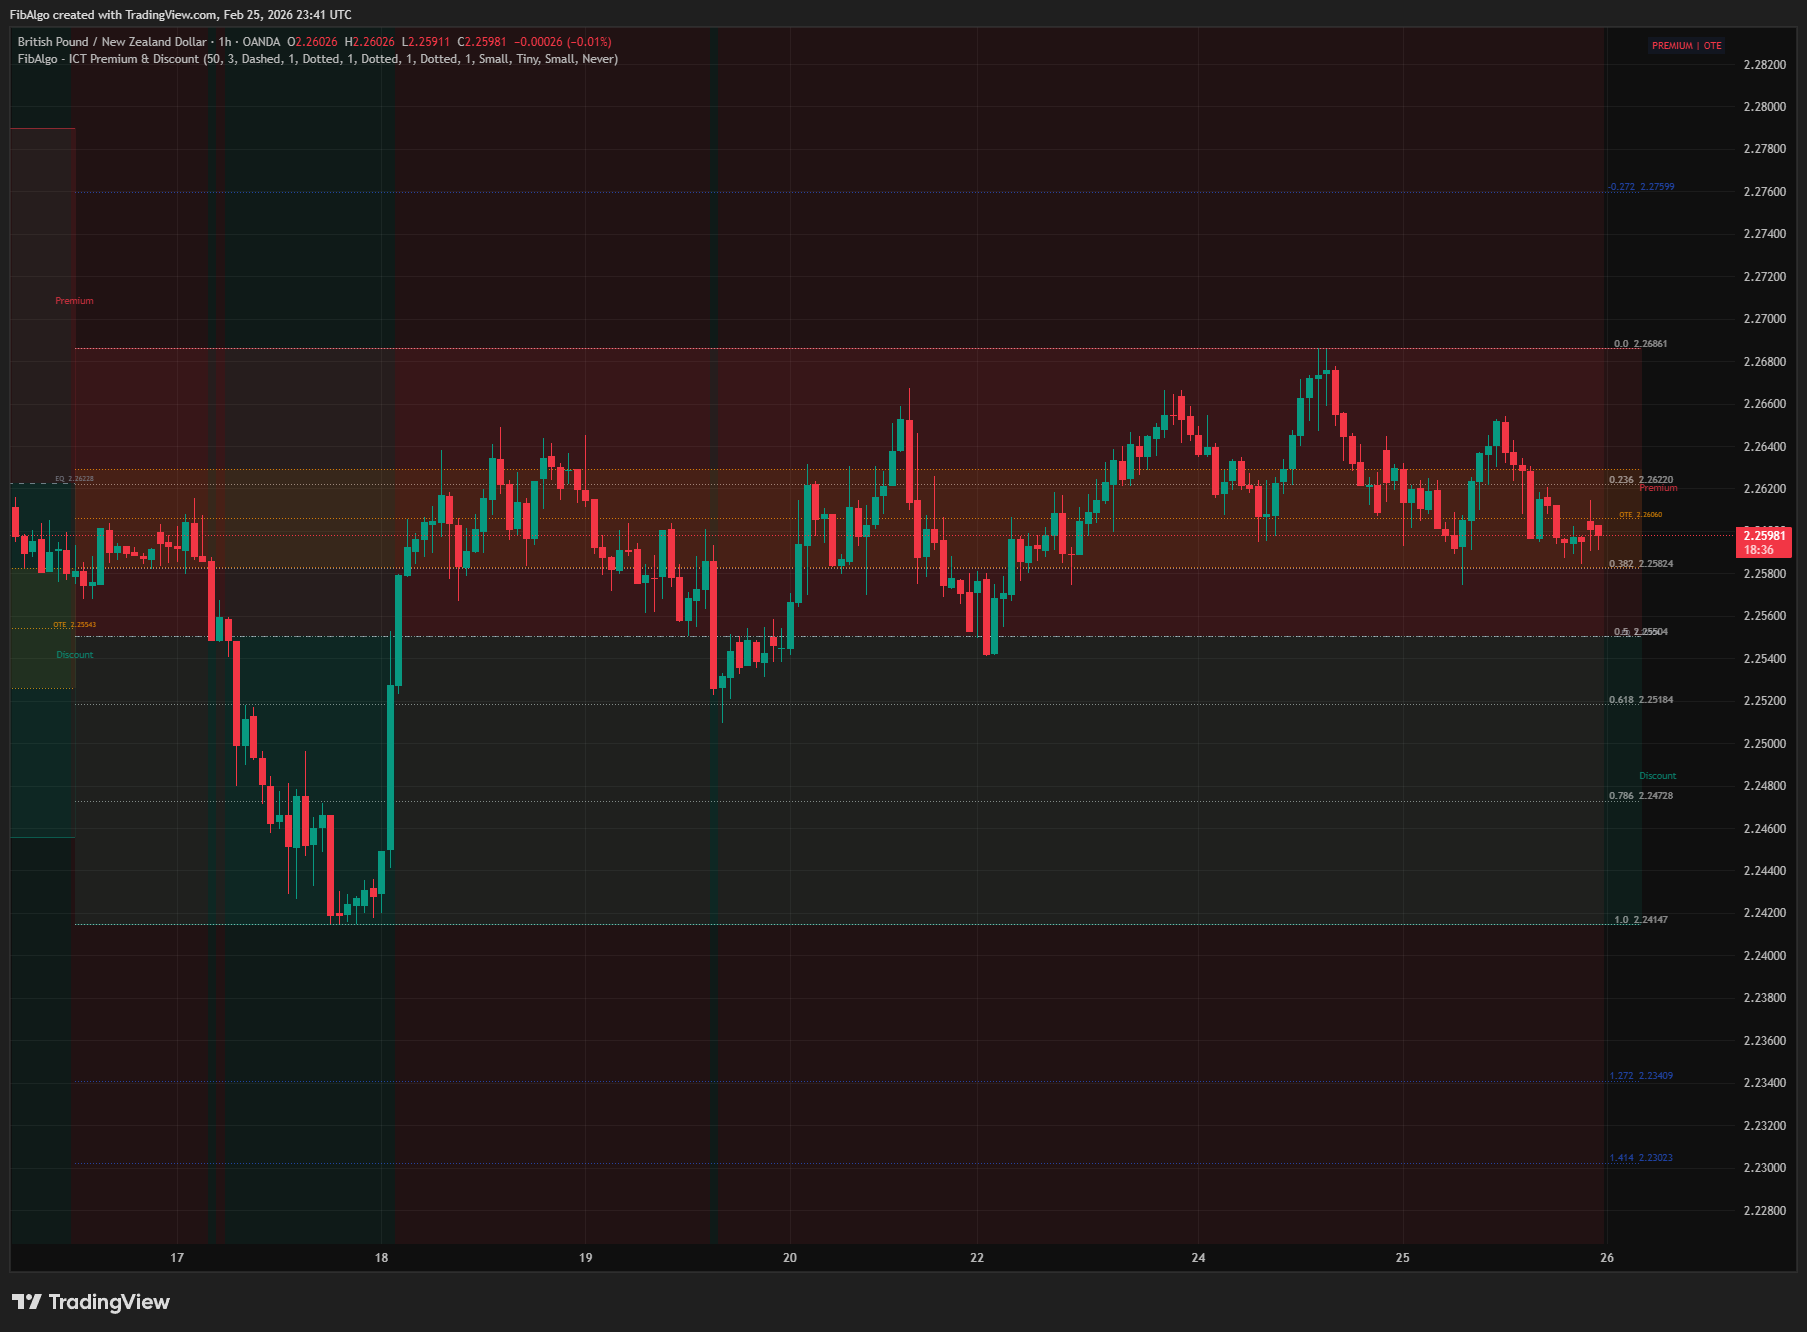
This indicator uses a real-time zigzag algorithm to dynamically detect dealing ranges and divide them into ICT's Premium and Discount zones. Unlike pivot-based tools, zones appear immediately — they grow and contract live as price develops, expanding in both directions whenever a new high or new low is made. The Equilibrium (EQ) line marks the 50% midpoint, the Optimal Trade Entry (OTE) zone highlights the 62%–79% Fibonacci retracement, and optional standard Fibonacci retracement and extension levels are drawn for the latest range. A real-time status table shows whether price is currently in the premium, discount, or OTE zone.
Key Concepts
- Premium Zone — The upper half of a dealing range, above Equilibrium. In ICT methodology, premium is the sell zone — institutional sellers fill orders in premium, especially during bearish conditions. Price in premium with bearish structure = look for shorts.
- Discount Zone — The lower half of a dealing range, below Equilibrium. Discount is the buy zone — institutional buyers accumulate positions in discount during bullish conditions. Price in discount with bullish structure = look for longs.
- Equilibrium (EQ) — The exact 50% midpoint of the dealing range. Price tends to react at EQ — it acts as dynamic support/resistance. A dashed line marks this level with its price label.
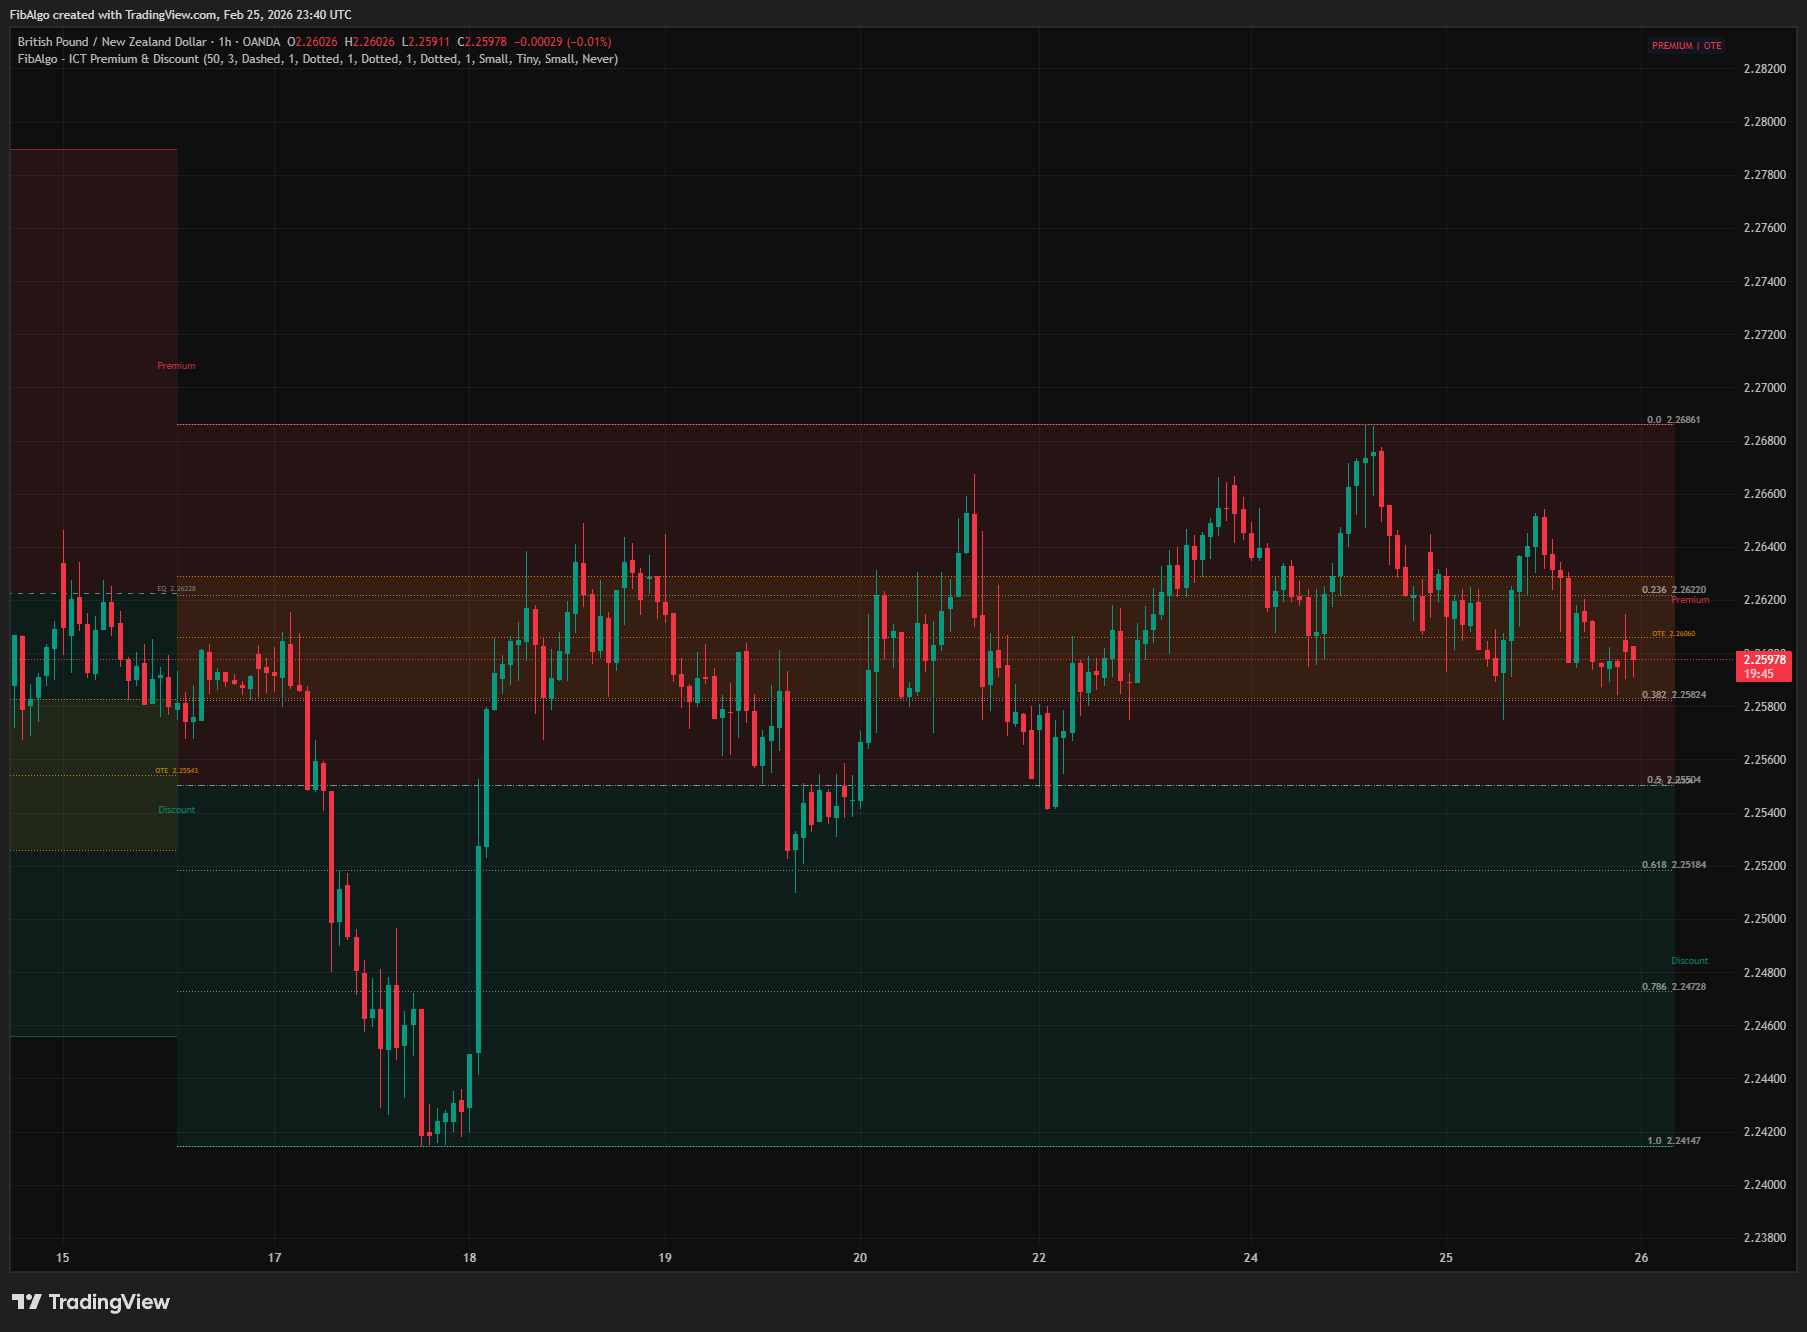
- Optimal Trade Entry (OTE) — The 62%–79% Fibonacci retracement zone inside the dealing range. This is ICT's preferred entry area. After a break of structure, price retraces into the OTE zone before continuing in the original direction. Key fib levels within OTE: 0.62, 0.705 (midpoint), 0.79.
- Dealing Range — The range between two alternating swing extremes detected by the zigzag. Each range dynamically expands as price makes new highs or lows, and freezes when a reversal is confirmed. A fresh Premium/Discount zone is created on every reversal. Thin structural lines at the swing high and swing low define the range boundaries.
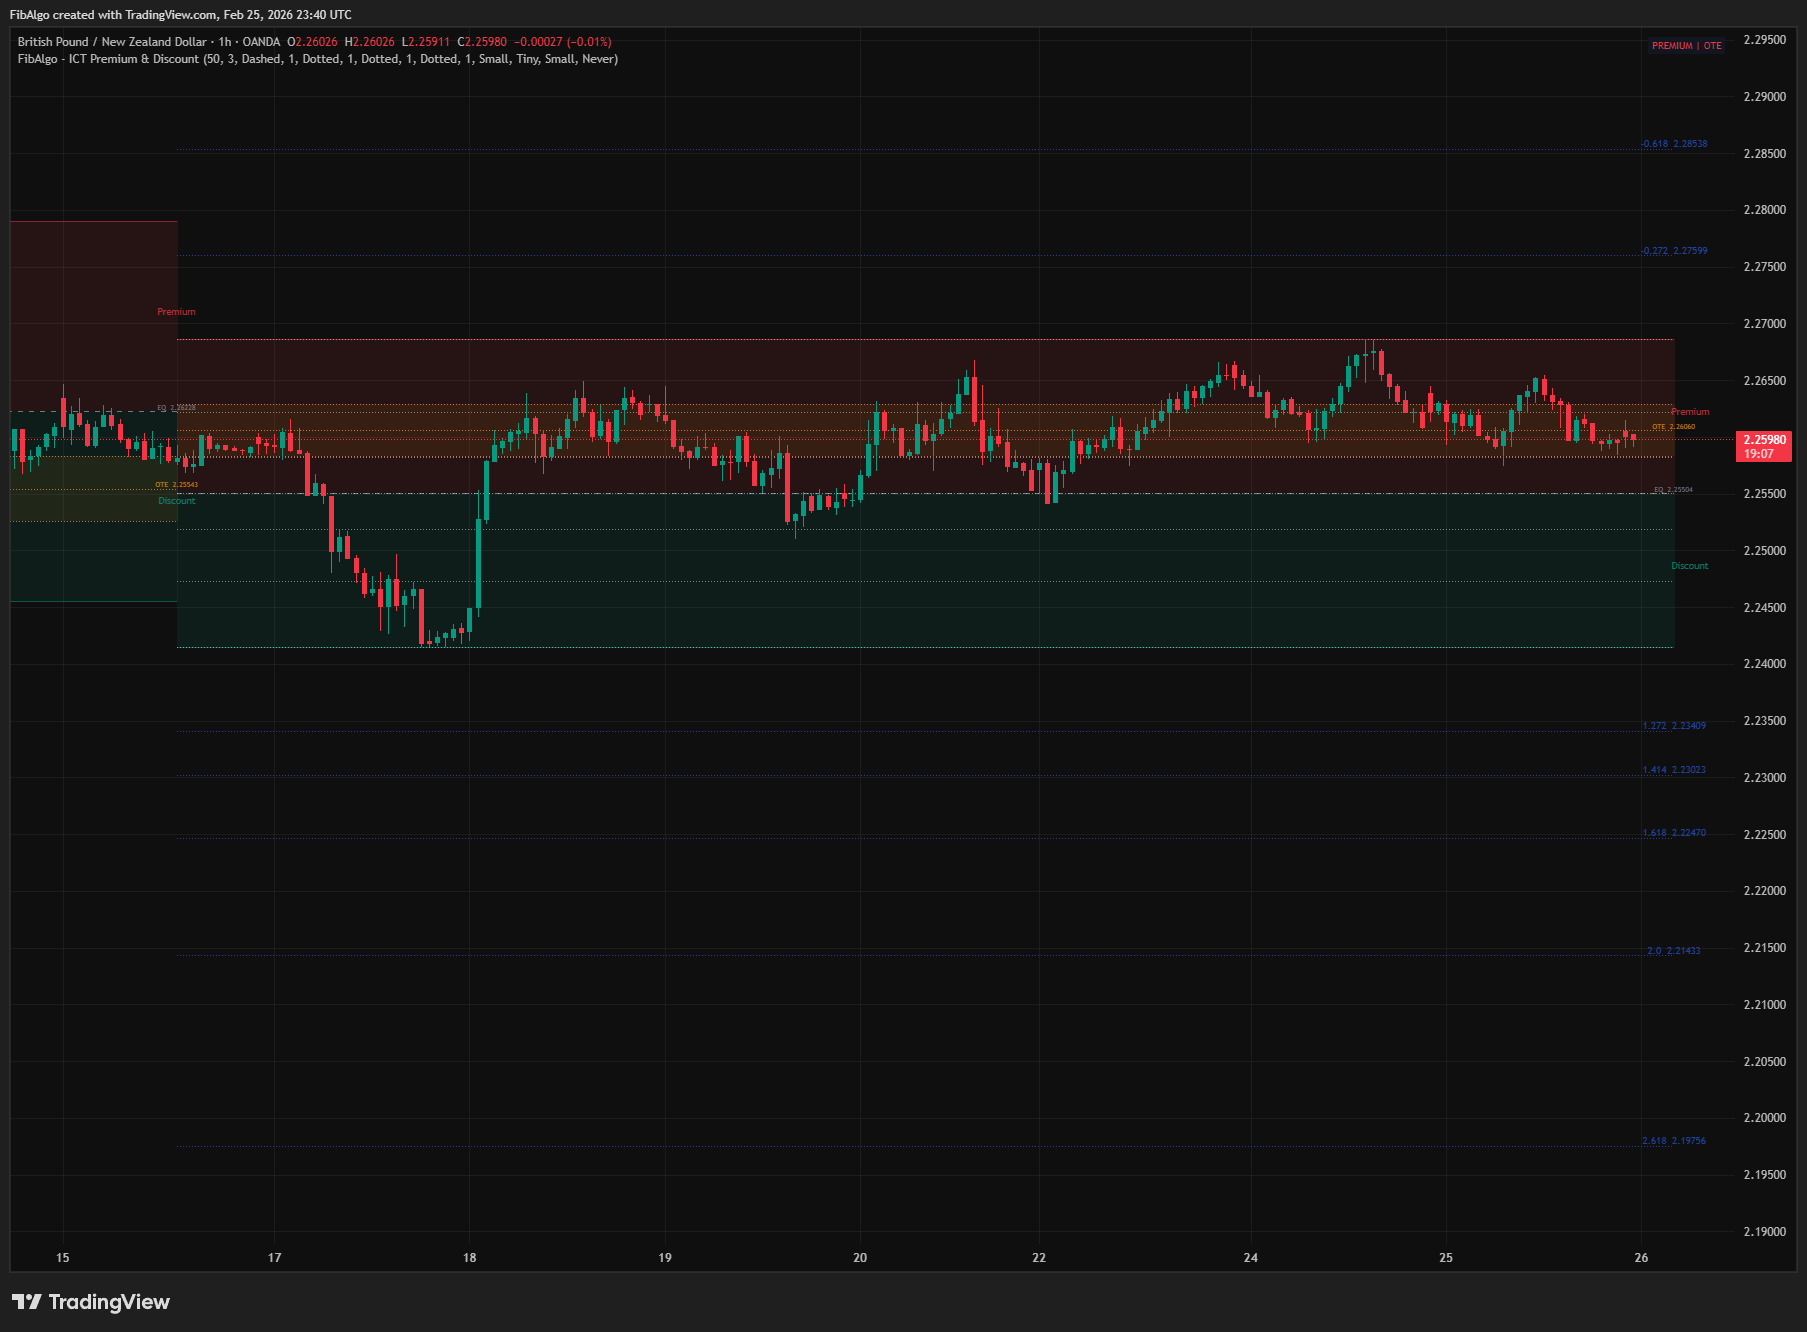
- Fibonacci Institutional Levels — Retracements (0.236, 0.382, 0.5, 0.618, 0.786) and extensions (-0.272, -0.618, 1.272, 1.414, 1.618, 2.0, 2.618). Extensions serve as institutional profit targets and expansion levels.
How It Works
1. Real-Time Zigzag Detection The indicator uses a custom zigzag algorithm — not delayed pivot functions. It tracks the developing extreme in the current trend direction and confirms a reversal when price fails to make a new high (uptrend) or new low (downtrend) for Swing Length bars. There is no lookback delay: the active zone updates in real time, growing with every new bar. The Swing Length parameter controls depth — common values are 20, 50, 55, 89, and 144 (Fibonacci-based). Larger values capture higher-timeframe institutional dealing ranges. 2. Dynamic Zone Creation & Growth When a zigzag reversal is confirmed, the previous zone is frozen at the exact reversal bar, and a new zone starts immediately at the same bar — seamless transition with no gap. The new dealing range is seeded from the confirmed zigzag extreme plus the full transition-period range, capturing any new highs or lows that occurred during the confirmation window. The range is divided at Equilibrium (50%): Premium (above EQ, red shading) and Discount (below EQ, green shading). As price develops, the active zone grows in both directions — whenever a new high or new low is made, all levels (EQ, OTE, boundary lines, boxes, labels) recalculate and update dynamically. 3. Optimal Trade Entry (OTE) Zone Within each dealing range, the OTE zone is highlighted as a separate colored band:- For bullish ranges (downtrend leg — buy in discount): OTE is in the discount half (0.62–0.79 retracement from the high toward the low). This is where ICT longs are entered.
- For bearish ranges (uptrend leg — sell in premium): OTE is in the premium half (0.62–0.79 retracement from the low toward the high). This is where ICT shorts are entered.
- Never (default) — zones persist until replaced by newer zones (capped by Max Zones). This matches how ICT ranges exist as reference levels until a new range forms.
- Close Beyond Range — zone is removed when a candle closes above the swing high or below the swing low.
- Wick Beyond Range — zone is removed when any wick pierces the boundaries.
Features
- Real-Time Zigzag Detection — Custom zigzag algorithm detects dealing ranges without pivot delay. Zones appear and grow immediately as price develops. Reversal is confirmed when no new extreme is made for Swing Length bars.
- Dynamic Bidirectional Growth — Active zones expand in both directions. Whenever price makes a new high OR a new low, the entire zone (boxes, lines, labels, OTE, EQ) recalculates and updates live.
- Seamless Zone Transitions — On reversal, the previous zone freezes at the exact bar and the new zone starts at the same bar. No gaps, no overlap between consecutive zones.
- Full Transition-Period Capture — When a new zone starts, it captures the complete range of the confirmation window, ensuring no price extremes are missed during the reversal.
- Premium & Discount Zones — Soft red and green semi-transparent boxes divide each range at Equilibrium. Borderless design keeps the chart clean — range boundaries are defined by separate structural lines.
- Range Boundary Lines — Thin structural lines at the swing high (red-tinted) and swing low (green-tinted) clearly define where each dealing range starts and ends.
- Equilibrium Line — Dashed line at the 50% midpoint with price label. Key reaction level for institutional order flow.
- OTE Zone Highlight — The 62%–79% Fibonacci retracement band highlighted as a distinct soft zone. OTE automatically positions in discount for bullish ranges and premium for bearish ranges.
- OTE Fibonacci Lines — Individual dotted lines at 0.62, 0.705 (midpoint), and 0.79 with configurable color, style, and width.
- Standard Fibonacci Levels — Optional retracement levels: 0.0, 0.236, 0.382, 0.5, 0.618, 0.786, 1.0. Applied to the latest dealing range.
- Extension Targets — Optional extension levels: -0.272, -0.618, 1.272, 1.414, 1.618, 2.0, 2.618. Institutional profit-taking and expansion targets.
- Multi-Zone Display — Up to 10 simultaneous zones (configurable). Oldest zones are removed when the cap is reached. Frozen zones keep their last state.
- Smart Invalidation — Three modes: Never (default), Close Beyond Range, Wick Beyond Range. Invalidated zones are fully cleaned up (all boxes, lines, labels removed).
- Real-Time Status Table — Top-right table displays PREMIUM, DISCOUNT, or OTE status for the latest zone when price is within range.
- Background Tint — Optional chart background coloring based on premium/discount position for quick visual bias identification.
- Independent Label Sizes — Three separate size controls: Zone Label Size (Premium/Discount text, supports Large), Price Label Size (EQ/OTE values), Fib Label Size (retracement and extension levels). All adjustable from settings.
- Alert System — 4 alert types: New P/D Zone, Equilibrium Touch, OTE Zone Entry, Zone Invalidated. Master enable toggle. All alerts include symbol, timeframe, and price details.
- Full Customization — Independent color, style, width, and toggle controls for every visual element across 8 organized settings groups.
How to Use
- Buy in Discount, Sell in Premium: This is the core ICT principle. When price is in the discount zone with bullish market structure, look for long entries. When price is in premium with bearish structure, look for shorts. The status table confirms your position instantly.
- OTE for Precision Entries: After a break of structure (BOS), wait for price to retrace into the OTE zone (0.62–0.79). This is where smart money places entries. Combine with Order Blocks or Fair Value Gaps within the OTE for confluence.
- EQ as Support/Resistance: Equilibrium acts as a dynamic level. In bullish conditions, price often finds support at EQ. In bearish conditions, EQ acts as resistance. Watch for reactions when the EQ Touch alert fires.
- Swing Length Tuning: Use Swing Length 10–20 for short-term ranges (scalping/day trading). Use 50–89 for higher-timeframe institutional ranges (swing trading). 144–233 captures major structural ranges. Common Fibonacci values: 21, 34, 55, 89, 144.
- Watch the Zone Grow: The active zone dynamically expands as price makes new highs or new lows. This shows the live dealing range in real time — no waiting for confirmation. When the zone stops growing and a reversal is confirmed, a new zone starts seamlessly.
- Invalidation as Confirmation: When a zone is invalidated (price closes beyond range), it confirms that the dealing range is broken. This often signals a new trend leg. Default is "Never" — zones persist as reference levels until replaced.
- Extensions as Targets: Enable Extension Targets to see where institutional profit-taking occurs. The -0.272 and 1.272 levels are common first targets; 1.618 and 2.618 are expansion targets.
- Combine with ICT Tools: Premium/Discount tells you WHERE in the range to trade. Pair with Market Structure (direction), Order Blocks (entry zones), Fair Value Gaps (rebalancing), Killzones (timing), and Liquidity Levels (stop hunts) for complete ICT analysis.
Limitations
- The zigzag confirms a reversal after Swing Length bars without a new extreme. This is not a delay in the traditional pivot sense — the active zone grows live during this period — but the reversal event itself fires after Swing Length bars of non-extension.
- Because zones grow dynamically, EQ, OTE, and all Fibonacci levels shift on every bar where a new extreme is made. Set alerts for specific events (EQ Touch, OTE Entry) rather than relying on visual positions that may move.
- Multiple zones may overlap when Swing Length is small and Max Zones is high. Increase Swing Length or reduce Max Zones if the chart becomes too cluttered.
- Fibonacci retracement and extension levels are drawn only for the most recent zone to avoid visual clutter. Older zones display Premium/Discount boxes, EQ, and OTE only.
- This indicator identifies Premium/Discount zones and OTE areas — it does not generate buy/sell signals. Combine with ICT Market Structure, Order Blocks, Fair Value Gaps, and Killzones for a complete trading framework.
Tags
#Smart Money#Support & Resistance#Fibonacci