Overview
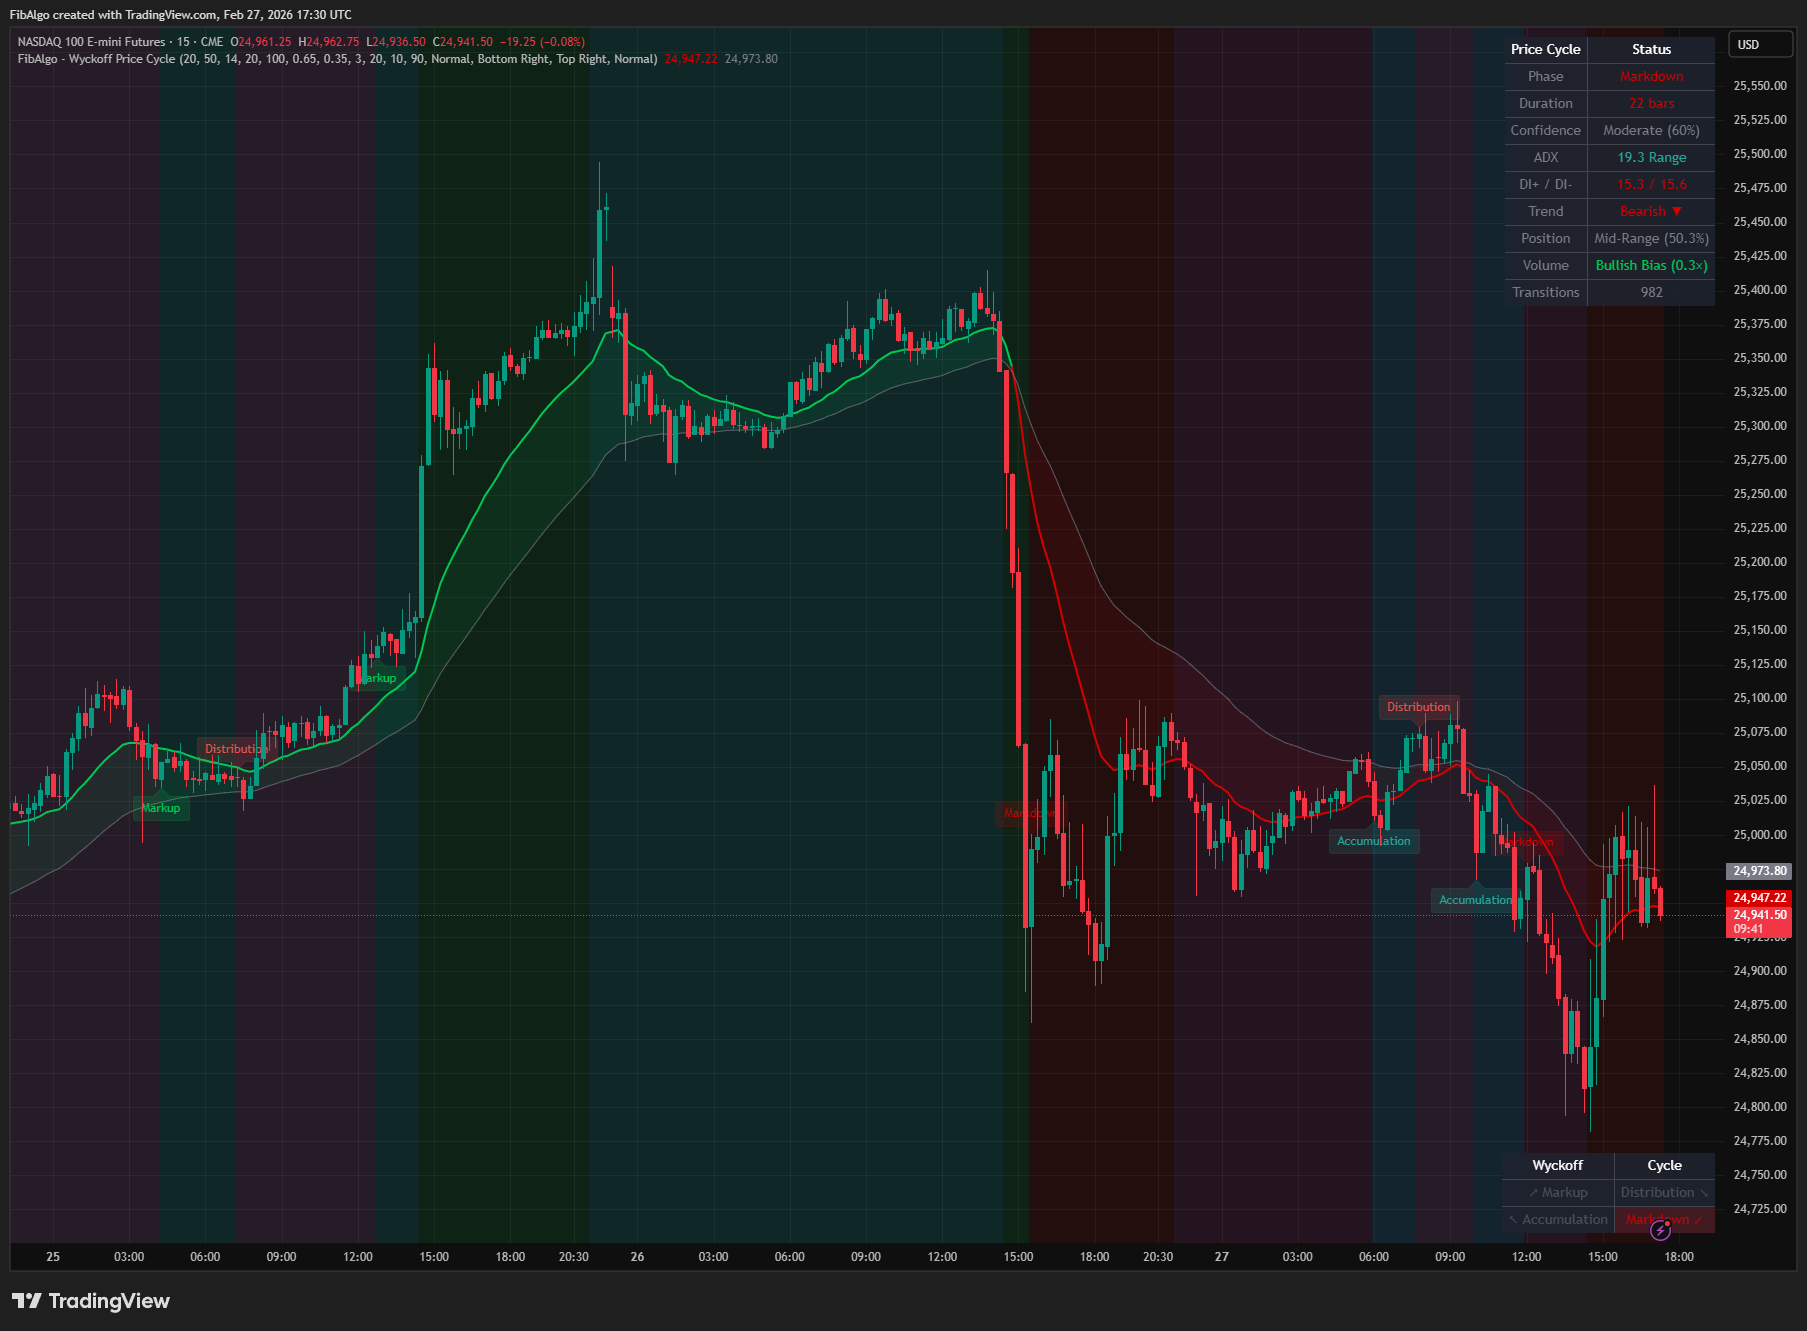
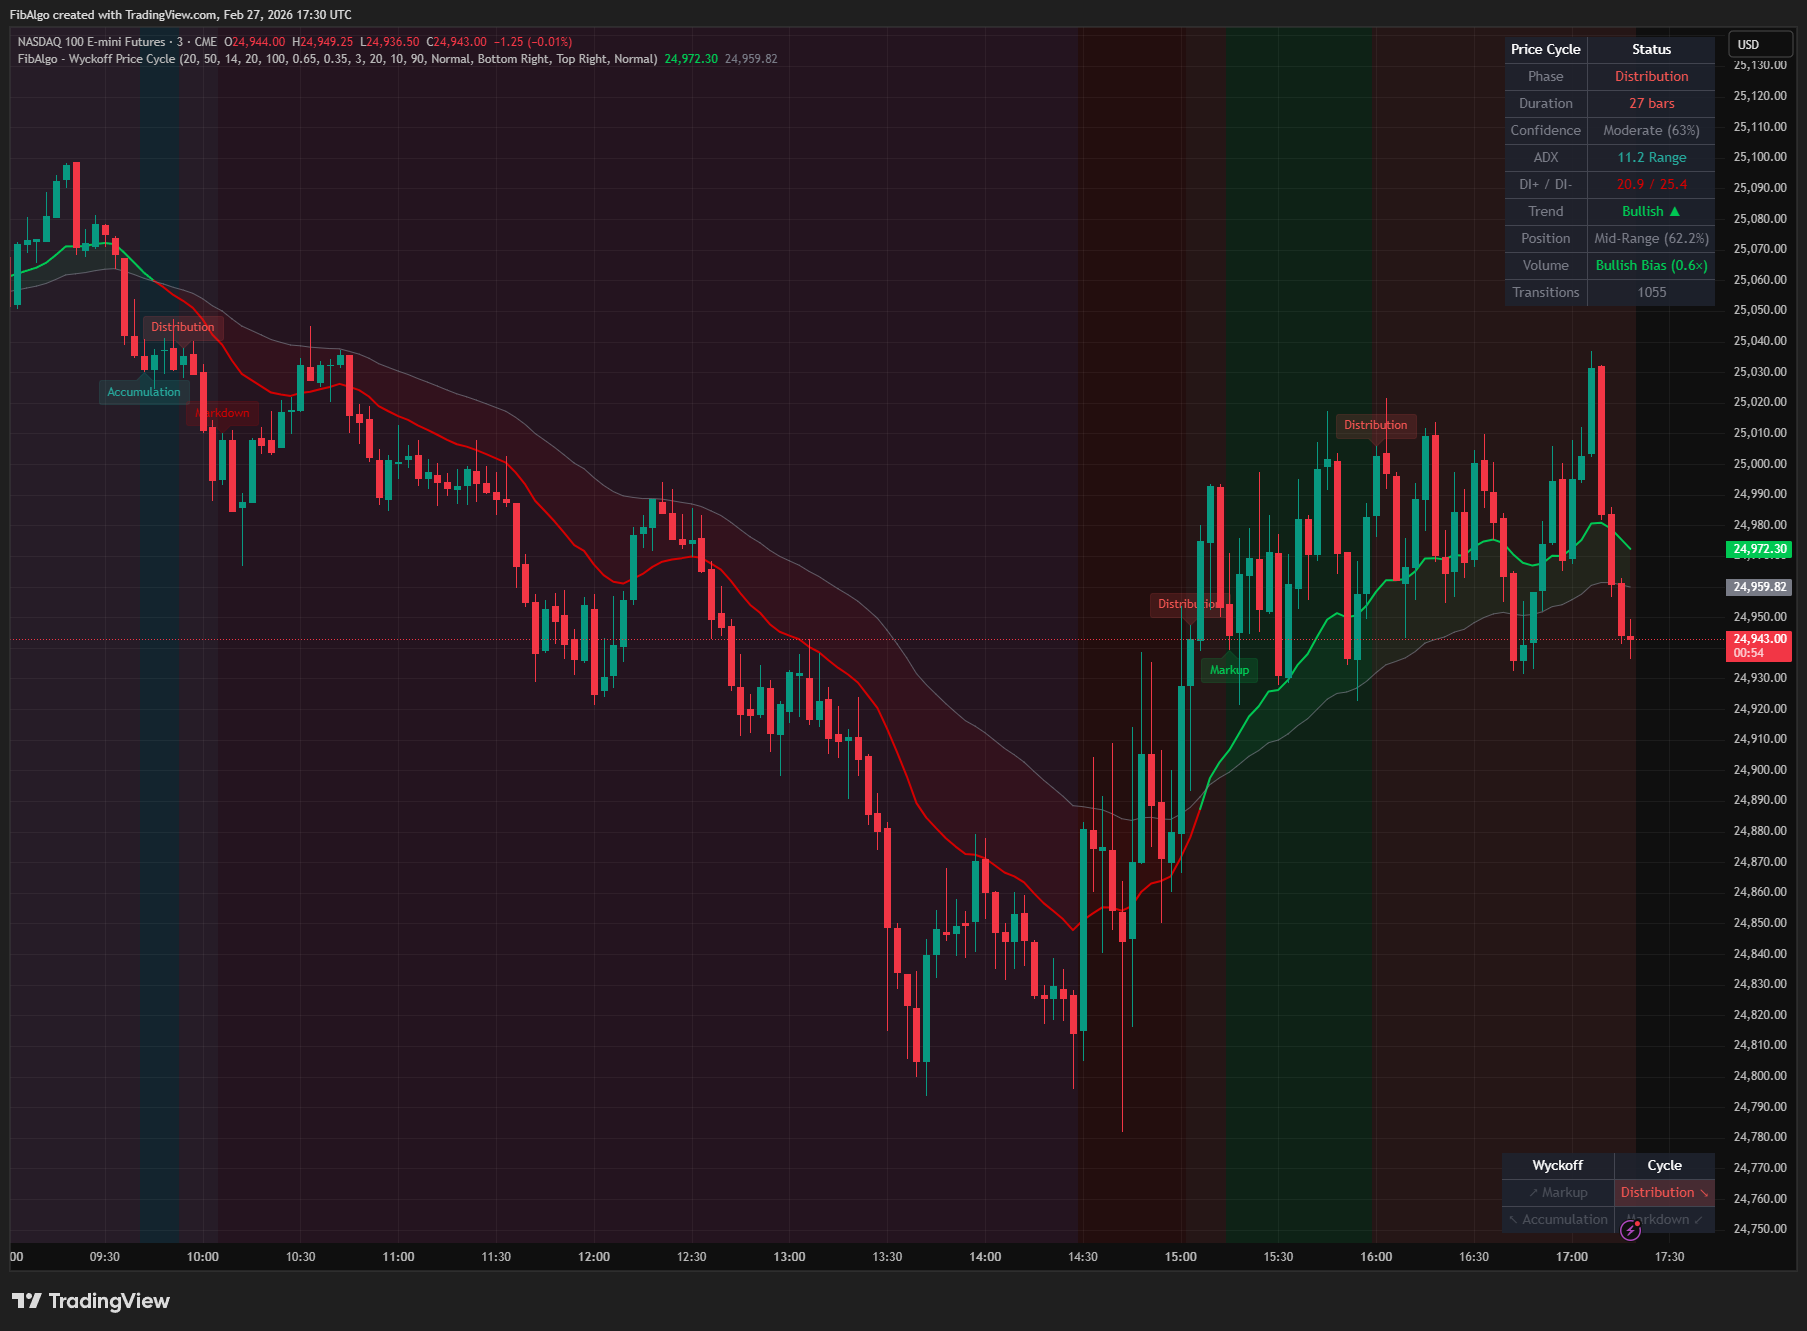
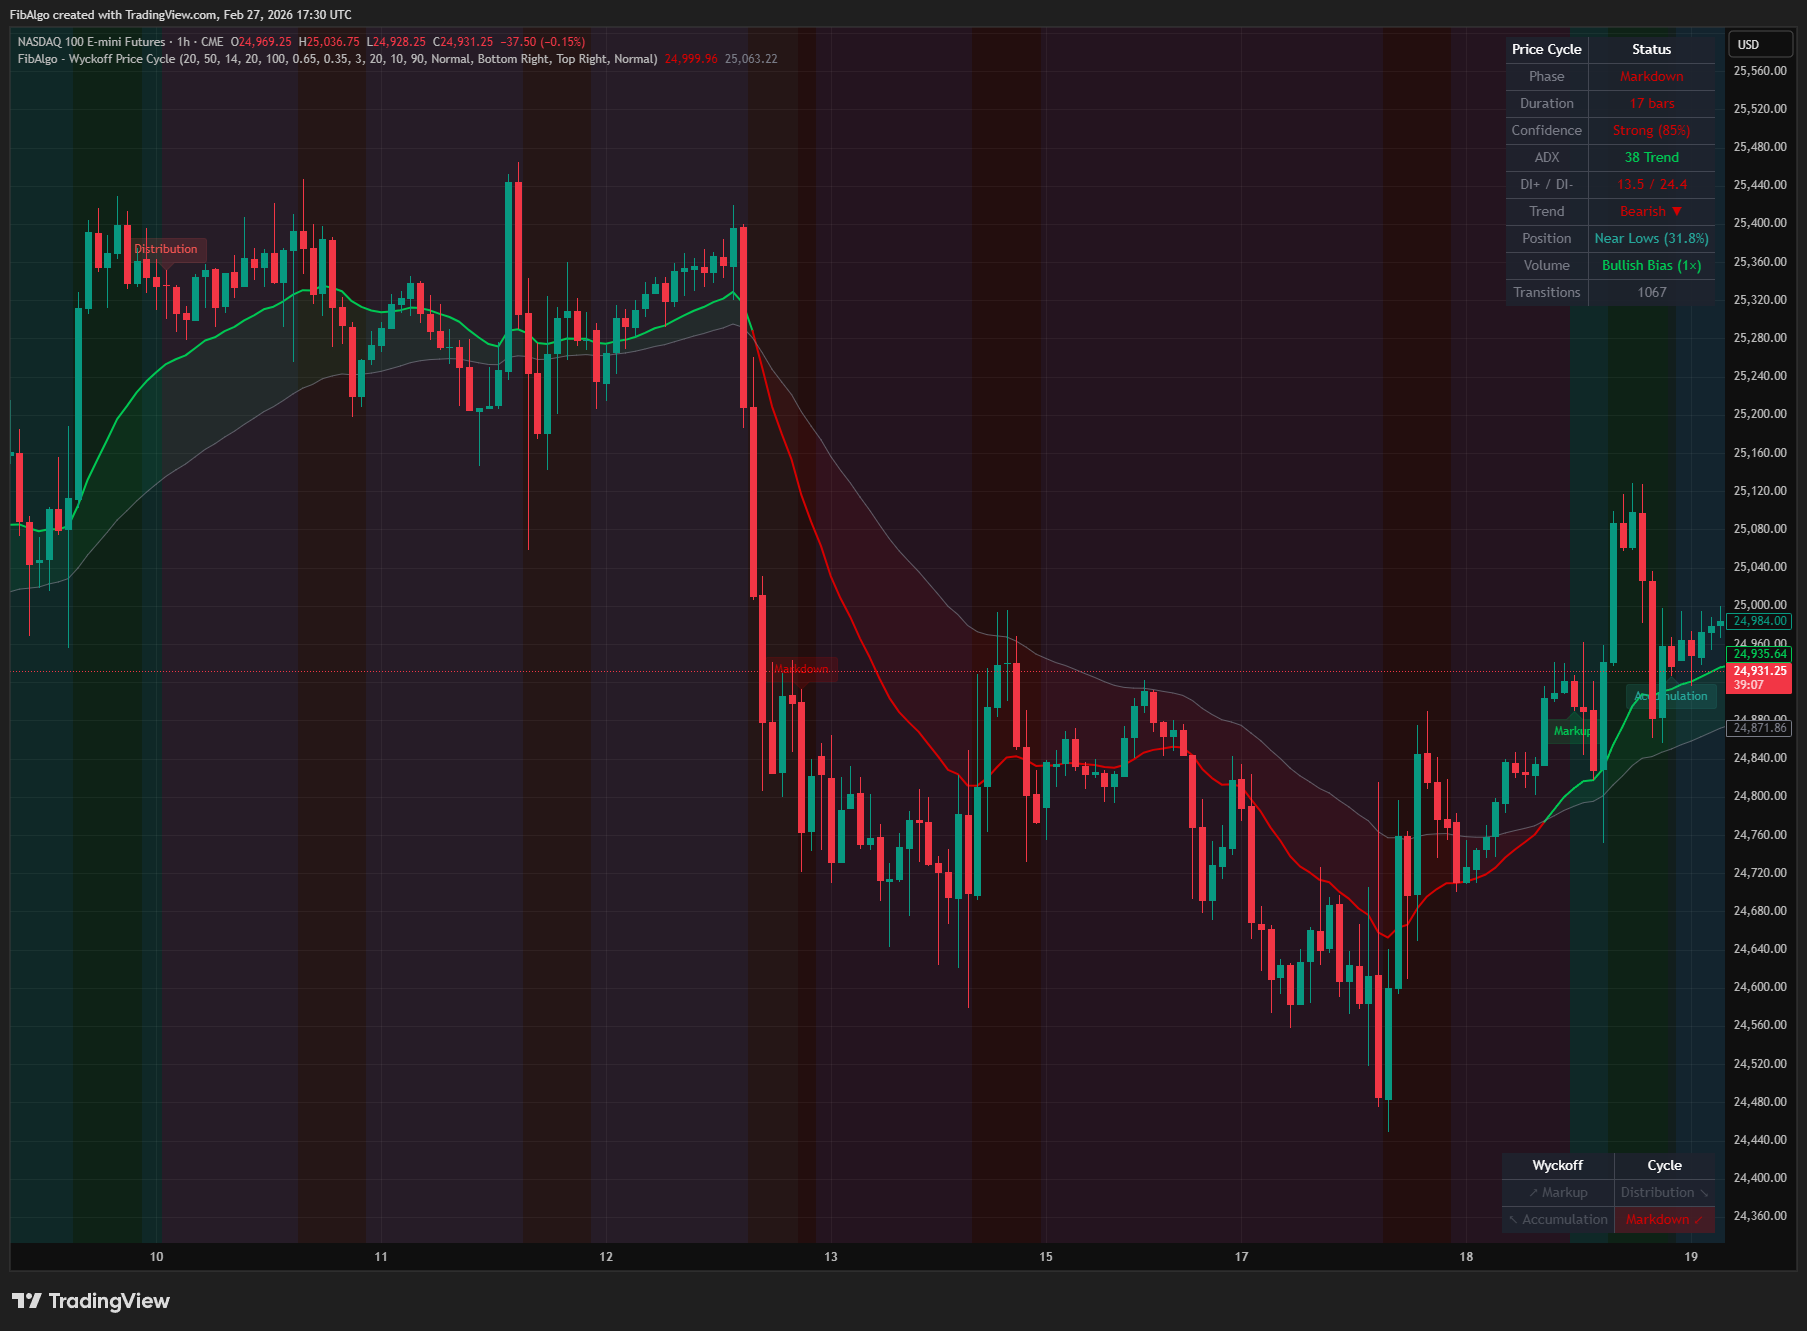
FibAlgo - Wyckoff Price Cycle identifies and visualizes the four fundamental phases of the Wyckoff market cycle: Accumulation, Markup, Distribution, and Markdown. By combining EMA trend direction, ADX trend strength, price position within range, and volume bias analysis, the indicator classifies the current market phase in real time. Phase transitions are labeled directly on the chart, background coloring provides instant visual context, and a multi-factor confidence score grades the reliability of each phase detection.
Key Concepts
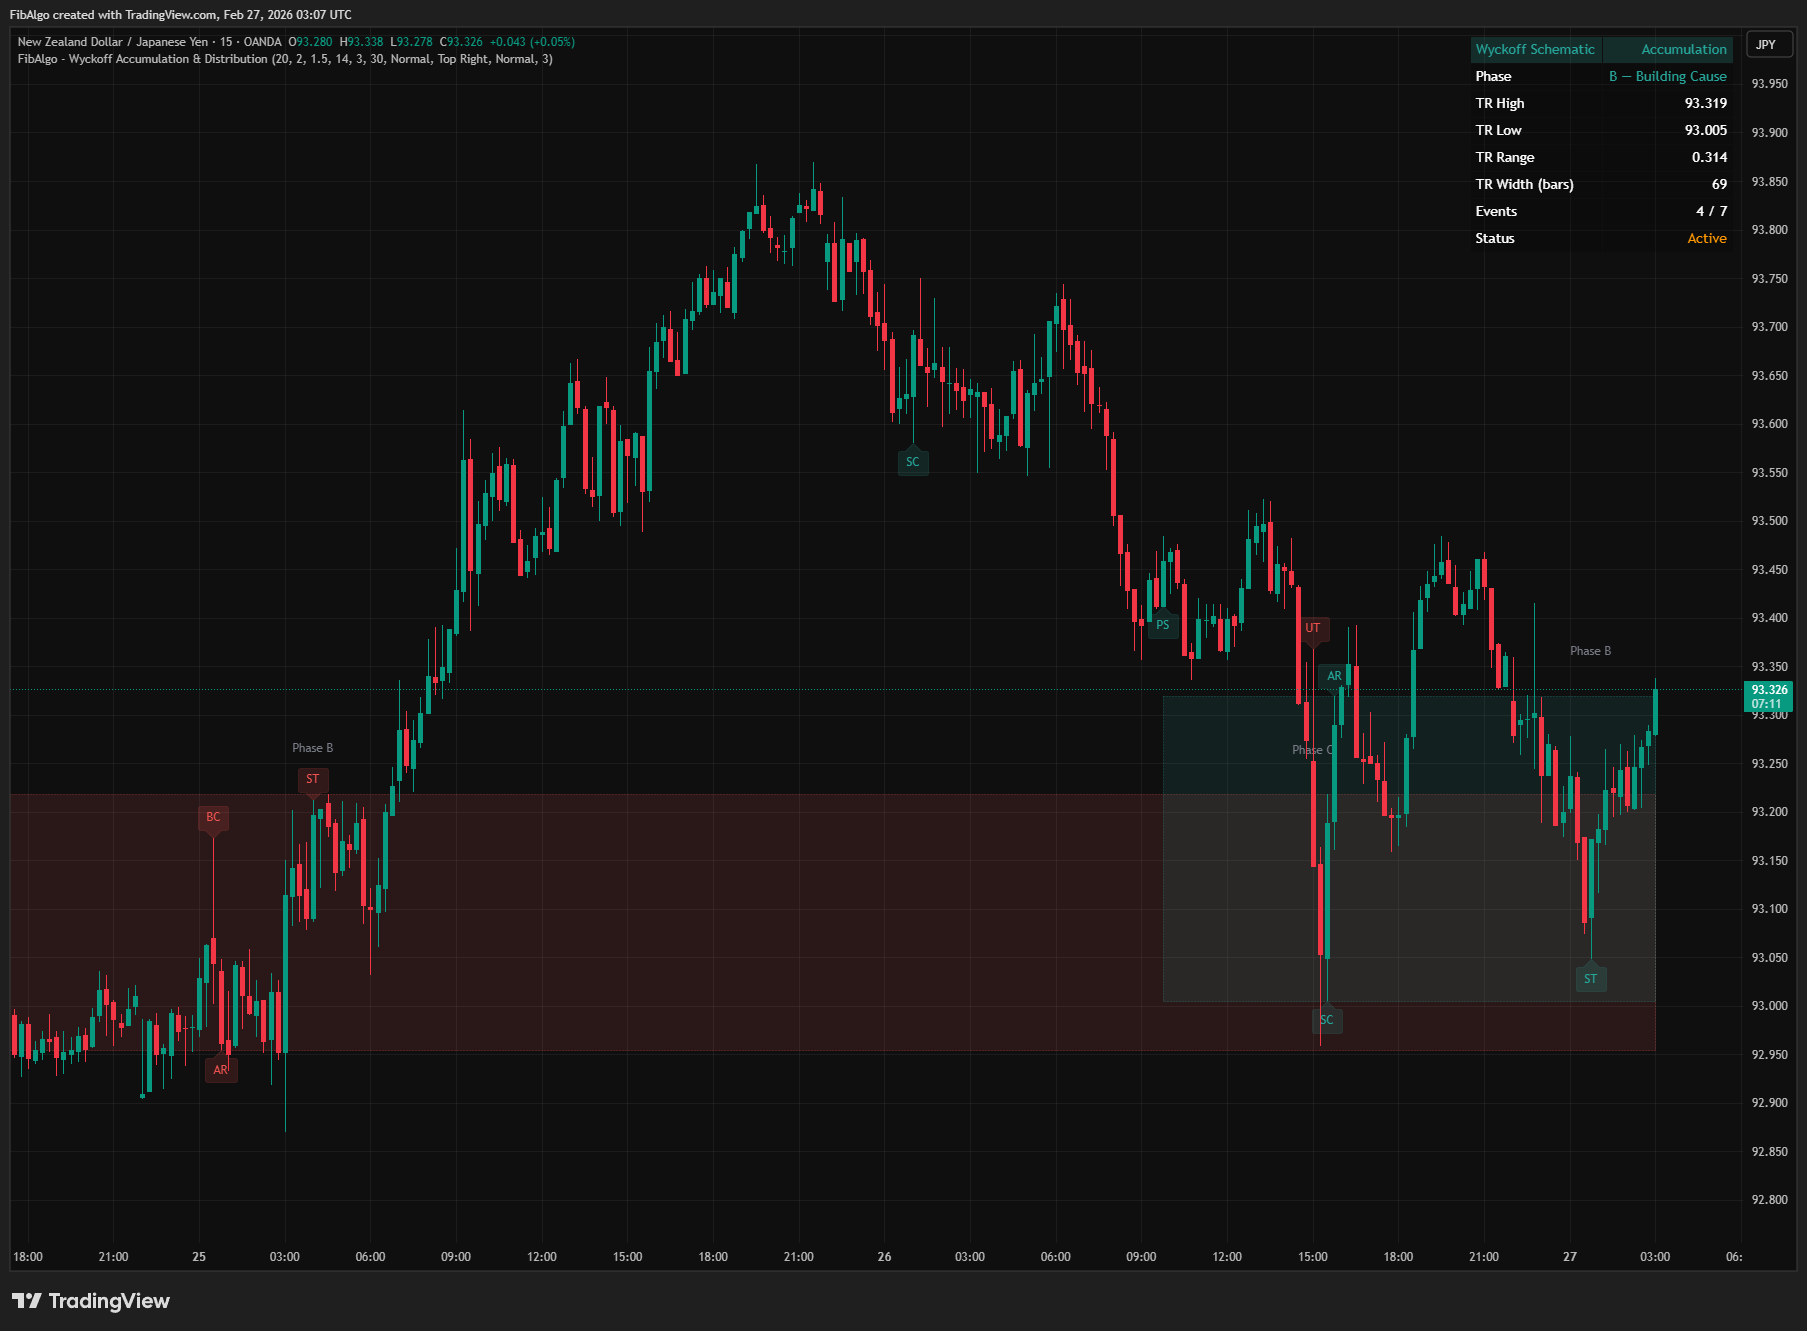
- Wyckoff Price Cycle — Richard D. Wyckoff's model describes the market's perpetual rotation through four phases: Accumulation (institutions buy quietly), Markup (uptrend), Distribution (institutions sell quietly), and Markdown (downtrend). Understanding which phase the market is in provides critical context for all trading decisions.
- Accumulation — A sideways trading range at the bottom where informed participants accumulate shares from the public. Volume diminishes on dips and increases on rallies. Price is near the lower end of its range. ADX is low, indicating a ranging market.
- Markup — The uptrend phase where demand is in control. Price advances with higher highs and higher lows. ADX is elevated, the fast EMA is above the slow EMA, and DI+ dominates DI-.
- Distribution — A sideways trading range at the top where informed participants distribute shares to the public. Volume increases on dips and decreases on rallies. Price is near the upper end of its range. ADX is low.
- Markdown — The downtrend phase where supply is in control. Price declines with lower highs and lower lows. ADX is elevated, the fast EMA is below the slow EMA, and DI- dominates DI+.
- Phase Confirmation — To prevent whipsaw noise, the indicator requires a configurable number of consecutive bars confirming the same phase before officially switching. This smoothing filter eliminates single-bar noise.
- Confidence Scoring — Each phase is graded (Strong/Moderate/Weak) based on how well ADX alignment, price position, volume bias, and DI direction support the detected phase. Higher confidence means more factors agree.
How It Works
1. Trend Direction Detection Two Exponential Moving Averages (Fast EMA, default 20; Slow EMA, default 50) determine trend direction. When the Fast EMA crosses above the Slow EMA, the trend is bullish. When it crosses below, the trend is bearish. An optional EMA cloud fill visually highlights the area between the two averages. 2. Trend Strength Measurement The Average Directional Index (ADX, default period 14) quantifies trend strength. ADX above the threshold (default 20) indicates a trending market suitable for Markup or Markdown detection. ADX below the threshold indicates a ranging market suitable for Accumulation or Distribution detection. DI+ and DI- values provide additional directional context. 3. Price Position Analysis The indicator calculates price position within a configurable range (default 100-bar lookback). Position is expressed as a percentage: 0% means price is at the lowest low, 100% at the highest high. Price above the Upper Position Threshold (default 65%) favors Distribution detection. Price below the Lower Position Threshold (default 35%) favors Accumulation detection. 4. Volume Bias Detection Volume on up bars versus down bars is averaged over a configurable period (default 10 bars). When average volume on up bars exceeds down bar volume by more than 10%, the bias is bullish — consistent with Accumulation and Markup. When down bar volume exceeds up bar volume, the bias is bearish — consistent with Distribution and Markdown. 5. Phase Classification Logic The four phases are detected using a combination of all factors:- Markup — ADX above threshold + Fast EMA above Slow EMA (trending bullish)
- Markdown — ADX above threshold + Fast EMA below Slow EMA (trending bearish)
- Distribution — ADX below threshold + price near range highs (ranging at top)
- Accumulation — ADX below threshold + price near range lows (ranging at bottom)
- ADX alignment — trending phases benefit from high ADX, ranging phases from low ADX (+25 max)
- Price position — Accumulation benefits from low position, Distribution from high position (+15 max)
- Volume bias — bullish bias supports Accumulation/Markup, bearish supports Distribution/Markdown (+10 max)
- DI direction — DI+ dominance supports bullish phases, DI- supports bearish phases (+10 max)
Features
- Four-Phase Wyckoff Detection — Identifies Accumulation, Markup, Distribution, and Markdown using trend strength, direction, price position, and volume analysis
- Phase Confirmation System — Requires configurable consecutive bars of the same phase detection before switching, preventing whipsaw noise
- Multi-Factor Confidence Scoring — Grades each phase as Strong, Moderate, or Weak based on ADX alignment, price position, volume bias, and DI direction
- EMA Overlay with Cloud — Displays Fast and Slow EMA lines with a color-coded cloud fill that changes color based on trend direction
- Phase Transition Labels — Marks phase changes directly on the chart with detailed tooltips showing ADX, DI+/DI-, price position, volume, and confidence
- Phase Background Coloring — Tints the chart background with the current phase color for instant visual identification
- Bar Coloring — Optional candle coloring based on the current Wyckoff phase
- Cycle Position Table — Visual 2×2 diagram showing all four phases with the current phase highlighted, representing the cycle rotation
- Info Table — Detailed metrics table showing Phase, Duration, Confidence, ADX, DI+/DI-, Trend, Price Position, Volume Bias, and total Transitions
- ADX and DMI Integration — Uses ADX for trend strength and DI+/DI- for directional bias, providing Wyckoff-authentic trend assessment
- Volume Bias Analysis — Compares average volume on up bars vs down bars to determine whether buying or selling pressure dominates
- Comprehensive Alert System — Individual alert toggles for each phase transition with detailed messages including price, ADX, and confidence
- Full Customization — 31 inputs across 5 groups covering detection parameters, volume analysis, visual style, display, and alerts

How to Use
- Add the indicator to your chart. It works on all timeframes but is most effective on 15-minute to daily charts where trend and range dynamics are clearly visible.
- Watch for Accumulation phases near significant lows — this is where institutions build positions. Look for volume bias shifting to bullish as confirmation.
- During Markup phases, trade with the trend. The bullish EMA cross and rising ADX confirm demand dominance. Pullbacks toward the slow EMA offer entry opportunities.
- Distribution phases near highs warn that institutions are selling. Watch for ADX declining while price stays elevated — supply is building quietly.
- Markdown phases confirm a downtrend. The bearish EMA cross and elevated ADX show supply in control. Rallies toward the slow EMA offer exit or short opportunities.
- Use the Confidence score to gauge the reliability of the current phase. Strong confidence means multiple factors align; Weak confidence suggests the market may be transitional.
- The Cycle Position Table provides a quick at-a-glance view of where the market sits in the Wyckoff cycle. The highlighted cell shows the current phase.
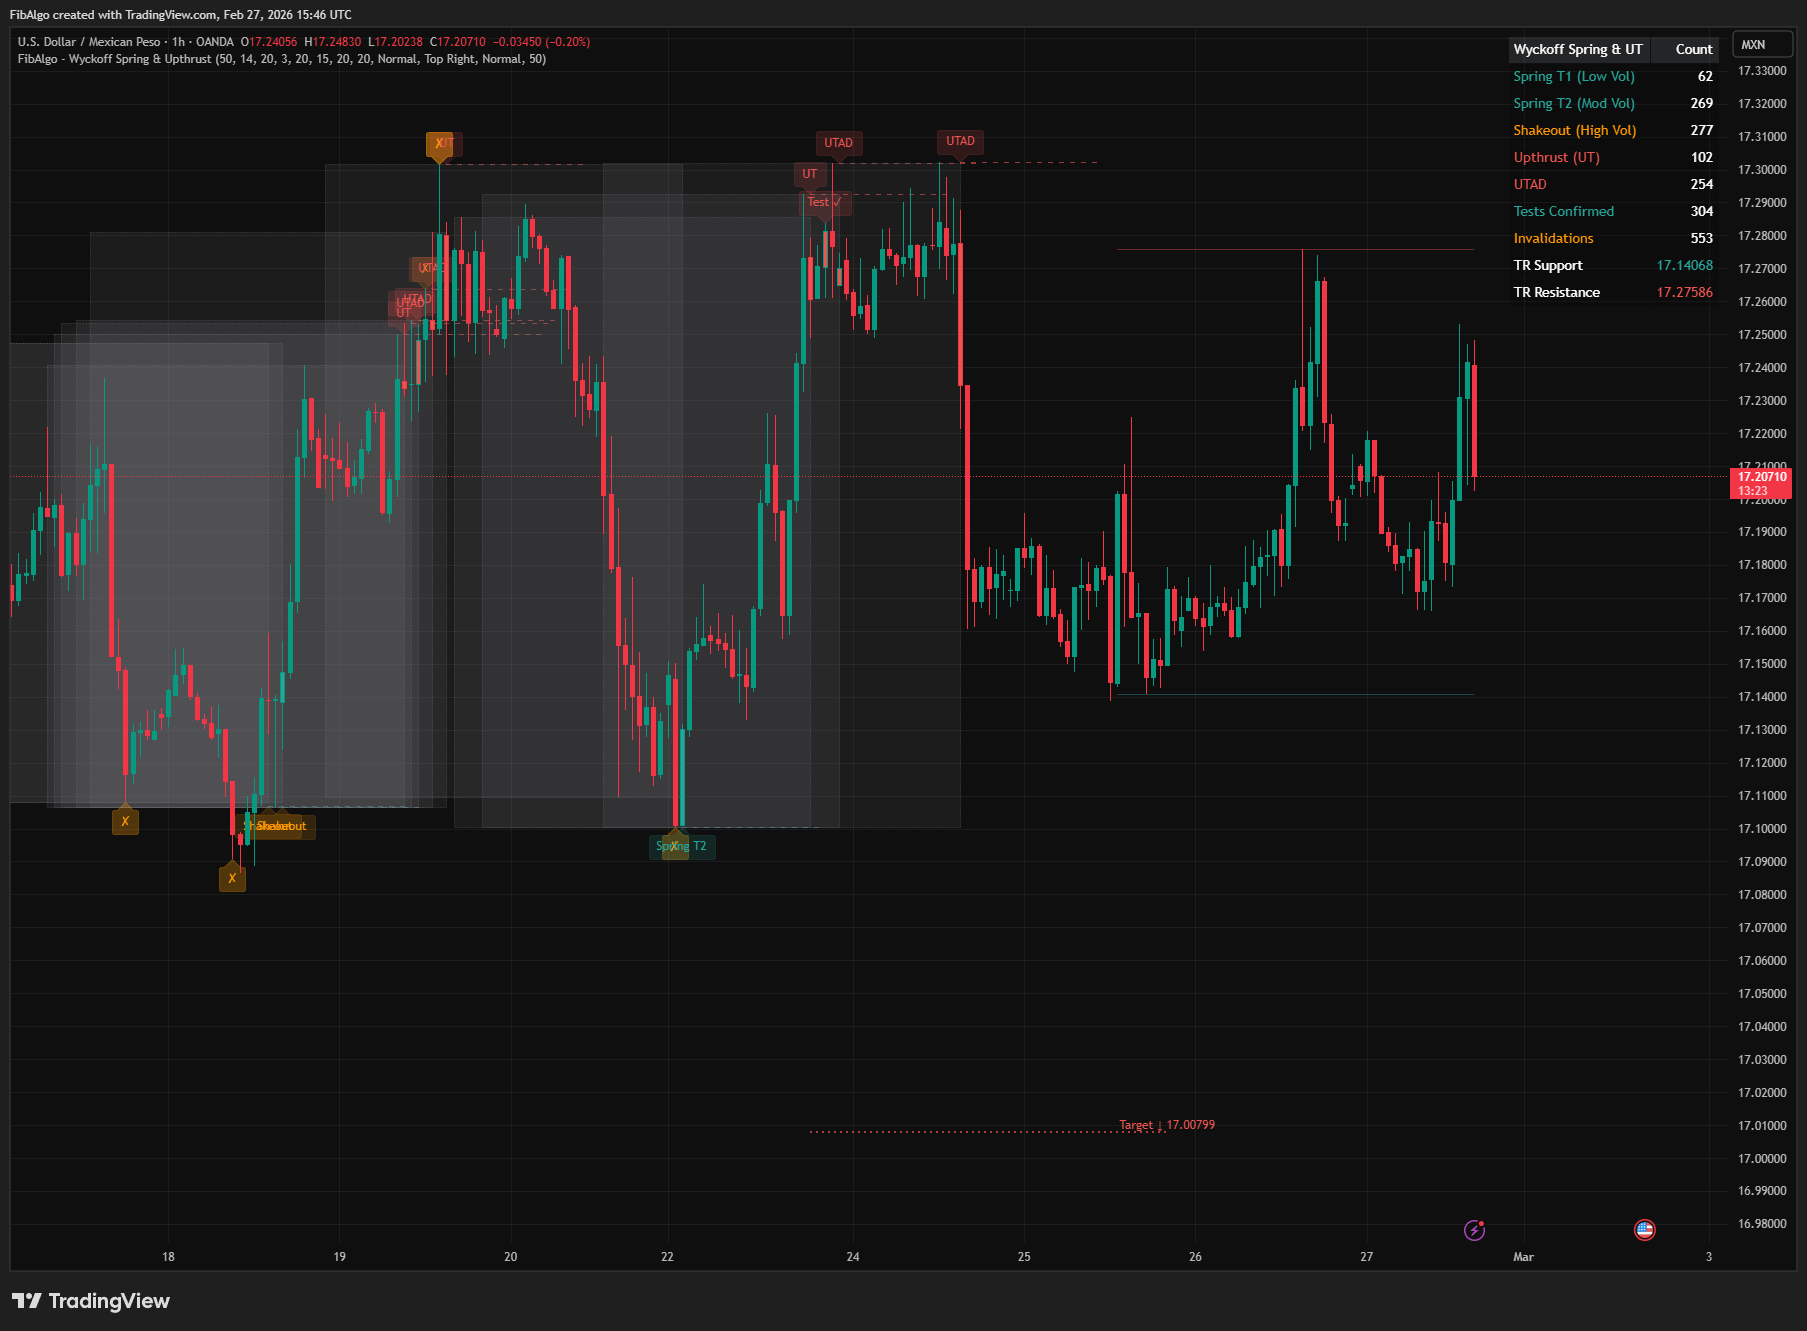
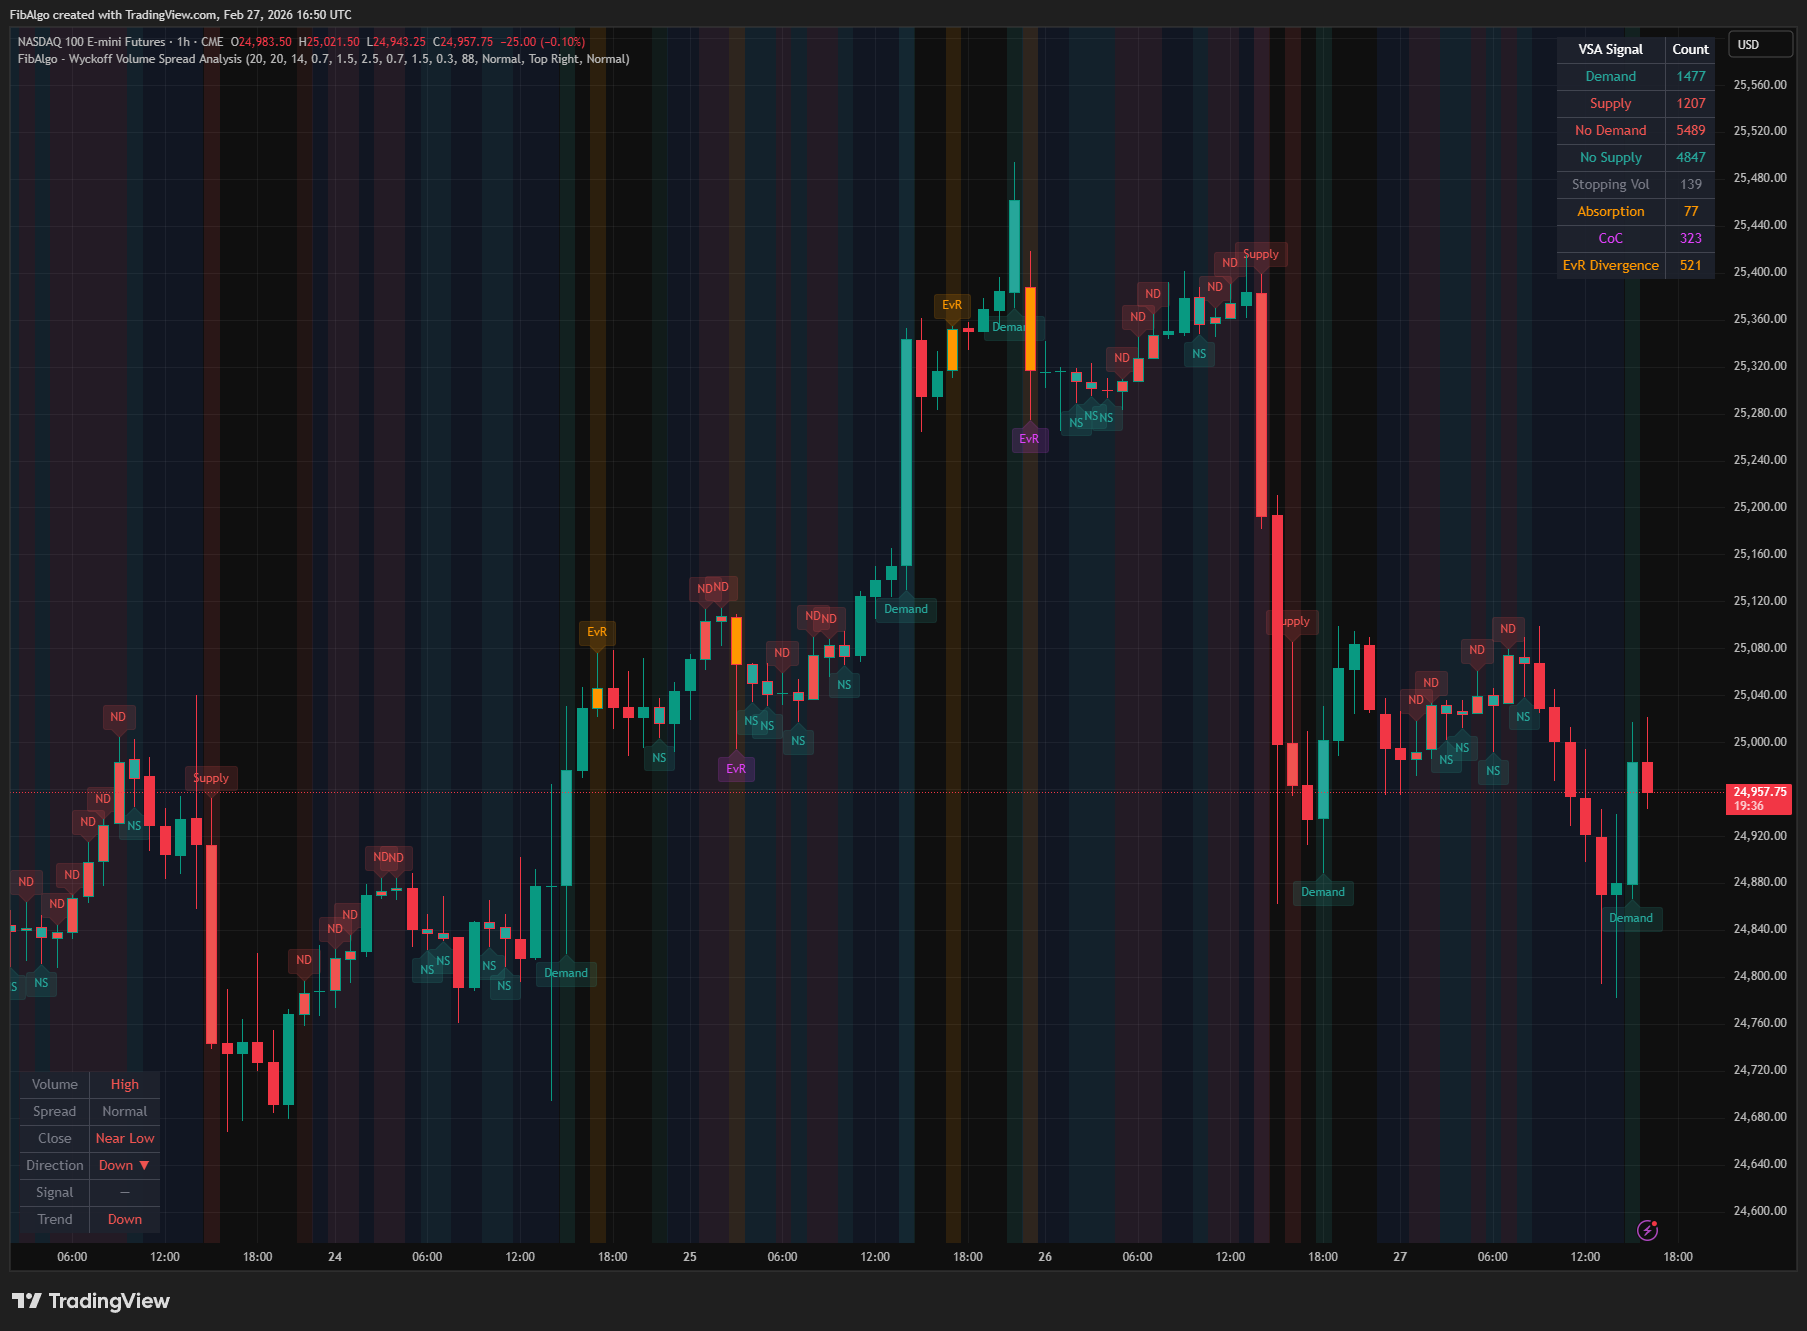
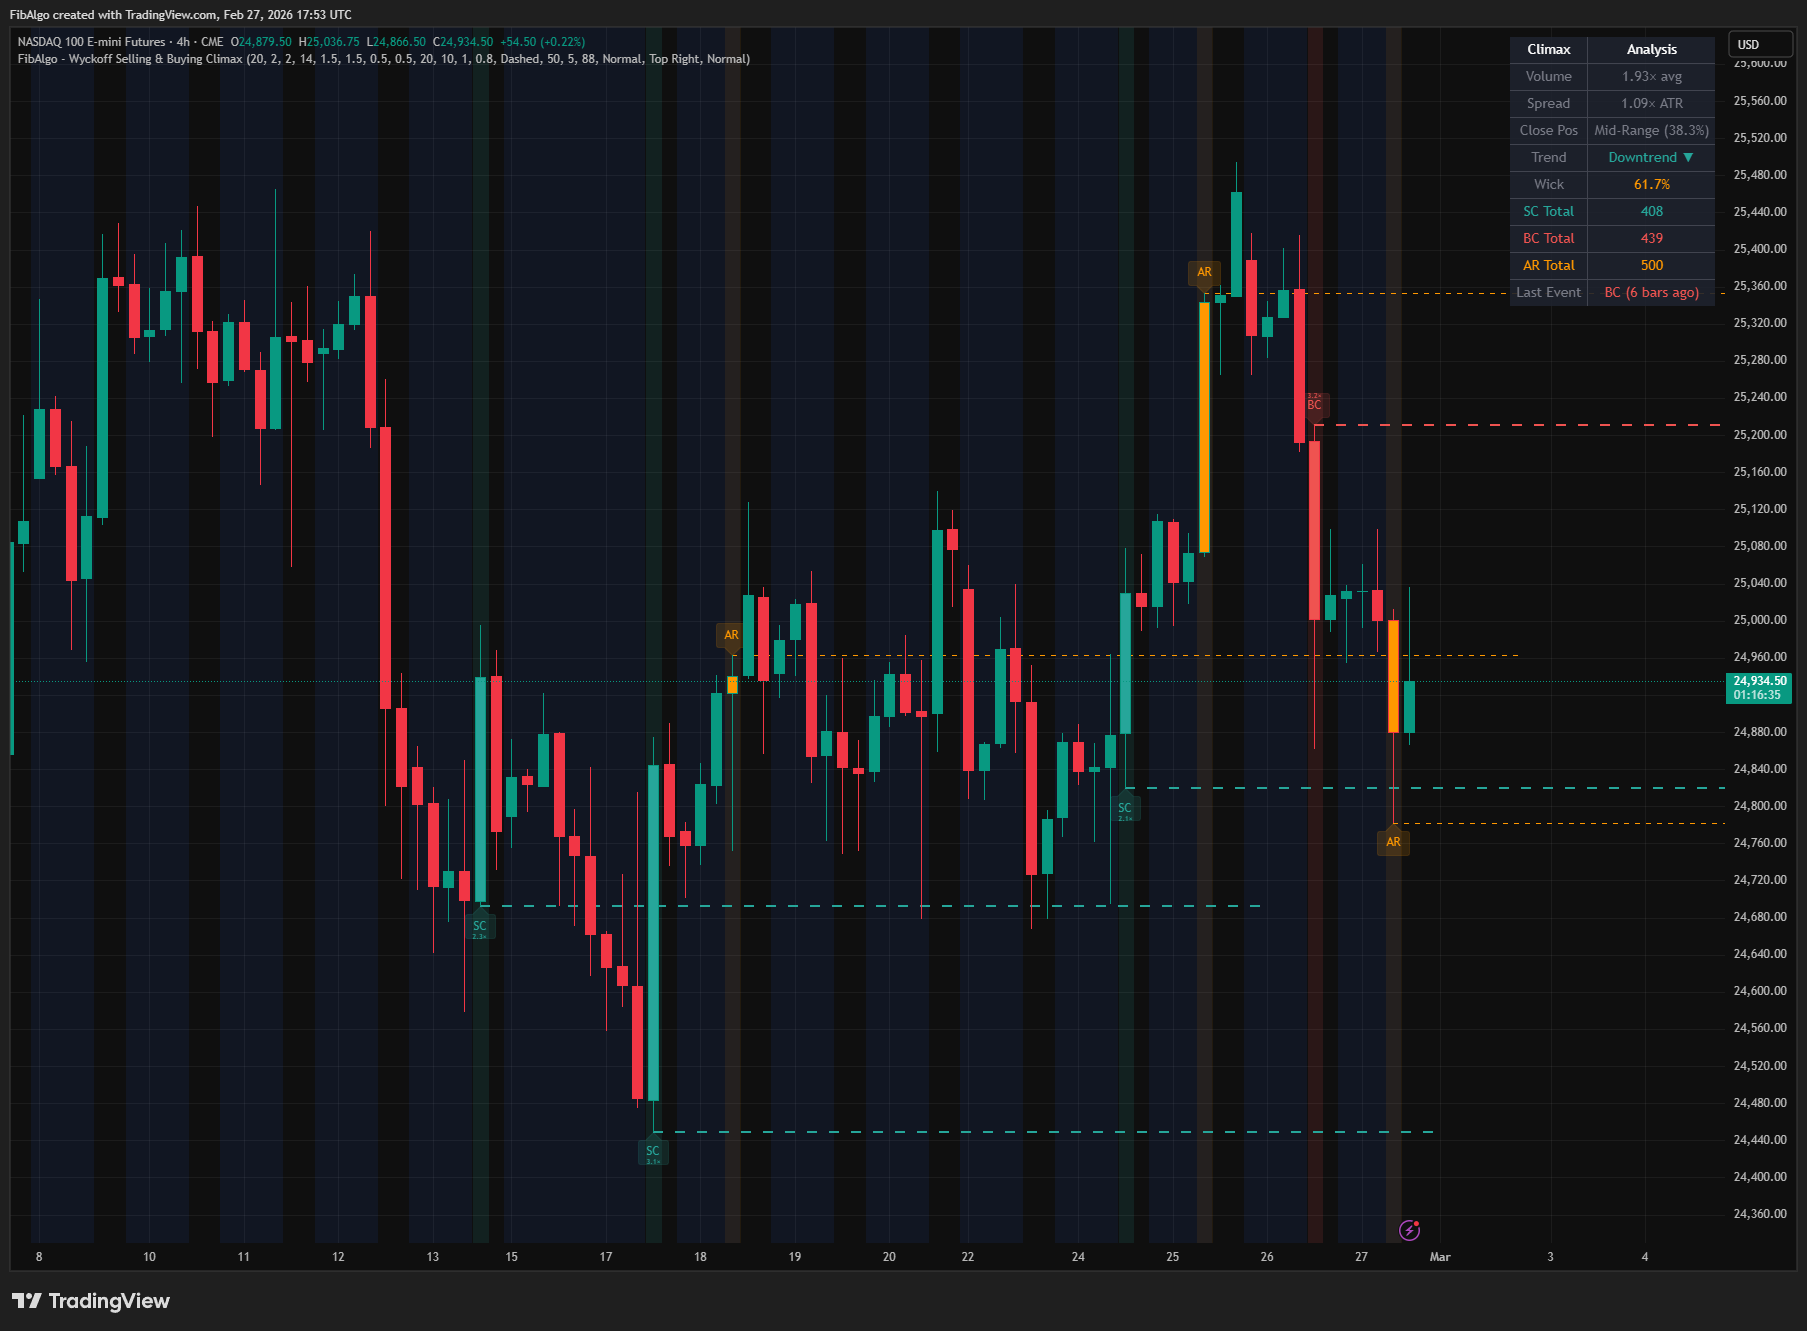
- Combine phase detection with other Wyckoff indicators (Volume Spread Analysis, Spring & Upthrust) for comprehensive analysis.
- Adjust the ADX Threshold to match your instrument — more volatile instruments may need a higher threshold (25-30), while calmer markets may work better with lower values (15-18).
- Increase Phase Confirmation Bars on lower timeframes to reduce noise, or decrease it on higher timeframes for faster response.
Limitations
- This indicator does not generate buy or sell signals. It classifies the current market phase for educational and analytical purposes based on Wyckoff price cycle theory.
- Phase detection relies on ADX and EMA calculations that inherently lag price. Phase transitions are identified after they have begun, not predicted in advance.
- The phase confirmation system intentionally introduces a delay to reduce noise. This means rapid phase changes in choppy markets may be reported late.
- Volume data reliability varies by instrument and exchange. Forex spot volume is typically tick volume and may not represent actual traded volume.
- The indicator uses a single timeframe. For comprehensive Wyckoff analysis, comparing phase readings across multiple timeframes is recommended.
- Past phase classification does not guarantee future price behavior.
- If the Cycle Position Table and Info Table are set to the same position, they will overlap. Use different positions for each table.
- Maximum 500 label objects are supported by Pine Script.
Tags
#Wyckoff Method#Trend#Price Action