Overview
FibAlgo - Wyckoff SOS & SOW identifies Sign of Strength (SOS) and Sign of Weakness (SOW) events — the defining moments in Wyckoff analysis where demand or supply decisively gains the upper hand. Beyond single-bar detection, the indicator tracks the critical follow-up events: Last Point of Support (LPS) after SOS and Last Point of Supply (LPSY) after SOW, confirming trend continuation. A running demand/supply dominance balance and strength bar coloring provide continuous context for every bar on the chart.
Key Concepts
- Sign of Strength (SOS) — A price advance on wide spread, high volume, and close near the high. Indicates demand is decisively overcoming supply. In accumulation, SOS often follows a spring and validates the bullish thesis. In markup, it confirms trend continuation.
- Sign of Weakness (SOW) — A price decline on wide spread, high volume, and close near the low. Indicates supply is overwhelming demand. In distribution, SOW confirms the bearish thesis. In markdown, it signals continuation of selling pressure.
- Last Point of Support (LPS) — A pullback after SOS on narrow spread and diminished volume. Price holds above the SOS low, confirming that supply has been absorbed and demand remains in control. LPS is an excellent entry point for long positions.
- Last Point of Supply (LPSY) — A feeble rally after SOW on narrow spread and light volume. Price stays below the SOW high, confirming demand exhaustion. LPSY is an excellent entry point for short positions.
- Demand/Supply Dominance — A running tally of demand bars vs supply bars over a configurable lookback period. Shows whether the current market environment favors buyers or sellers, providing context for SOS/SOW interpretation.
- Strength Scoring — Each SOS/SOW event receives a 25-100% score based on how far volume, spread, and close position exceed their detection thresholds. A bar that barely qualifies scores around 25% (Weak), while one that greatly exceeds all thresholds approaches 100% (Strong). Graded as Strong (75%+), Moderate (50-74%), or Weak (below 50%).
How It Works
1. Sign of Strength (SOS) Detection A Sign of Strength bar requires all of the following conditions simultaneously:- Up bar (close above open)
- Wide spread — bar range exceeding the ATR (default 14-period) multiplied by the SOS Spread Multiplier (default 1.3×)
- Close near high — close position above the SOS Close Near High threshold (default 0.7, meaning close in the top 30% of the bar)
- High volume — exceeding the Volume MA (default 20-period) multiplied by the SOS Volume Multiplier (default 1.5×)
- Volume expansion (optional, default on) — current bar's volume exceeds the previous bar's volume, showing increasing effort on the advance
- Down bar (close below open)
- Wide spread exceeding the SOW Spread Multiplier (default 1.3×) times ATR
- Close near low — close position below the SOW Close Near Low threshold (default 0.3)
- High volume exceeding the SOW Volume Multiplier (default 1.5×) times volume average
- Volume expansion (optional) — current volume exceeds previous bar
- Narrow spread — bar range below the Narrow Spread Threshold (default 0.8× ATR)
- Low volume — below the Low Volume Threshold (default 0.7× average)
- Price holds above the SOS bar's low — confirming support
- Price has pulled back below the SOS bar's high — confirming it is actually a pullback
- Narrow spread below the threshold
- Low volume below the threshold
- Price stays below the SOW bar's high — confirming resistance
- Price has rallied above the SOW bar's low — confirming it is an attempted rally
- Demand bar: up bar + close above 60% + volume above average → tinted bullish
- Supply bar: down bar + close below 40% + volume above average → tinted bearish
- Neutral bar: does not meet either criteria → no coloring
Features
- Sign of Strength Detection — Identifies wide-spread up bars closing near high on expanding volume, confirming demand dominance in Wyckoff methodology
- Sign of Weakness Detection — Identifies wide-spread down bars closing near low on expanding volume, confirming supply dominance
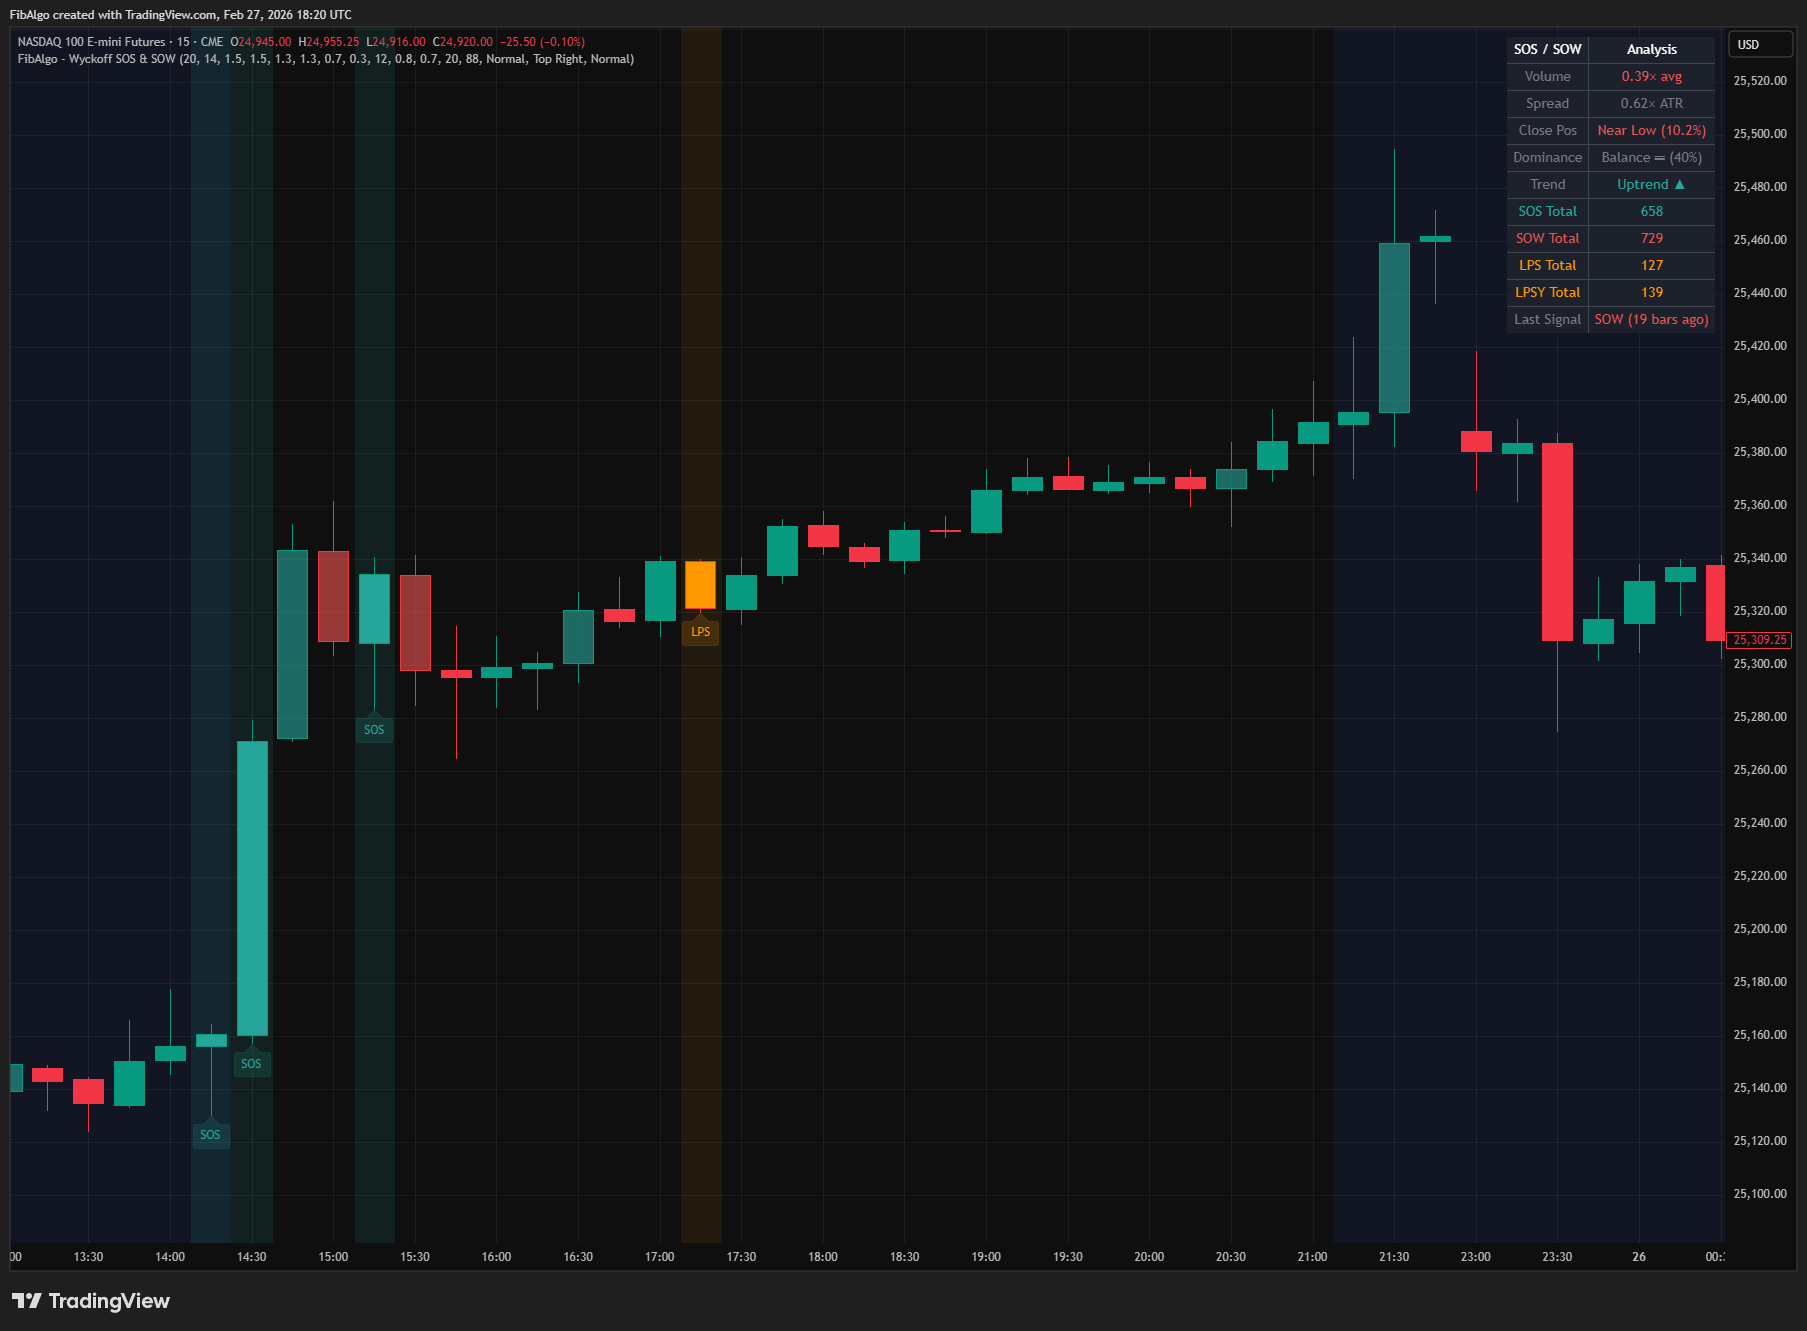
- Last Point of Support (LPS) — Detects the first narrow-spread, low-volume pullback after SOS that holds above support, confirming bullish trend continuation
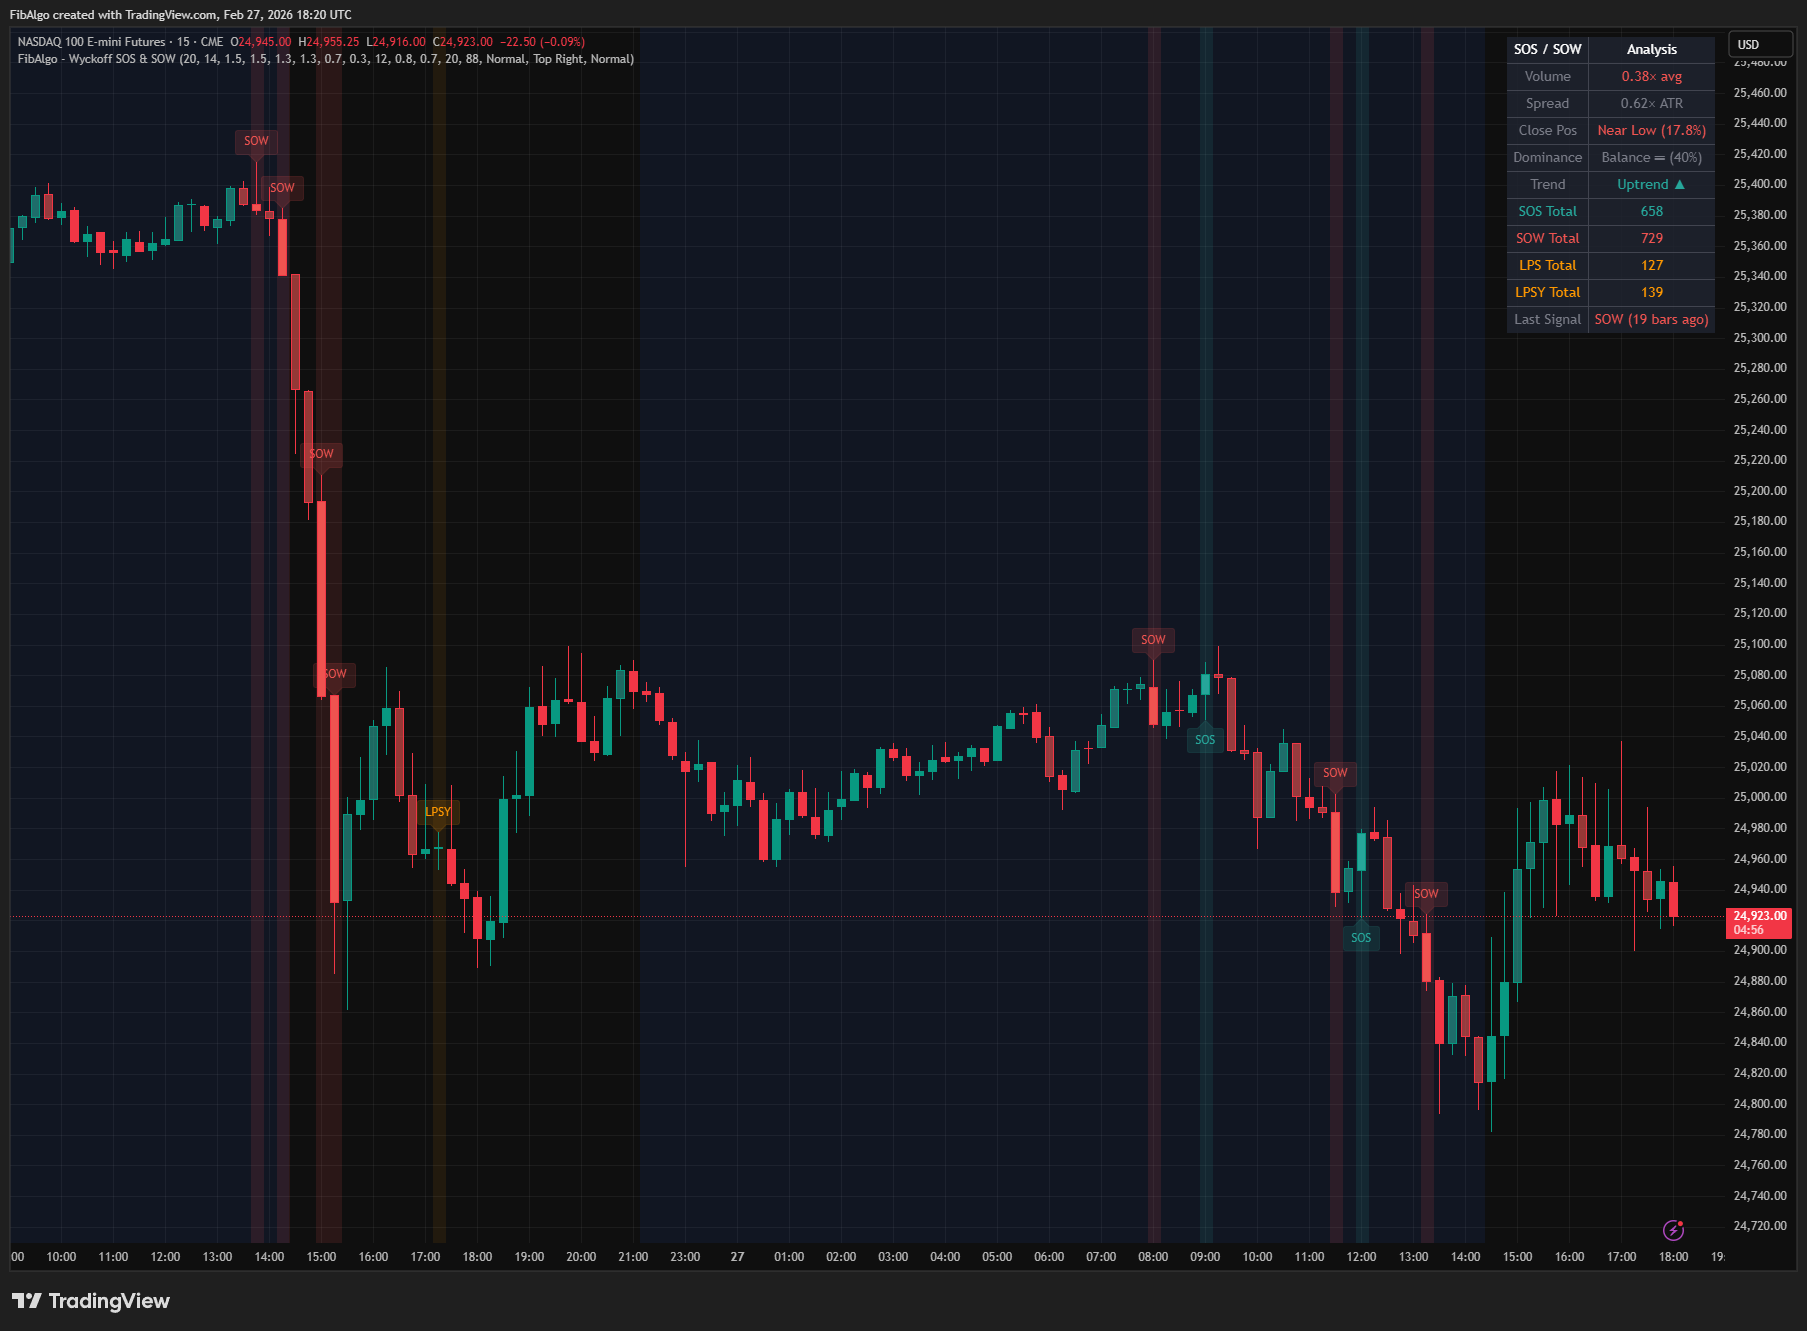
- Last Point of Supply (LPSY) — Detects the first narrow-spread, low-volume rally after SOW that fails below resistance, confirming bearish trend continuation
- Strength Scoring — Grades each SOS/SOW event (Strong/Moderate/Weak) based on volume magnitude, spread width, and close position for reliability assessment
- Volume Expansion Check — Optional requirement that current bar's volume exceeds the previous bar's volume, ensuring genuine expanding effort on the move
- Demand/Supply Dominance Balance — Running percentage of demand vs supply bars over a configurable lookback, showing the prevailing market character
- Strength Bar Coloring — Colors all non-signal bars by their demand/supply characteristics for continuous visual feedback on market background
- Separate SOS and SOW Thresholds — Independent volume, spread, and close position thresholds for bullish and bearish signals, allowing asymmetric sensitivity
- State Machine Pattern Tracking — Multi-bar pattern recognition (SOS→LPS, SOW→LPSY) with automatic window expiry and state management
- Background and Bar Coloring — Optional background tinting on signal bars and full bar coloring for instant visual identification
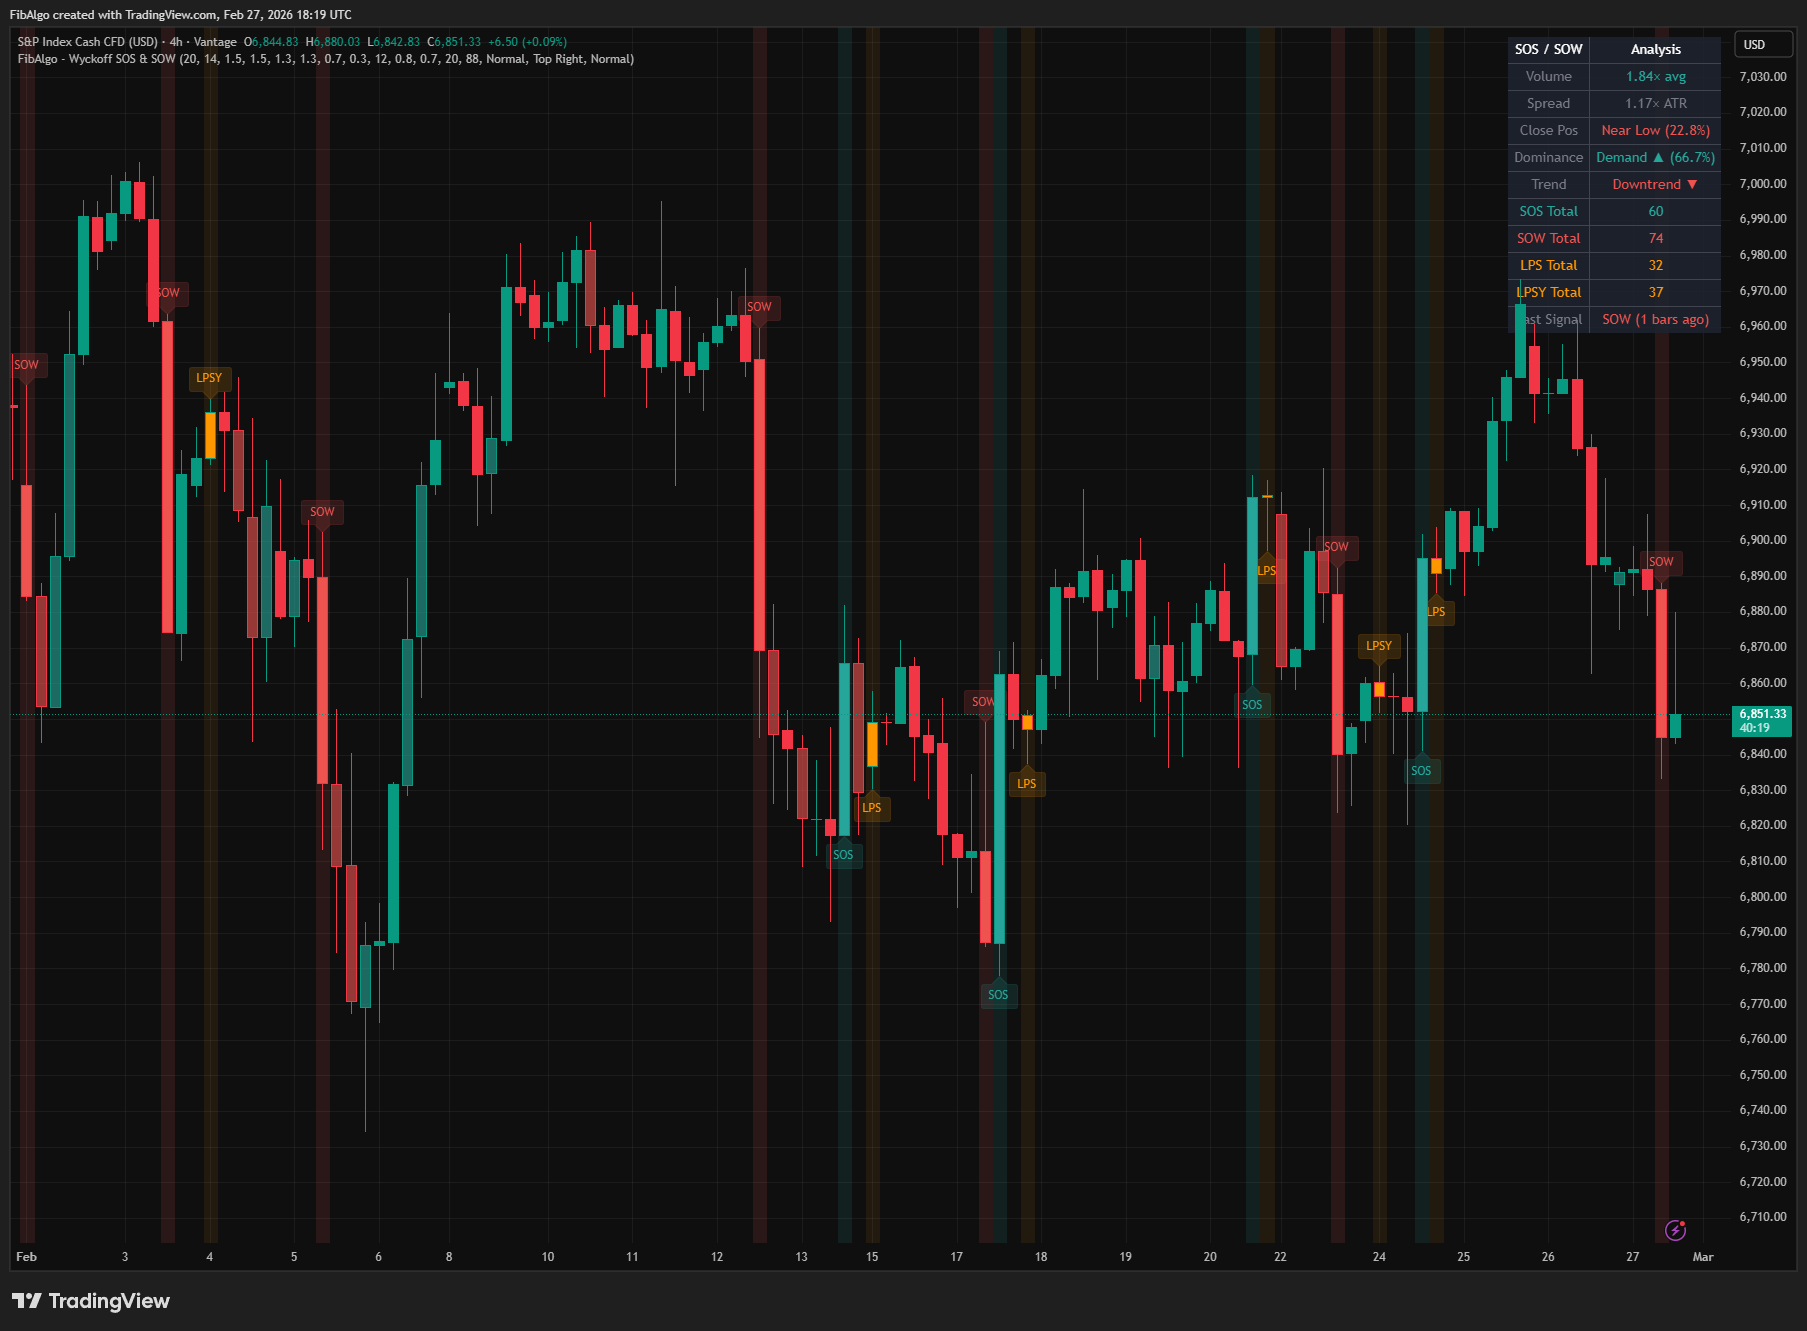
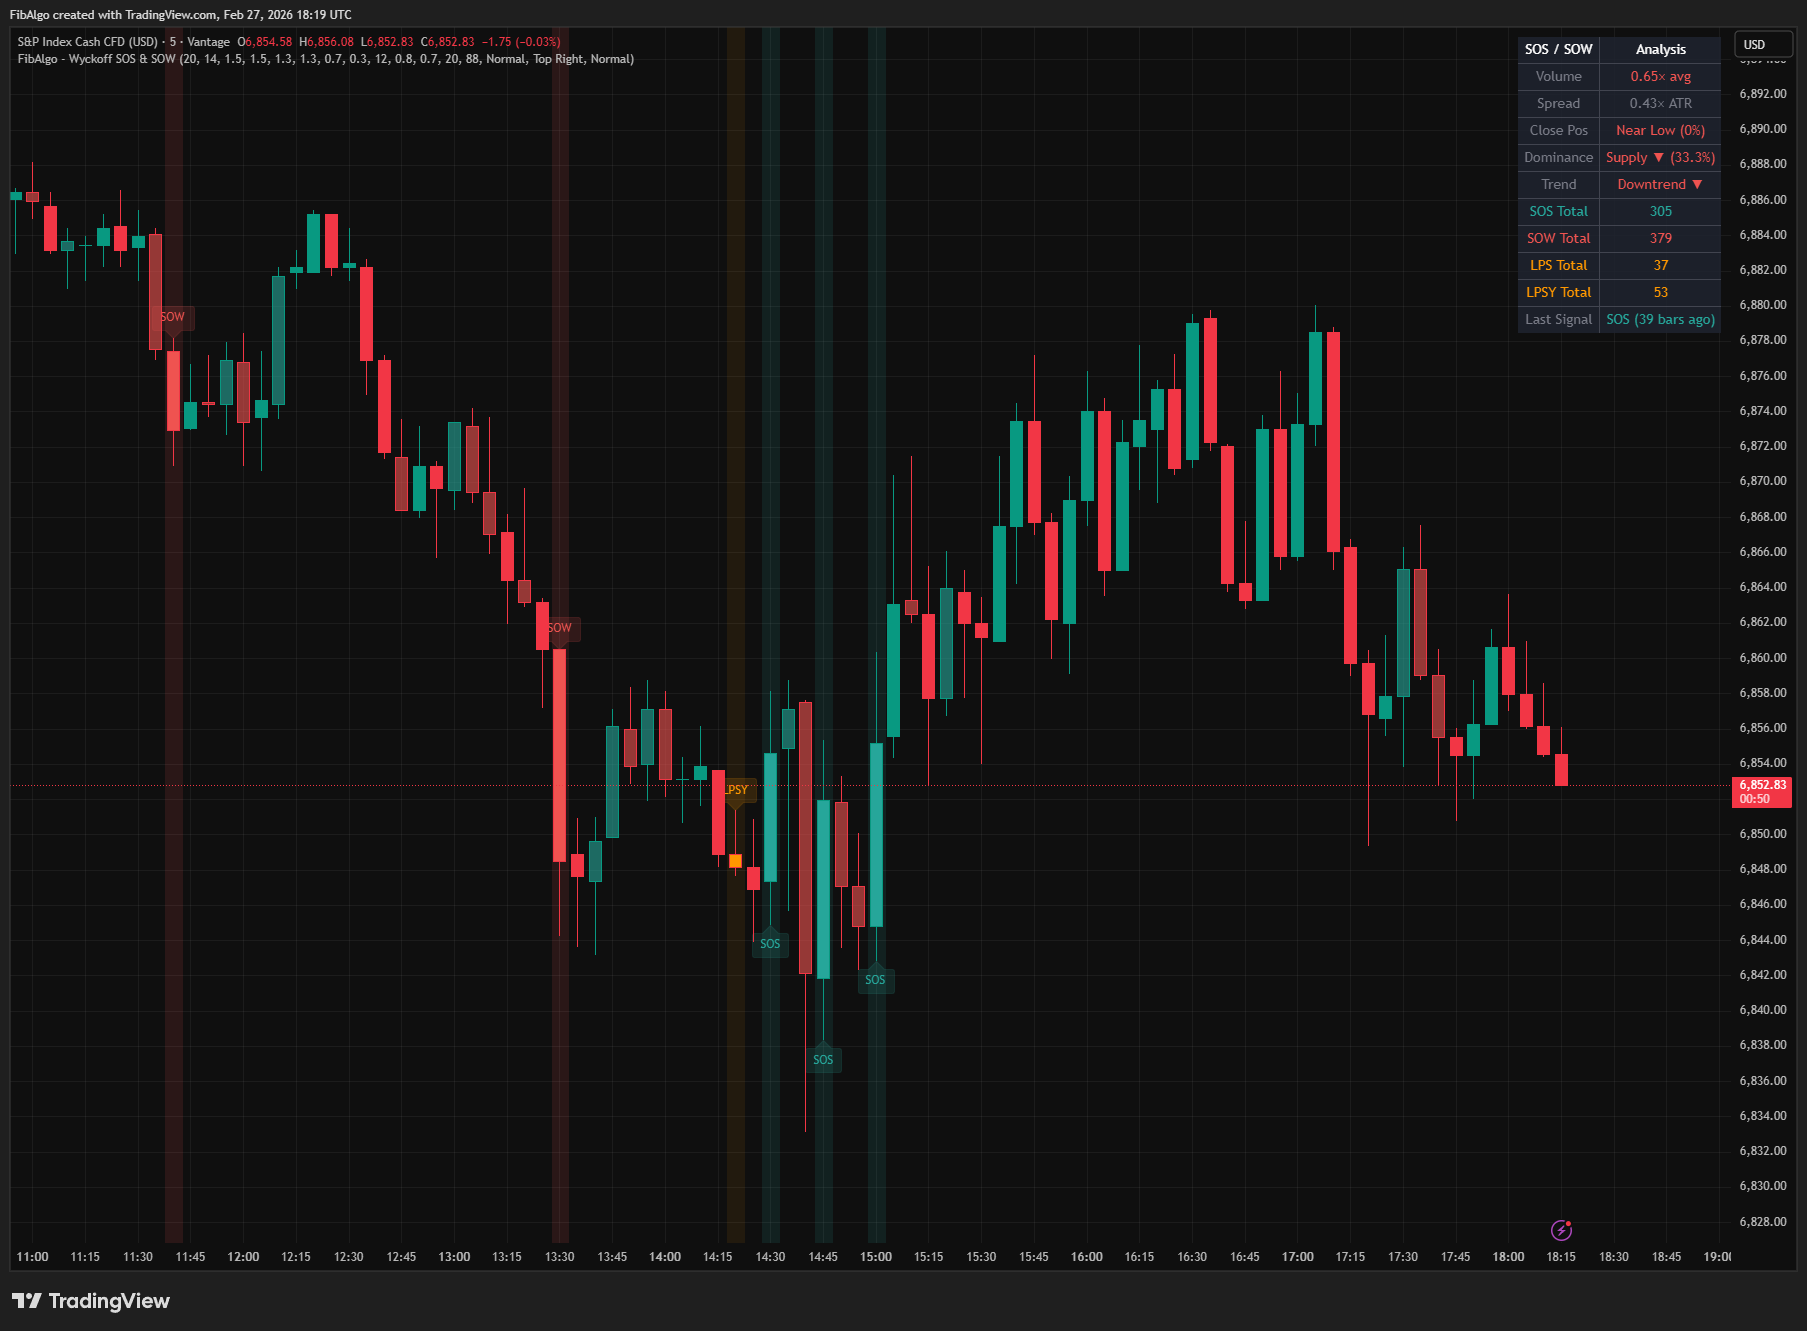
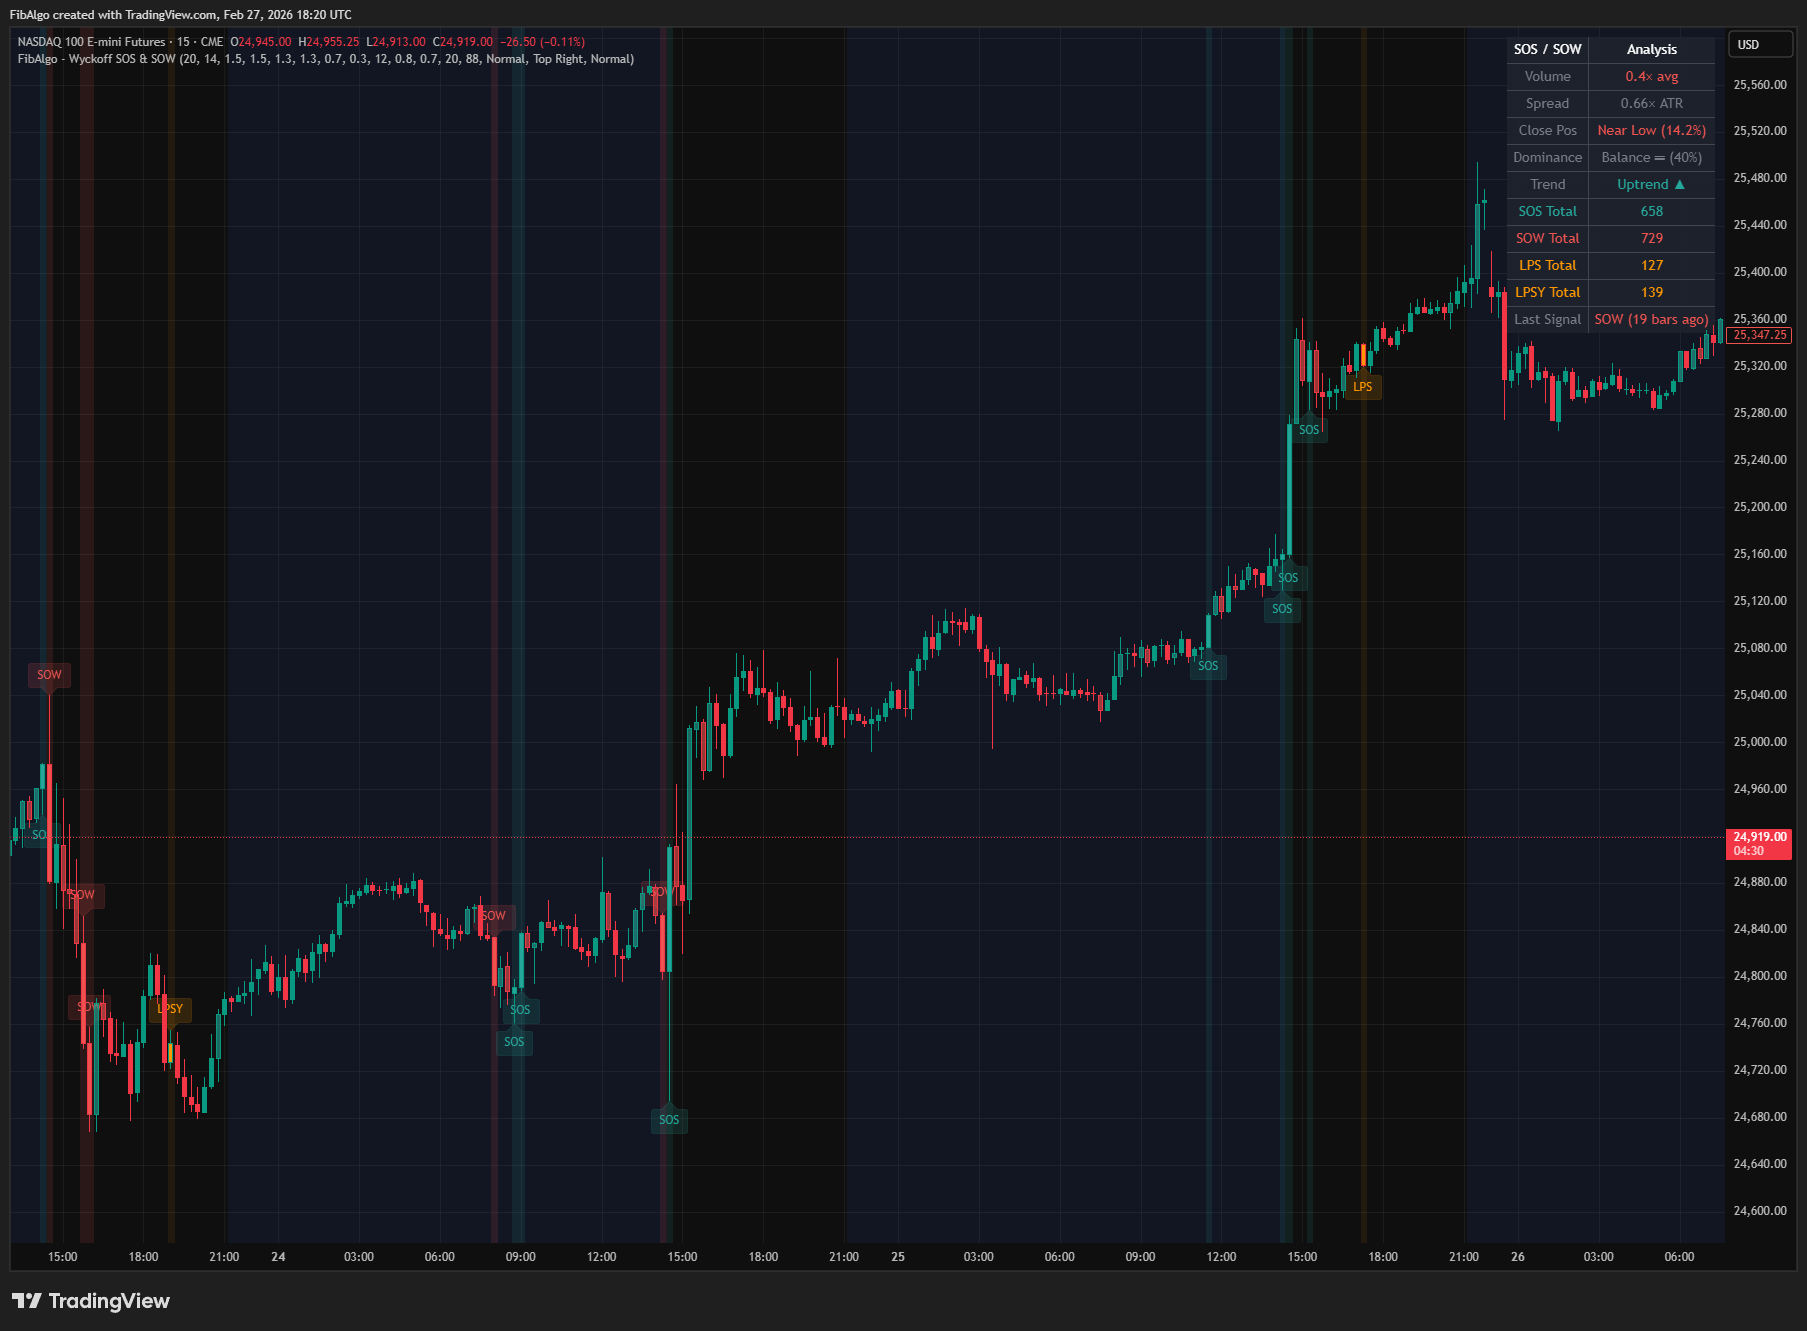
- Info Table — Real-time metrics including Volume Ratio, Spread/ATR, Close Position, Dominance Balance, Trend, event counts, and last signal age
- Comprehensive Alert System — Individual alerts for SOS, SOW, LPS, and LPSY events with detailed messages including price, volume, strength grade, and trend confirmation status
How to Use
- Add the indicator to your chart. It works on all timeframes but is most effective on 15-minute to daily charts where volume dynamics are reliable.
- Watch for SOS events during accumulation ranges or after springs — a wide-spread up bar on high volume closing near the high confirms demand is taking control.
- When LPS follows SOS, it confirms the bullish thesis. The LPS pullback (narrow spread, light volume, holding above SOS low) is an excellent entry point for long positions.
- Watch for SOW events during distribution ranges or after upthrusts — a wide-spread down bar on high volume closing near the low confirms supply dominance.
- When LPSY follows SOW, it confirms the bearish thesis. The LPSY rally attempt (narrow, light volume, staying below SOW high) is an excellent short entry point.
- Use the Strength Score to filter signals. Strong SOS/SOW events (75%+) carry more significance than Weak ones.
- Monitor the Dominance Balance in the info table. Values above 65% indicate demand-dominant conditions favorable for SOS signals; below 35% indicates supply-dominant conditions favorable for SOW signals.
- Strength bar coloring provides continuous context between signal events — watch for clusters of demand bars (bullish) or supply bars (bearish) to gauge the prevailing character.
- Combine with other Wyckoff indicators: use Selling & Buying Climax (#5) for initial TR formation, then look for SOS/SOW within the trading range for Phase D confirmation.
- Adjust the Volume Multiplier higher (1.8-2.0) for less noise on volatile instruments, or lower (1.2-1.3) for calmer markets where volume spikes are smaller.
Limitations
- This indicator does not generate buy or sell signals. It identifies SOS, SOW, LPS, and LPSY events for educational and analytical purposes based on Wyckoff methodology.
- SOS and SOW detection are single-bar classifications. Not every wide-spread, high-volume bar is a genuine Wyckoff SOS/SOW — context (accumulation vs distribution vs trend) matters for interpretation.
- LPS/LPSY detection uses a finite follow-up window. In some cases, the pullback or rally may occur outside this window and go undetected.
- Only one LPS or LPSY is detected per SOS/SOW event. In practice, multiple LPS or LPSY bars can occur, but only the first is marked.
- Volume data reliability varies by instrument and exchange. Forex spot volume is typically tick volume and may not accurately represent institutional activity.
- The strength score is a relative measure based on the configured thresholds. Changing thresholds affects which events qualify but not the scoring formula.
- Dominance balance is based on bar counting, not volume-weighted. A single ultra-high-volume bar counts the same as a moderately high-volume bar.
- Past SOS/SOW events do not guarantee future price direction. Always combine with broader Wyckoff analysis and risk management.
Tags
#Wyckoff Method#Signals#Price Action