Overview
FibAlgo - Smart Trading is a volatility-adaptive trend analysis indicator that identifies dynamic support and resistance levels, classifies breakout strength, and draws real-time retracement and take-profit zones on the chart.
Unlike static S/R tools, this indicator adjusts its levels using a rolling volatility measurement, producing zones that expand in volatile markets and contract in calm ones. It aims to help traders visualize where price may retrace after a breakout and where potential take-profit areas may form, without making any guarantees about future price behavior.
Supertrend-Based Trend Detection
The indicator uses a trend detection system based on the Supertrend concept (Olivier Seban). The Supertrend is a widely known trend-following method that calculates upper and lower bands using ATR (Average True Range) around the median price (HL2). When price crosses above the lower band, the trend flips bullish; when it crosses below the upper band, the trend flips bearish. This mechanism determines the directional bias used throughout the indicator.
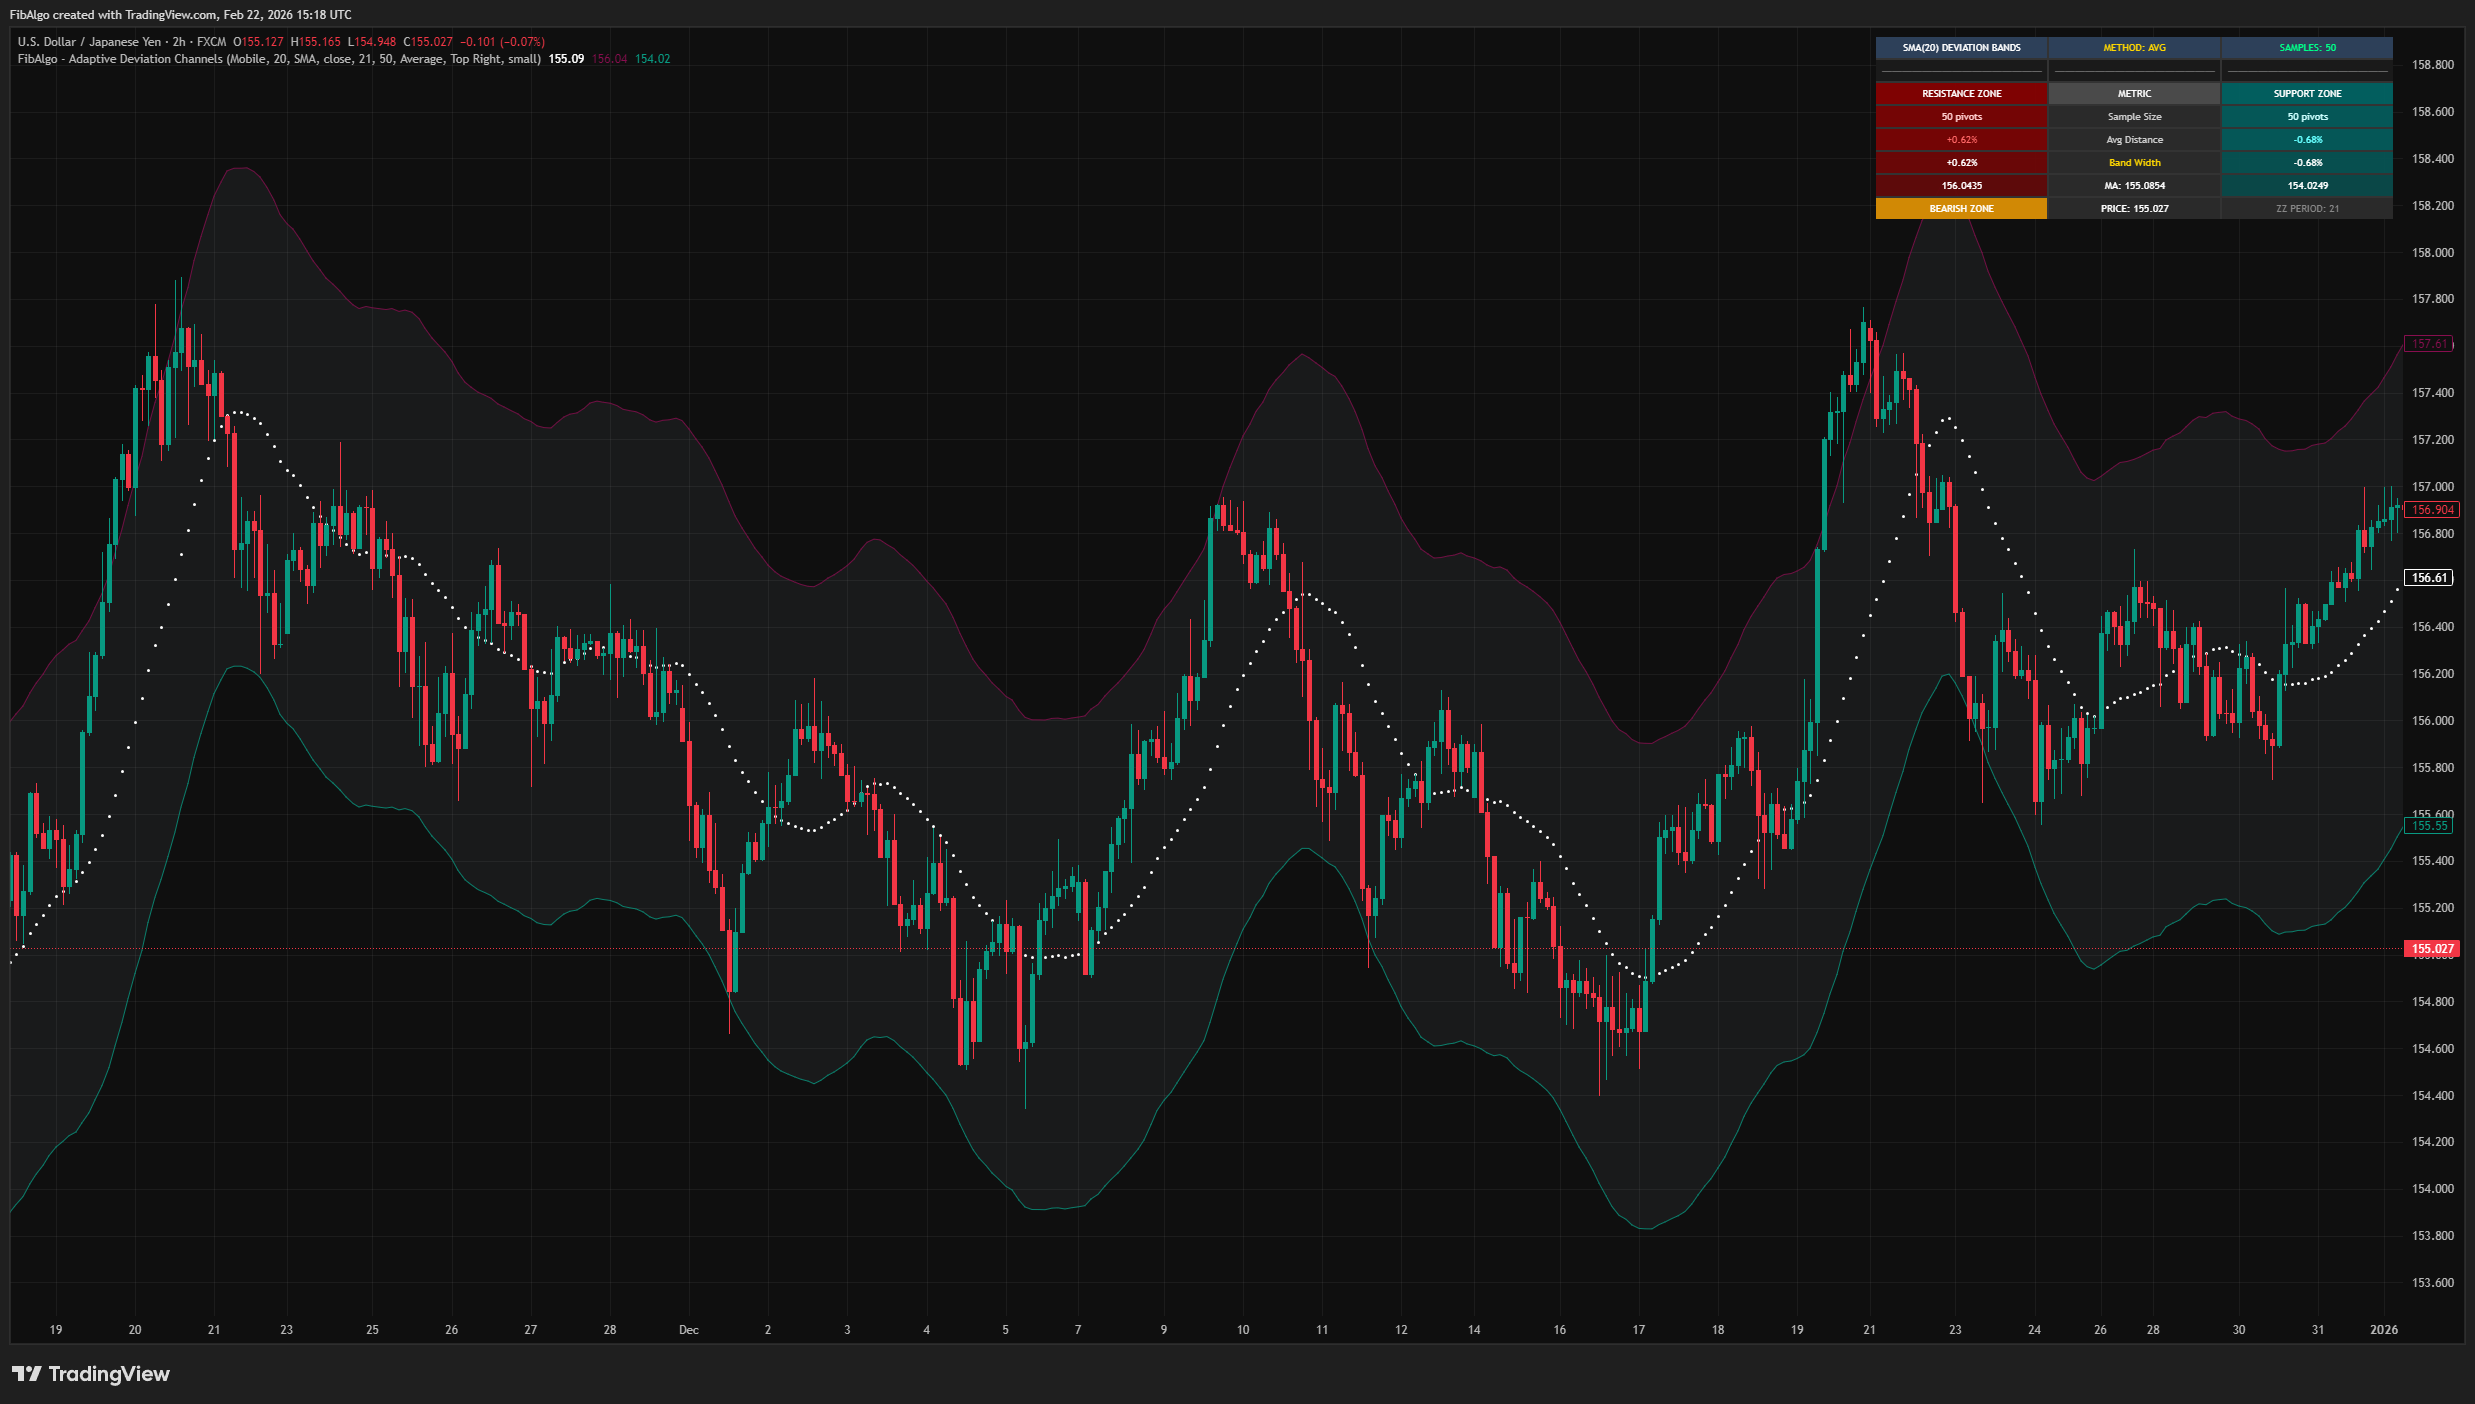
Volatility-Adjusted Support and Resistance
Rather than placing S/R lines at raw swing highs and lows, this indicator offsets them by a volatility buffer. The buffer is derived from the standard deviation of the closing price over a 20-bar window, scaled by a user-defined sensitivity multiplier. This means:
- Resistance line = Period highest high + volatility at that bar
- Support line = Period lowest low - volatility at that bar
The result is levels that account for typical noise around swing points, reducing false triggers.
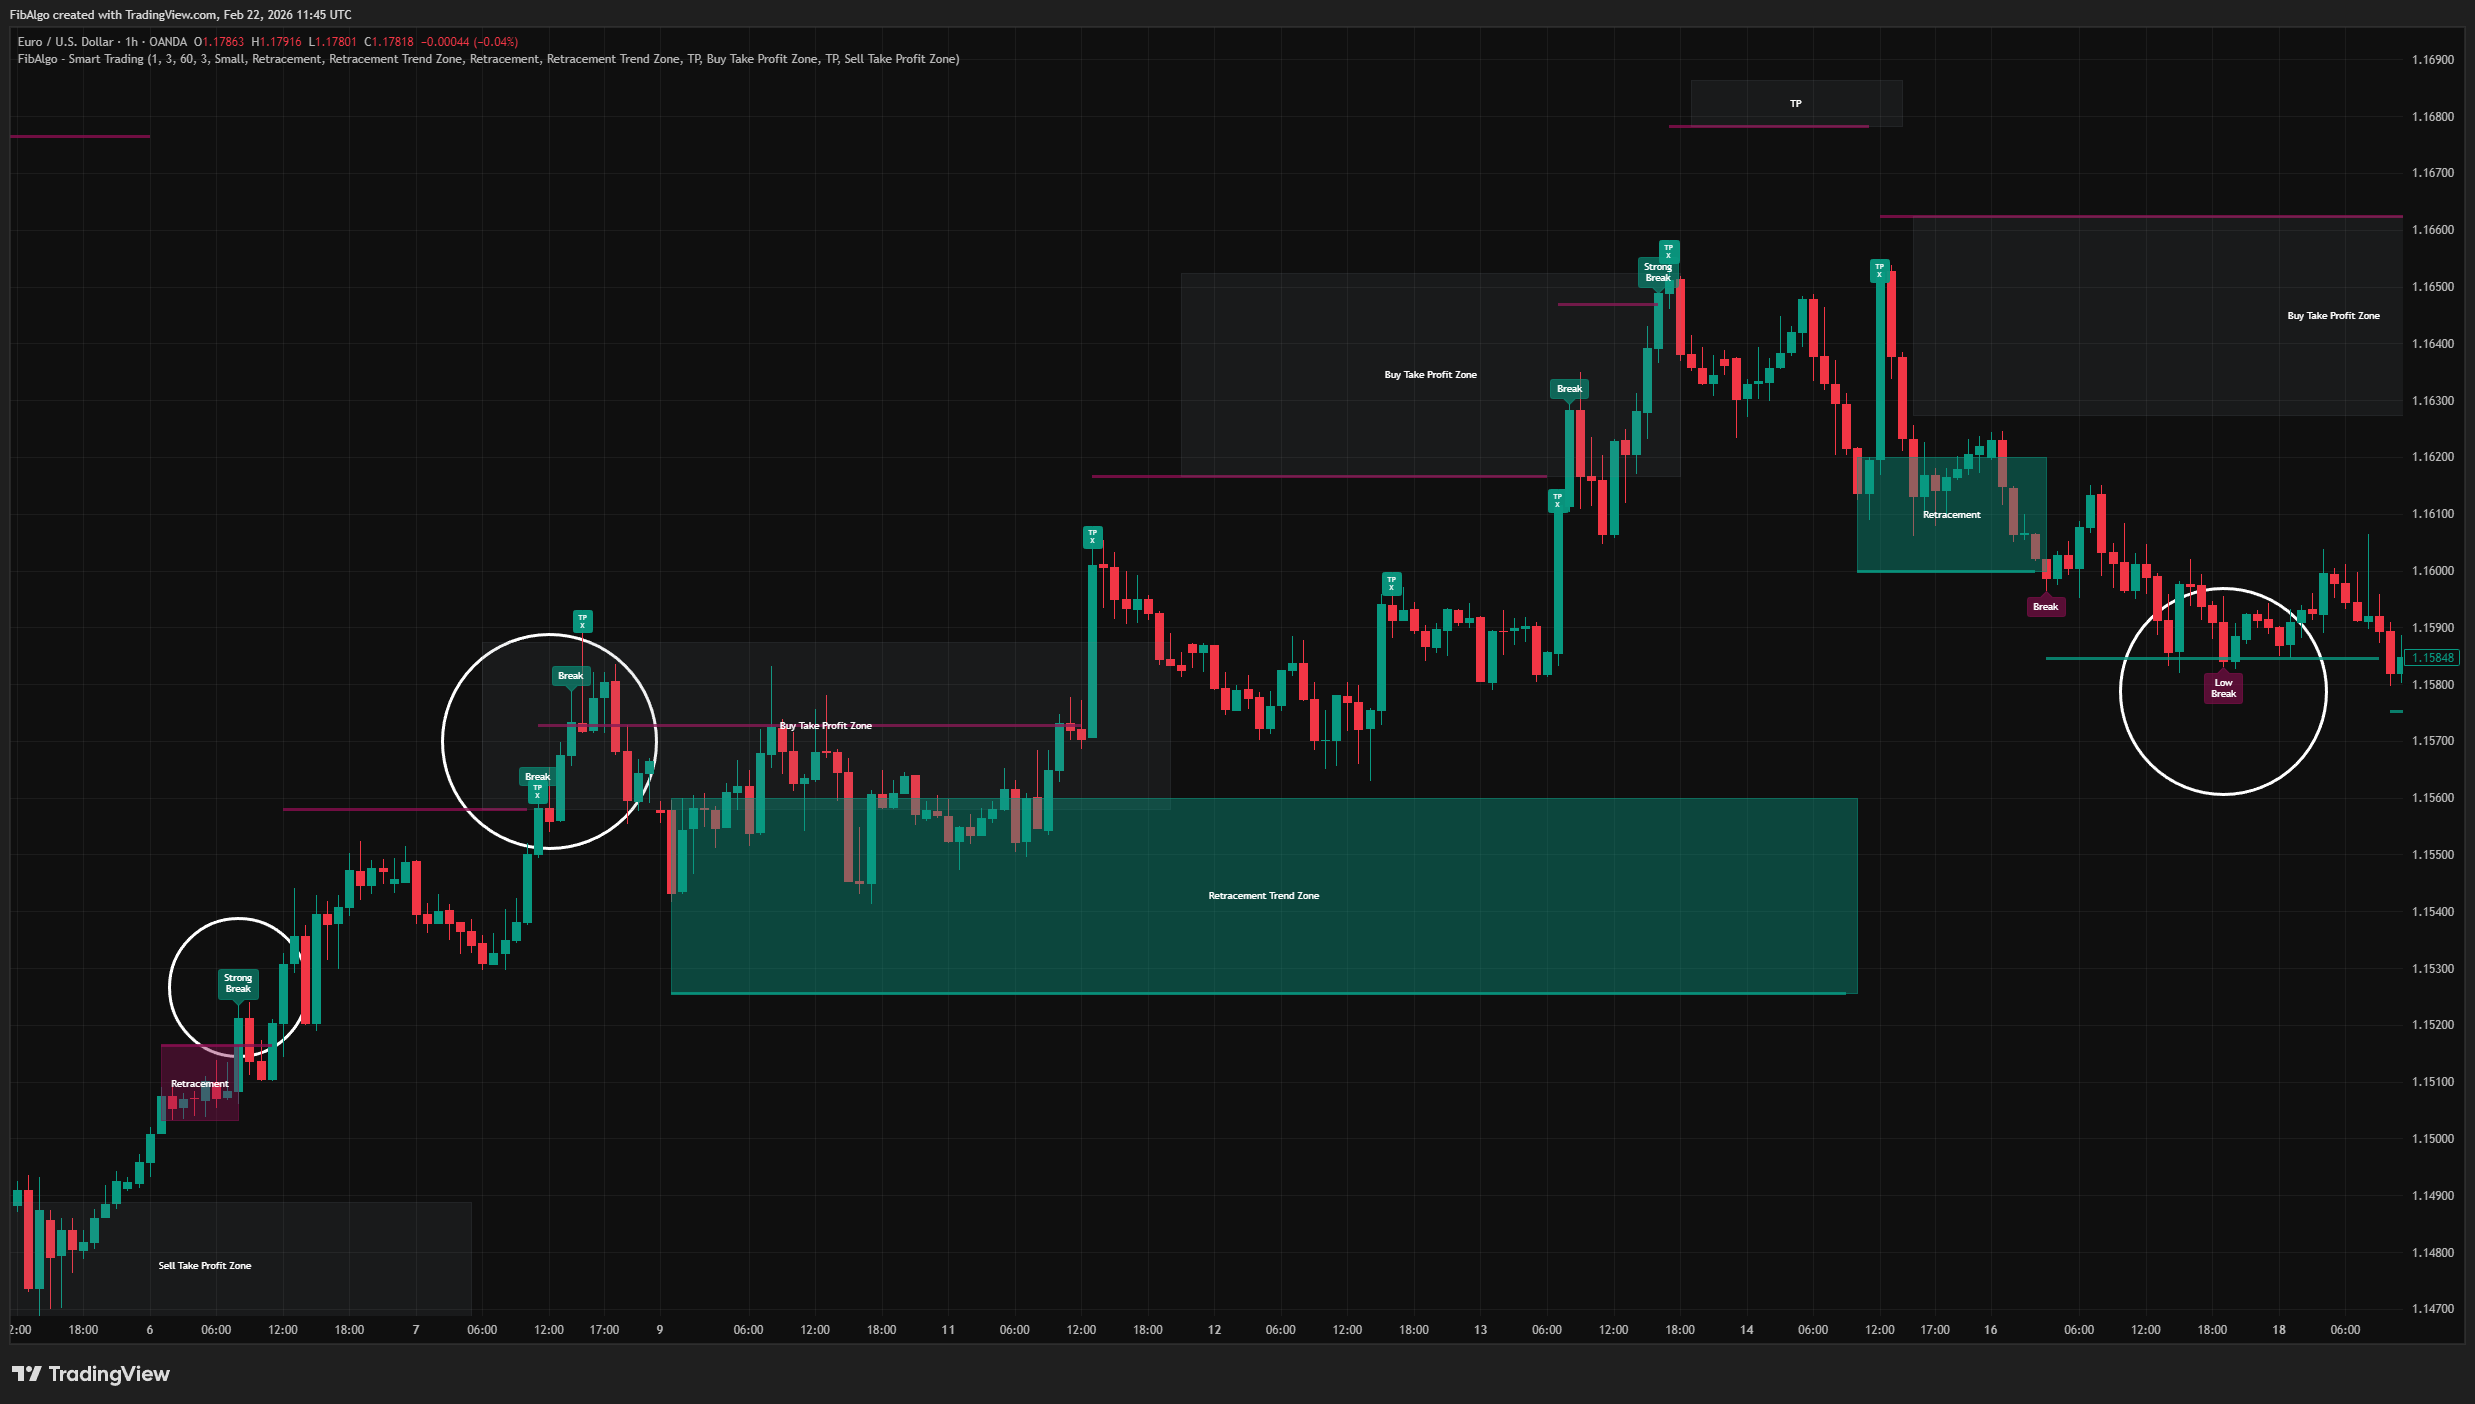
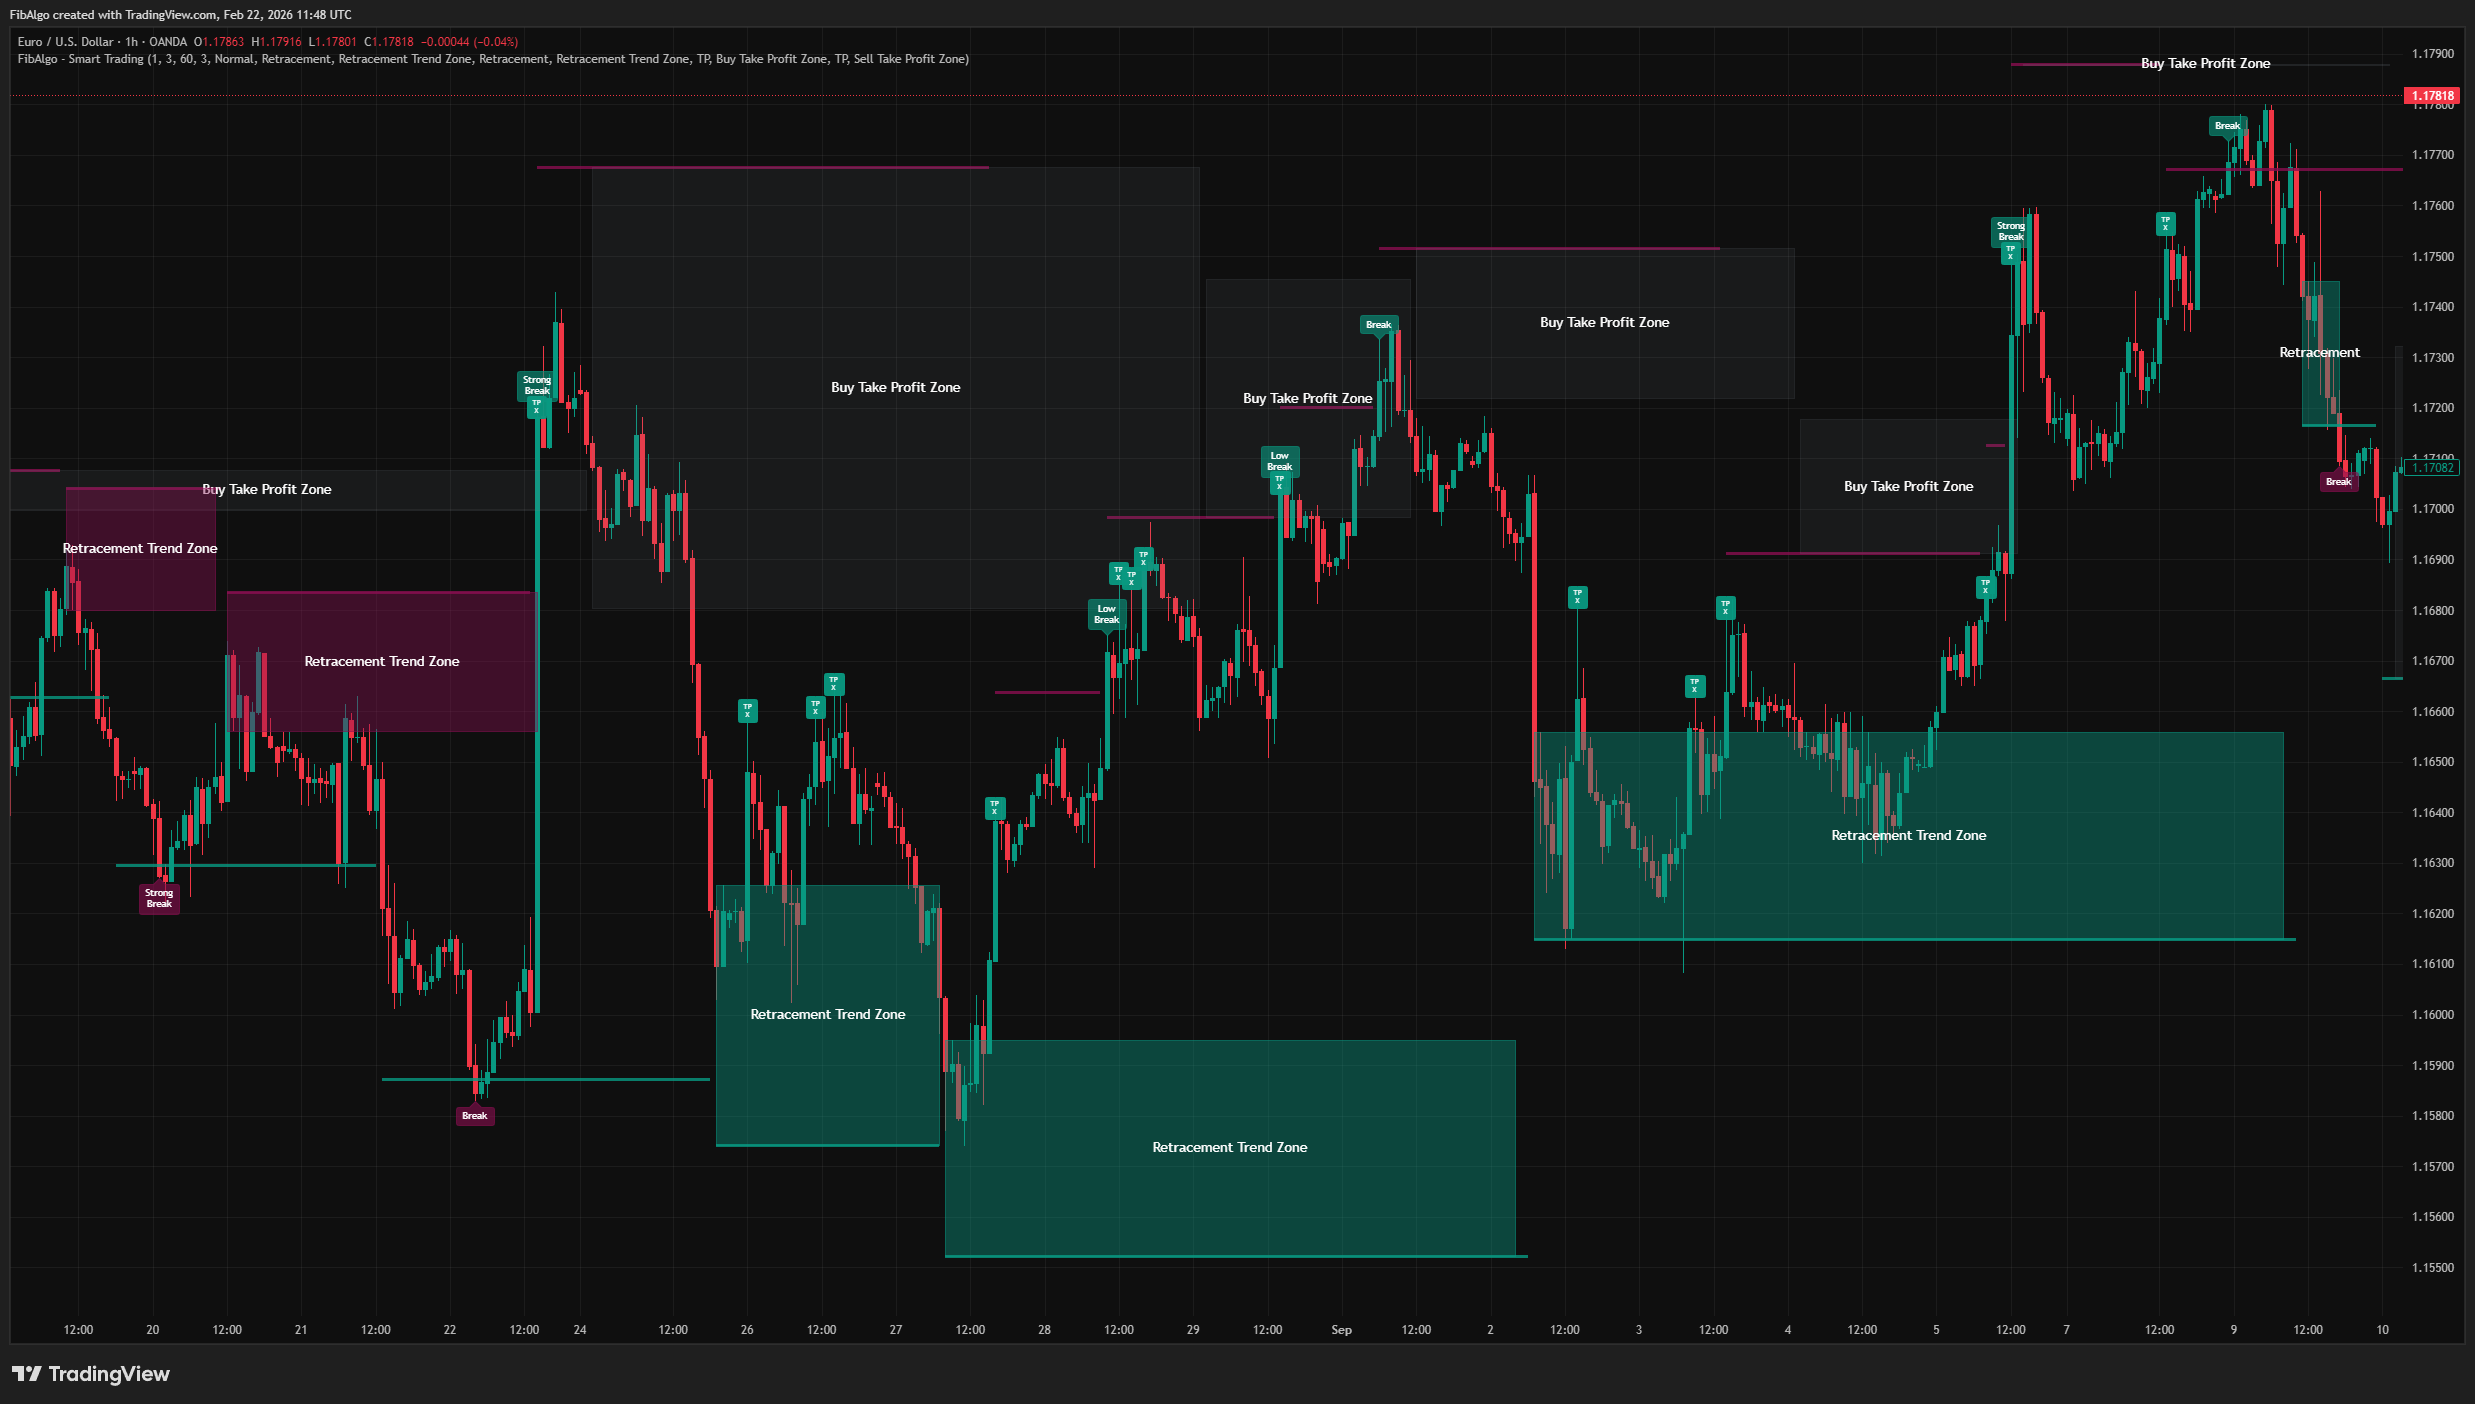
Breakout Strength Classification
Not all breakouts carry the same conviction. This indicator compares the current volatility to a rolling 50-bar average of volatility, and classifies each breakout into one of three tiers:
- Strong Break — Current volatility exceeds 1.4x the rolling average, suggesting high momentum.
- Break (Normal) — Current volatility is within the normal range.
- Low Break — Current volatility is below 0.7x the rolling average, indicating weak momentum.
This classification helps traders gauge the conviction behind a move, not just the direction.
The indicator's logic follows a sequential flow:
Step 1 — Trend Direction
A Supertrend calculation (10-period ATR, user-adjustable multiplier) determines the current trend. Intrabar pressure analysis (comparing close position relative to high-low range) provides secondary confirmation.
Step 2 — Period Detection and S/R Line Placement
When price crosses the Supertrend band upward, a "high period" begins. During this period, the indicator tracks the highest high. When the period ends (intrabar pressure turns negative), a resistance line is drawn at: highest high + volatility measured at the extreme candle.
The same logic applies in reverse for support lines during "low periods."
Step 3 — Breakout Signal Generation
When price closes beyond a S/R line, a breakout signal is generated. The signal is classified as Strong, Normal, or Low based on the current volatility regime. Each S/R line can only trigger one signal (the line is marked as "used" after the first breakout).
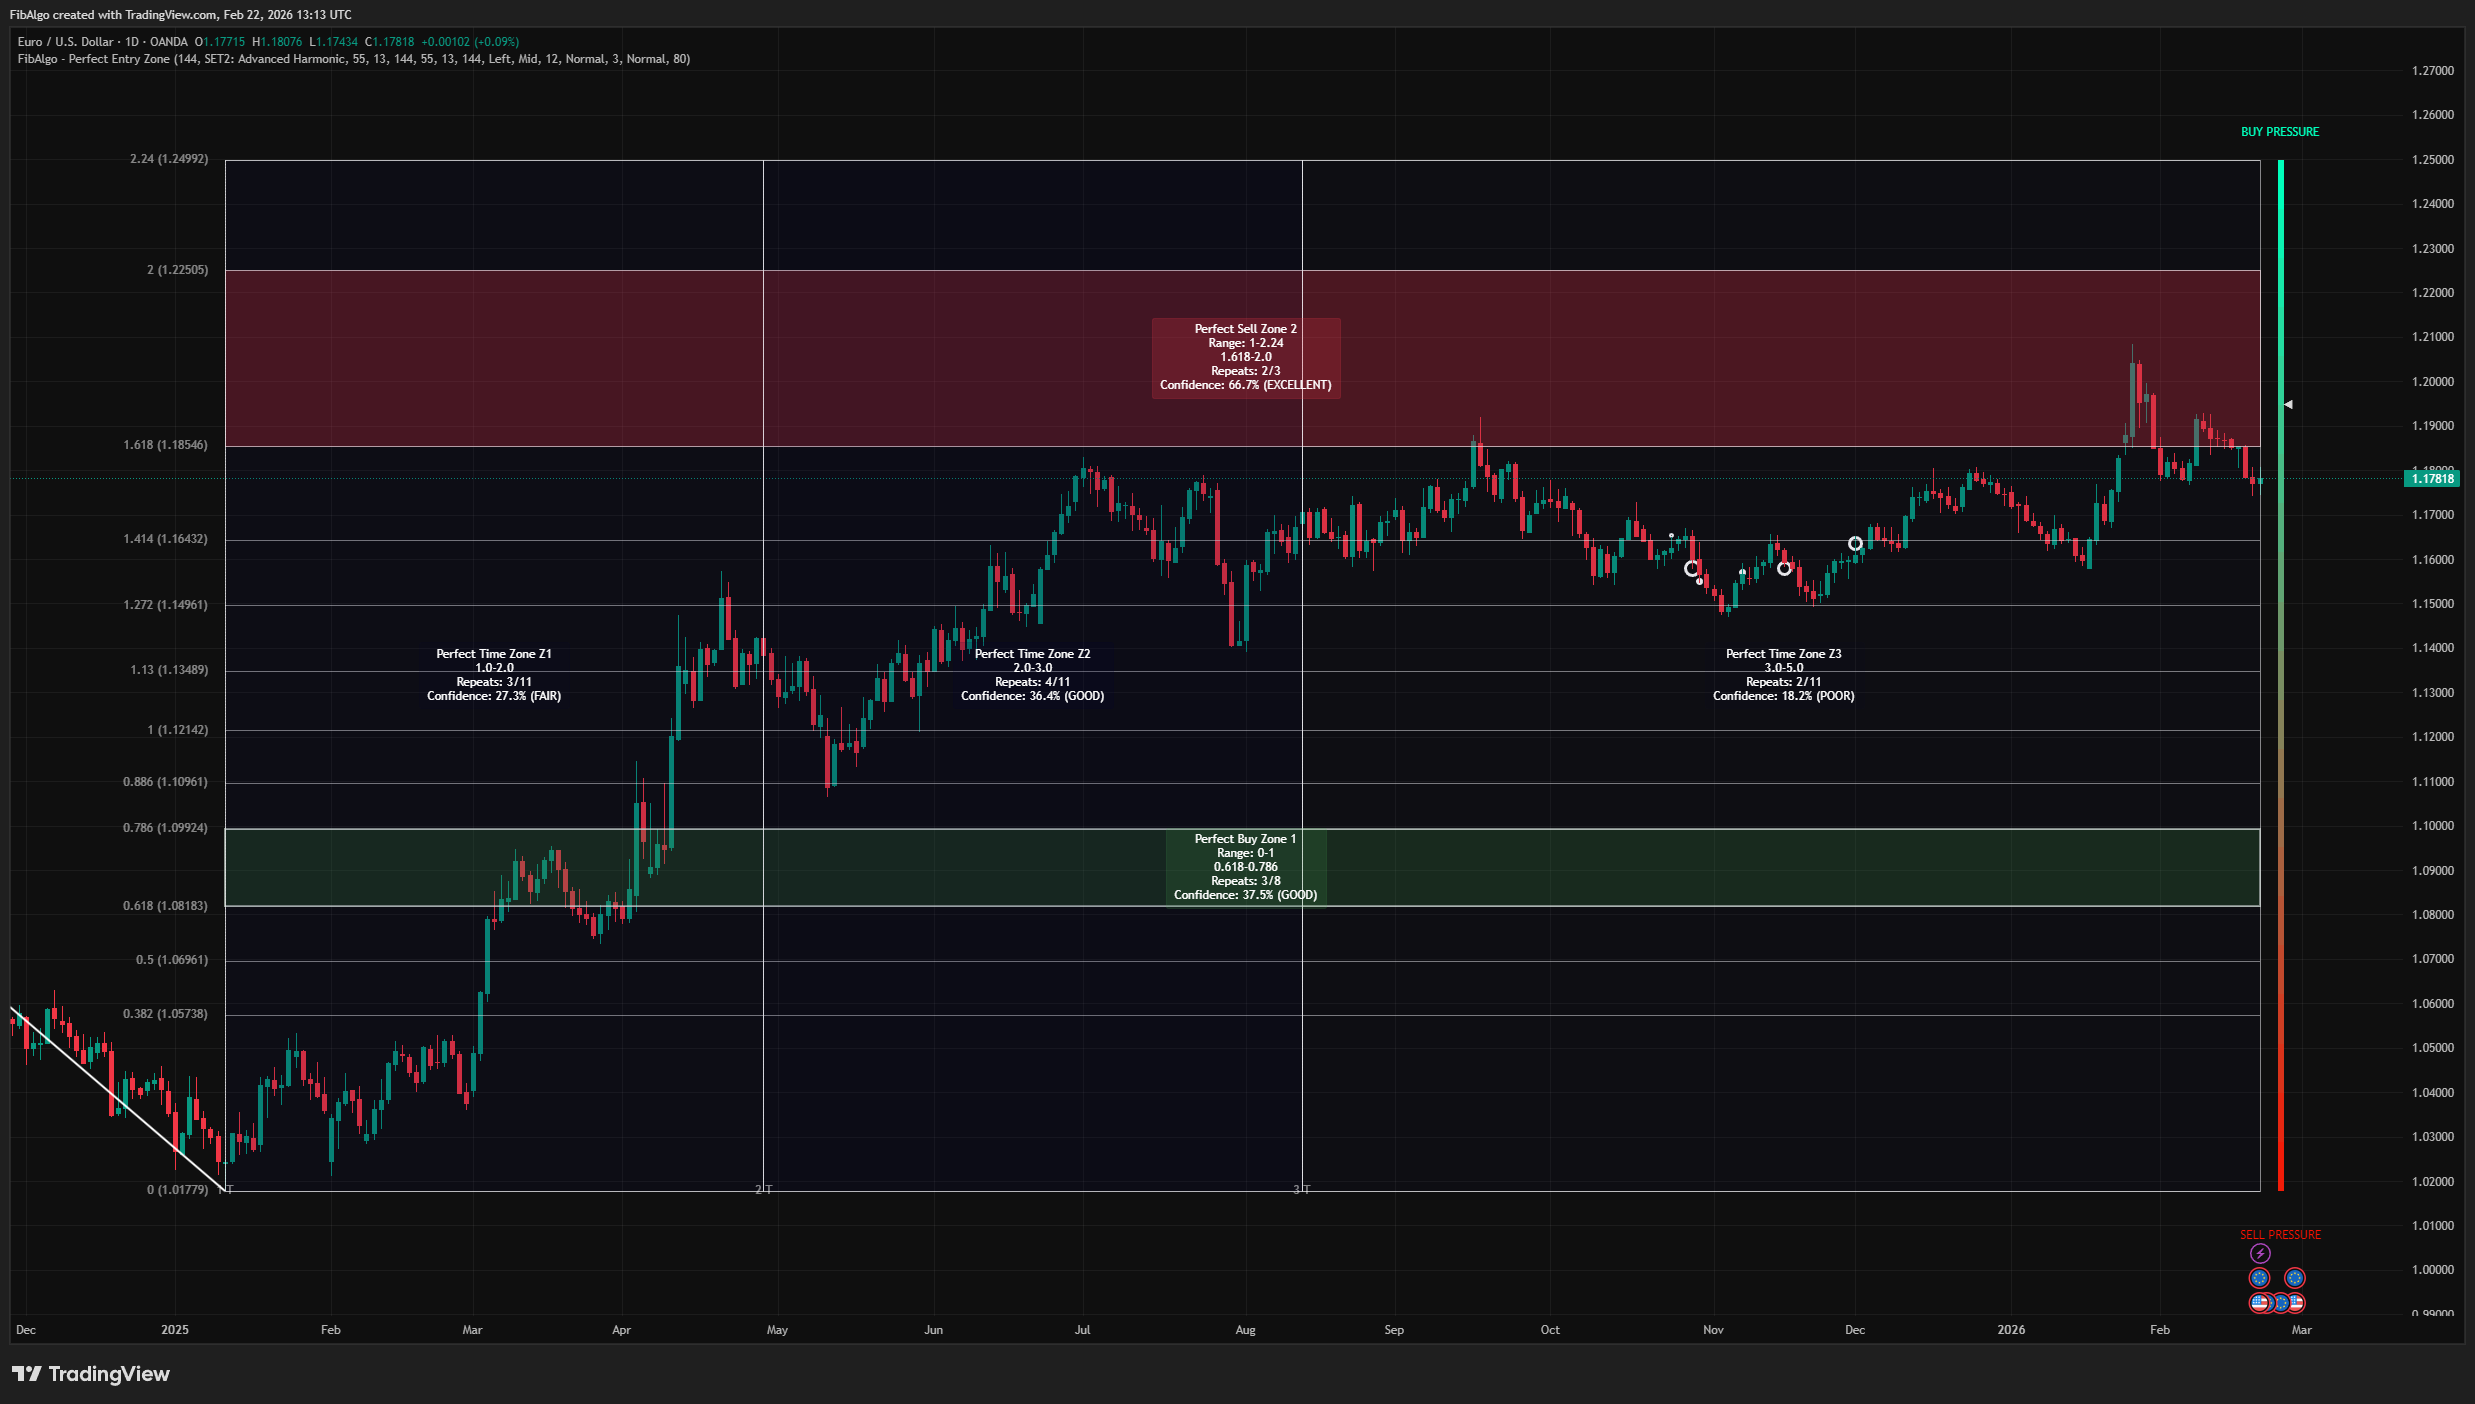
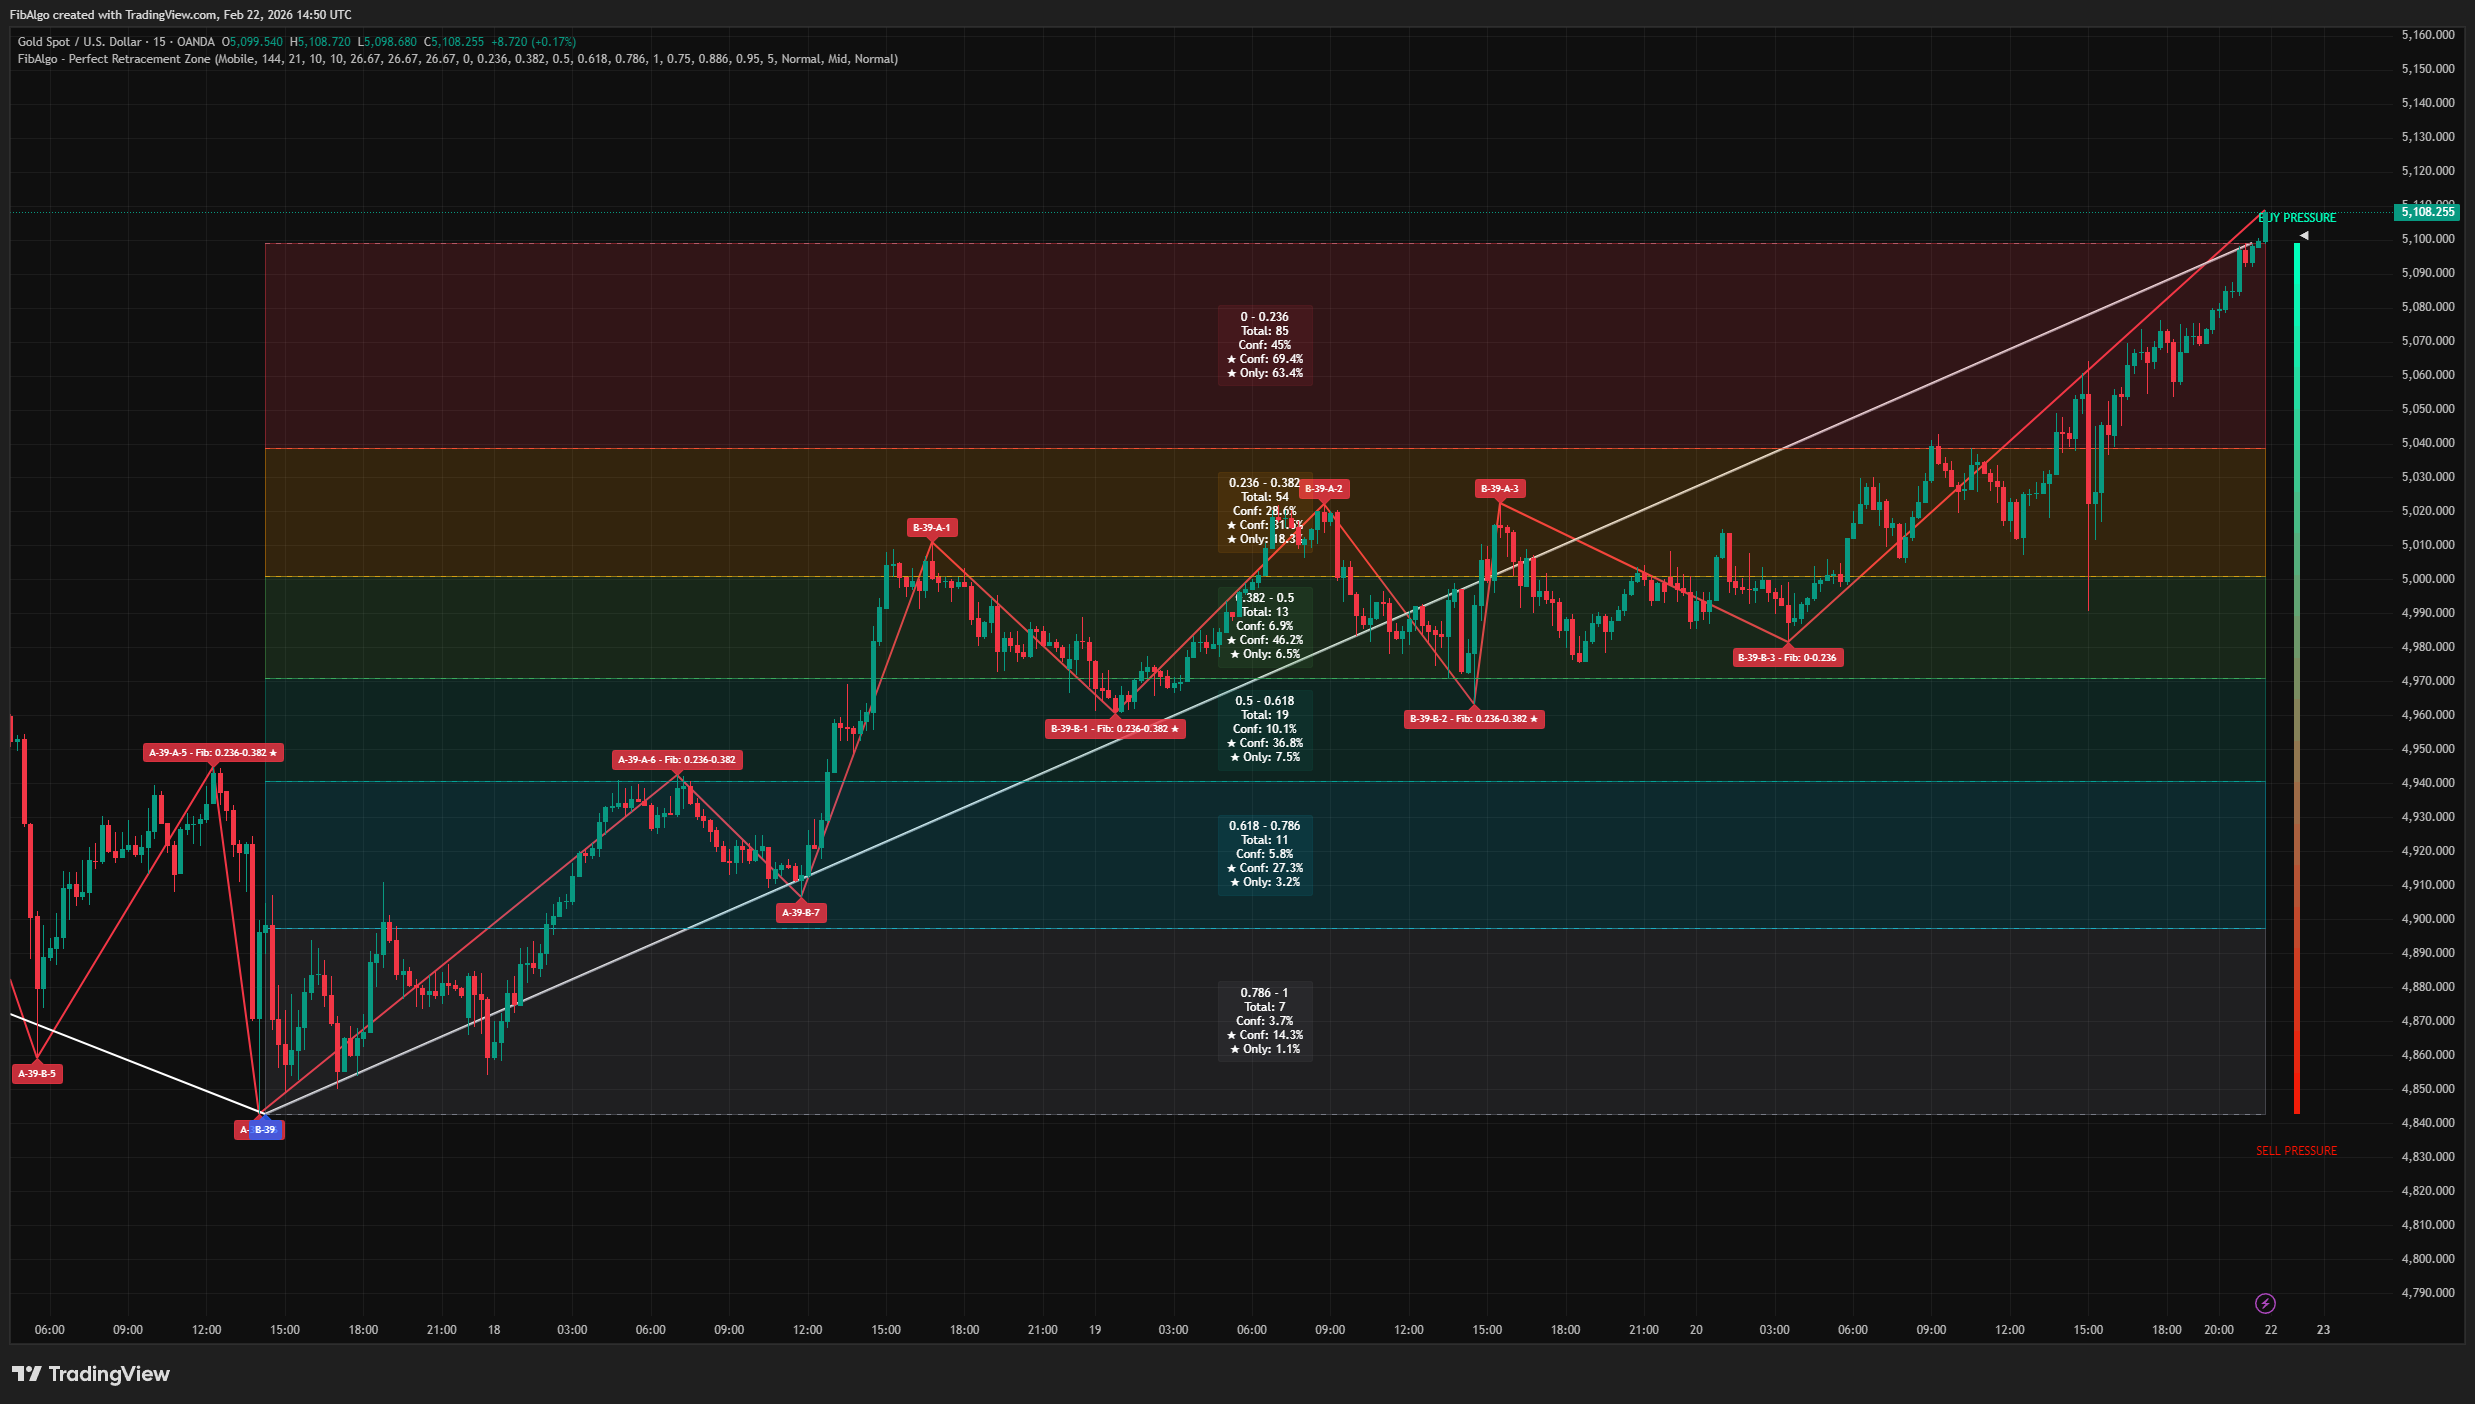
Step 4 — Retracement Zone Drawing
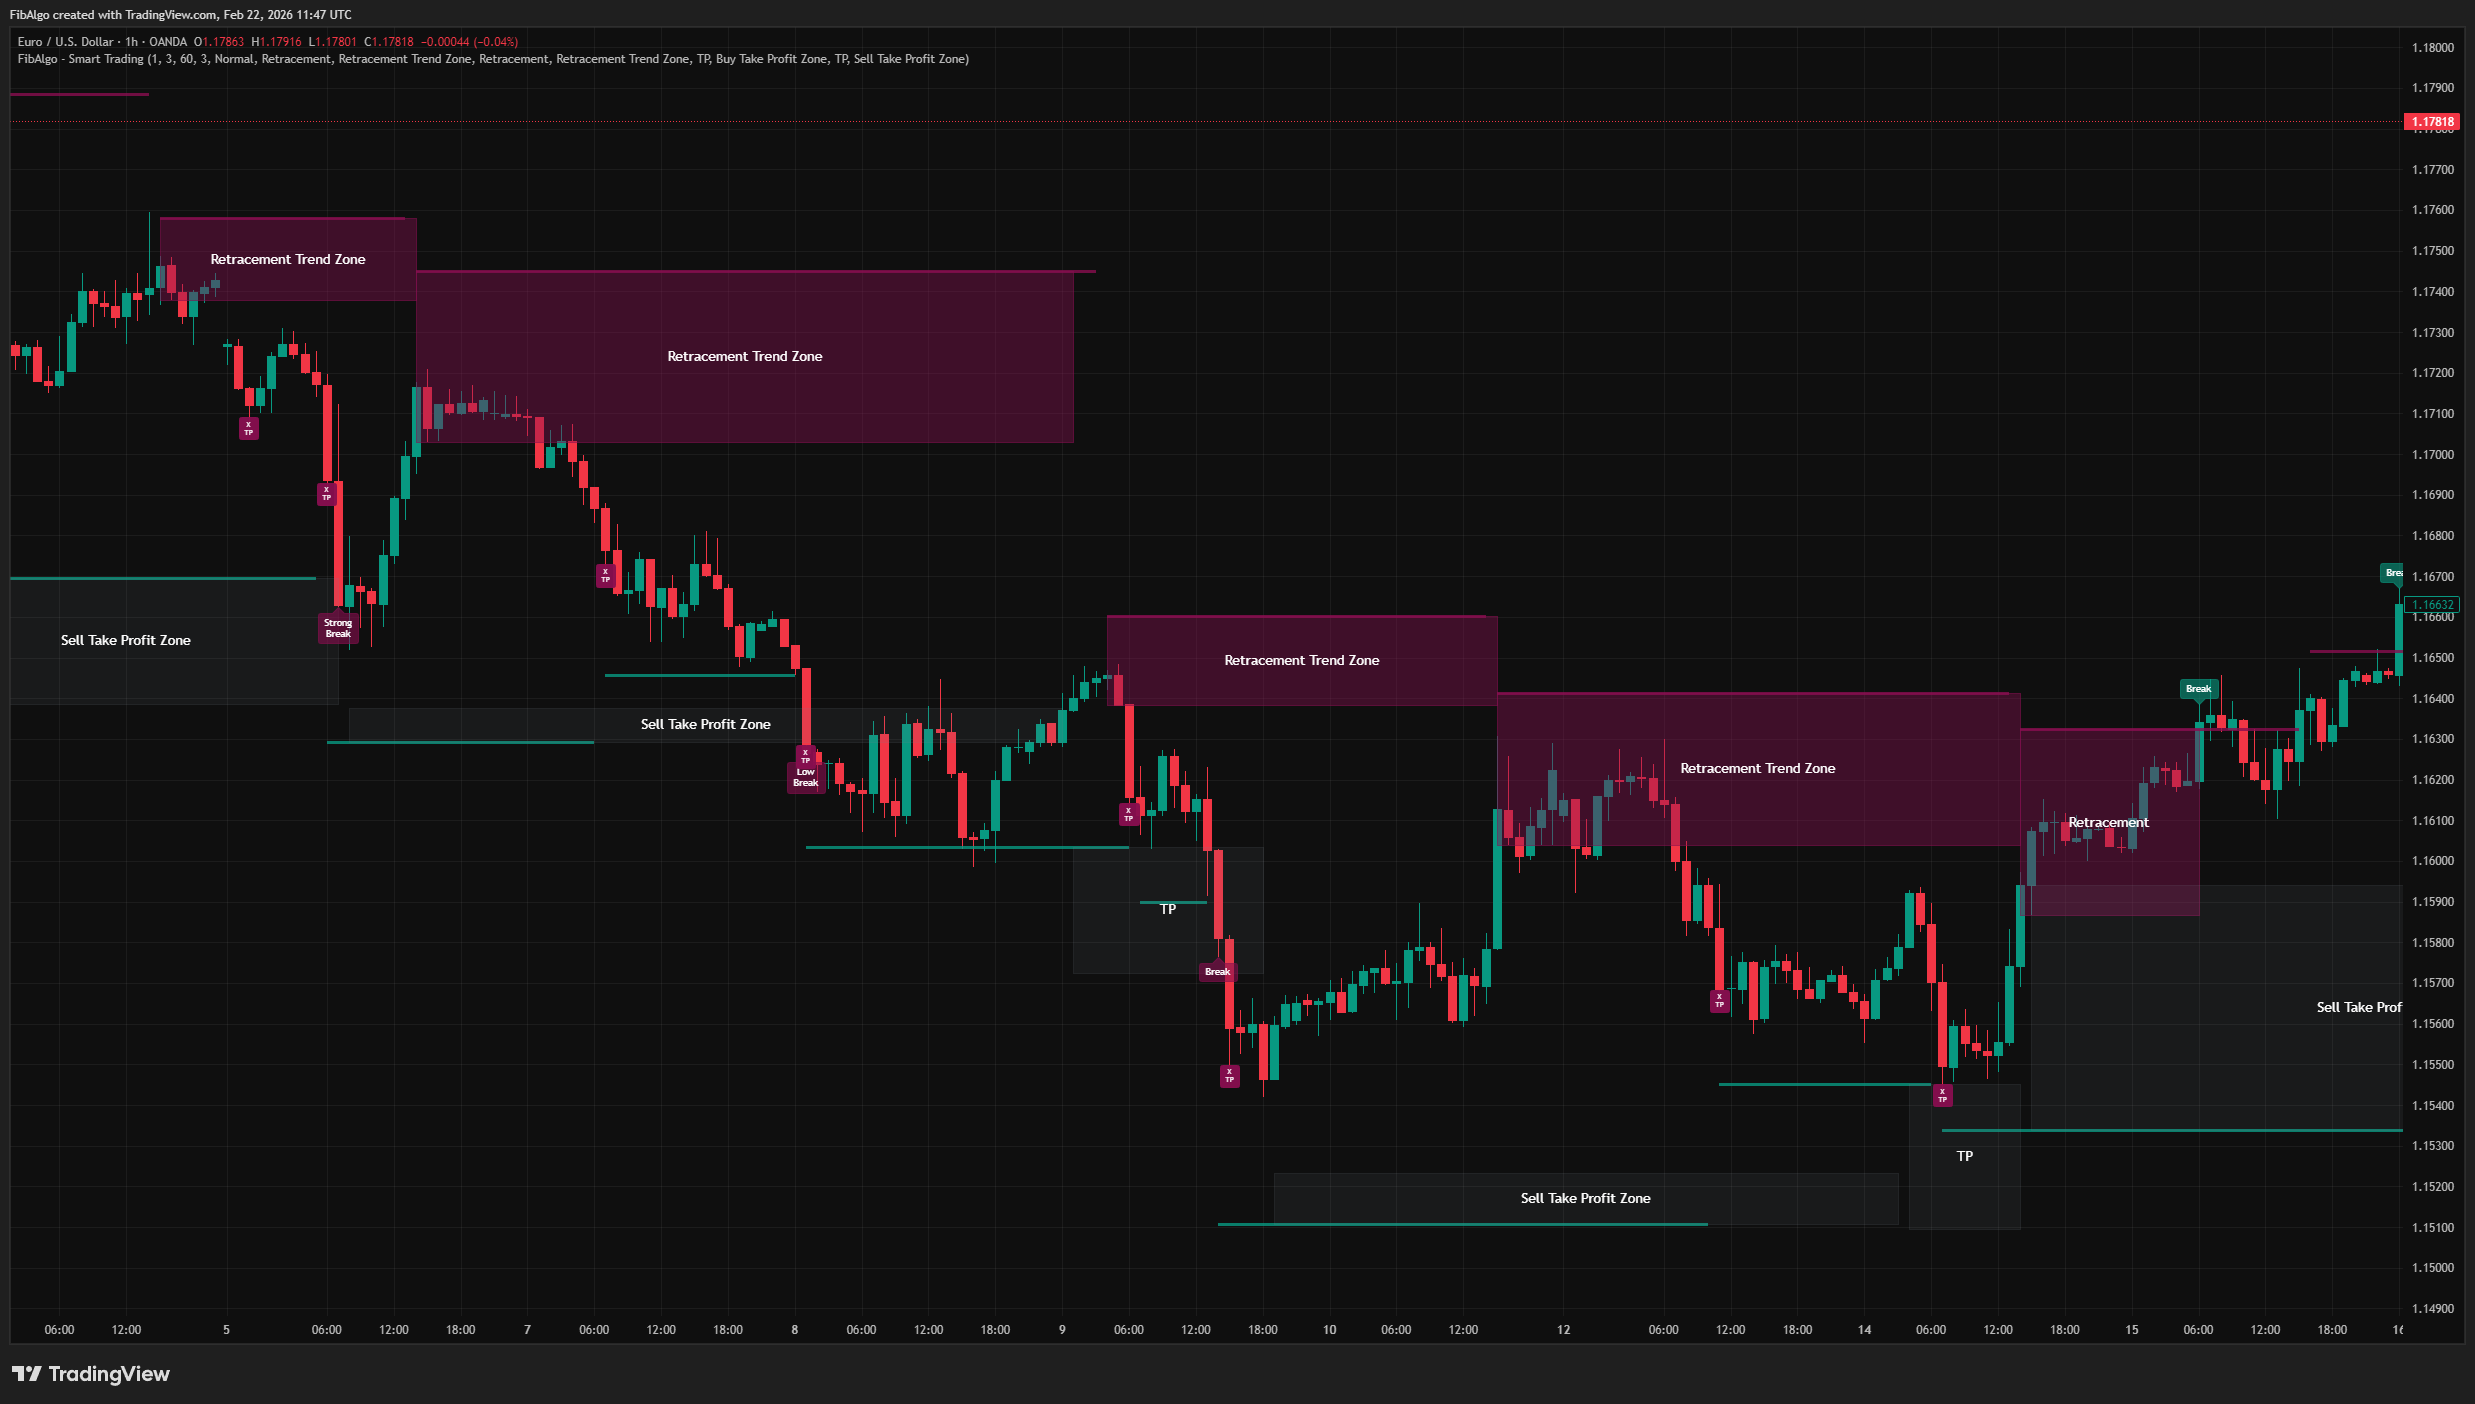
After a sell breakout, if price retraces back toward the resistance line area, a Retracement Sell Zone (box) is drawn. This zone represents the area where price is pulling back into a previous resistance region — a potential continuation zone for the bearish move.
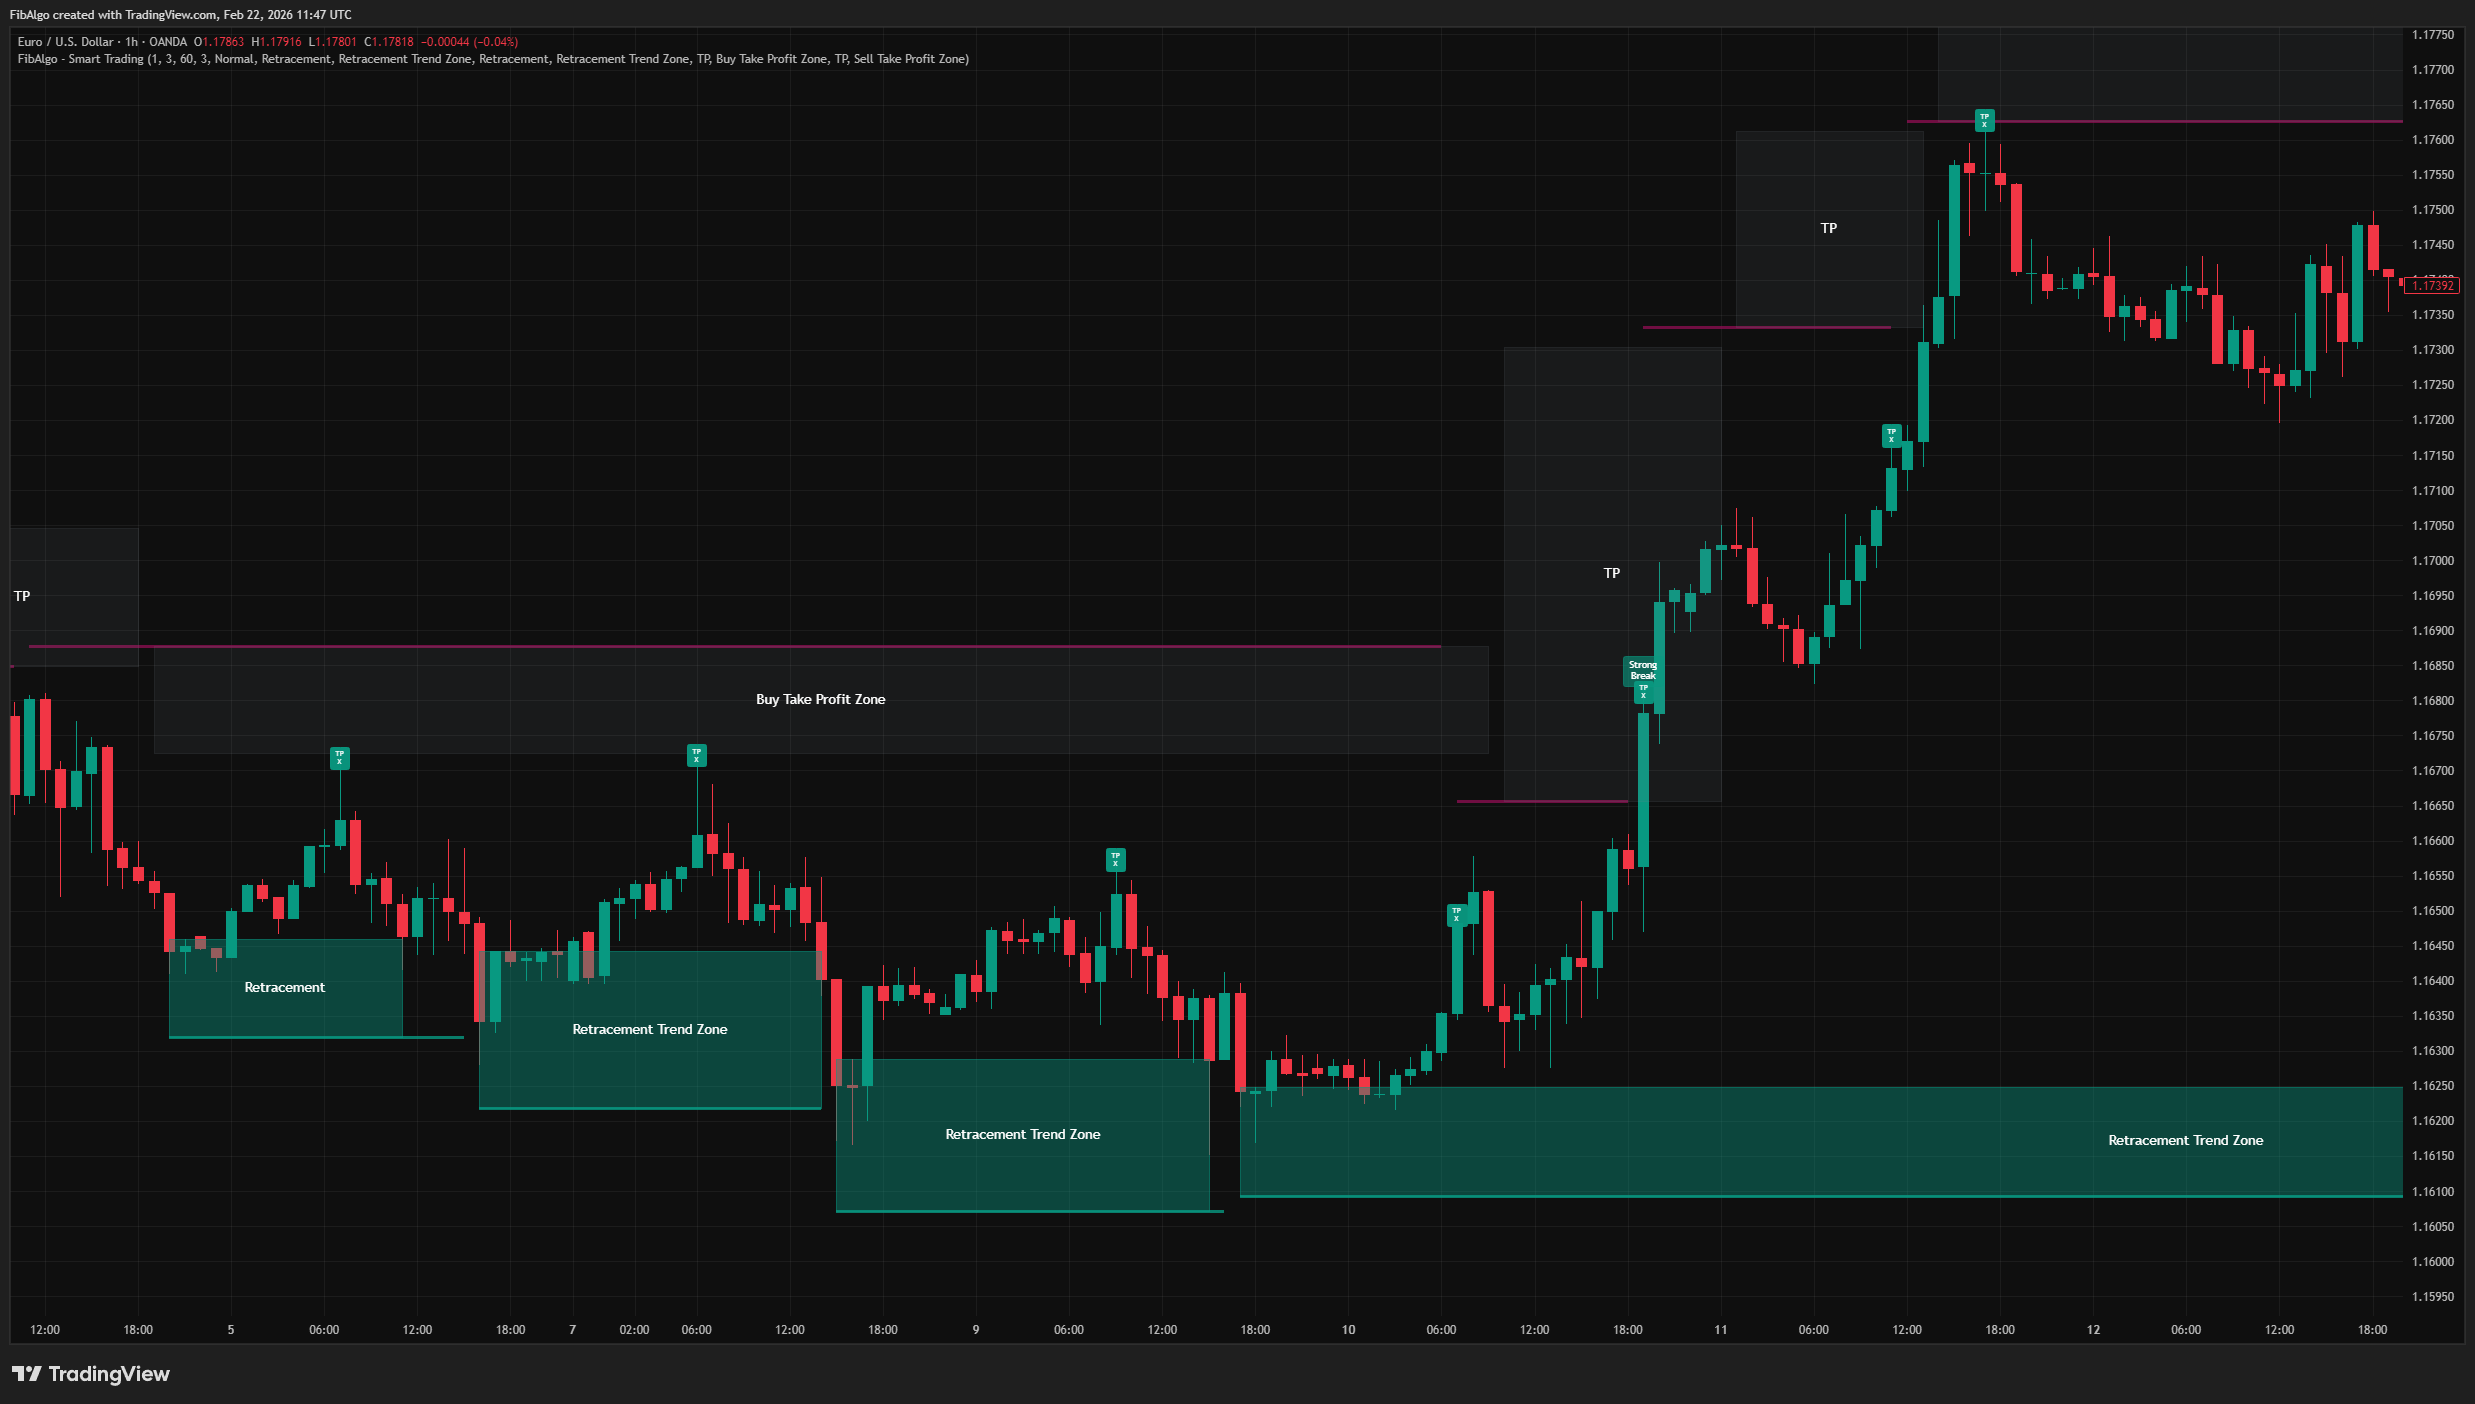
Similarly, after a buy breakout, a Retracement Buy Zone appears when price pulls back toward the support line area.
Step 5 — Take Profit Zone Drawing
When price moves in the breakout direction and approaches the Supertrend band, a TP Zone (box) is drawn. This zone dynamically updates its boundary with the Supertrend value, providing a visual area where the current trend's momentum may be weakening.
Step 6 — HTF Trend Filter (Optional)
An optional higher-timeframe trend filter can be enabled. This recomputes the Supertrend on a user-selected higher timeframe via request.security(). When active, buy-side signals and zones only appear when the HTF trend is bullish, and sell-side signals only appear when the HTF trend is bearish. This helps filter out counter-trend setups.
Dynamic S/R Lines
- Resistance and support lines adjust automatically based on measured volatility.
- Lines extend right by default and update as new periods form.
- Line colors and visibility are fully customizable.
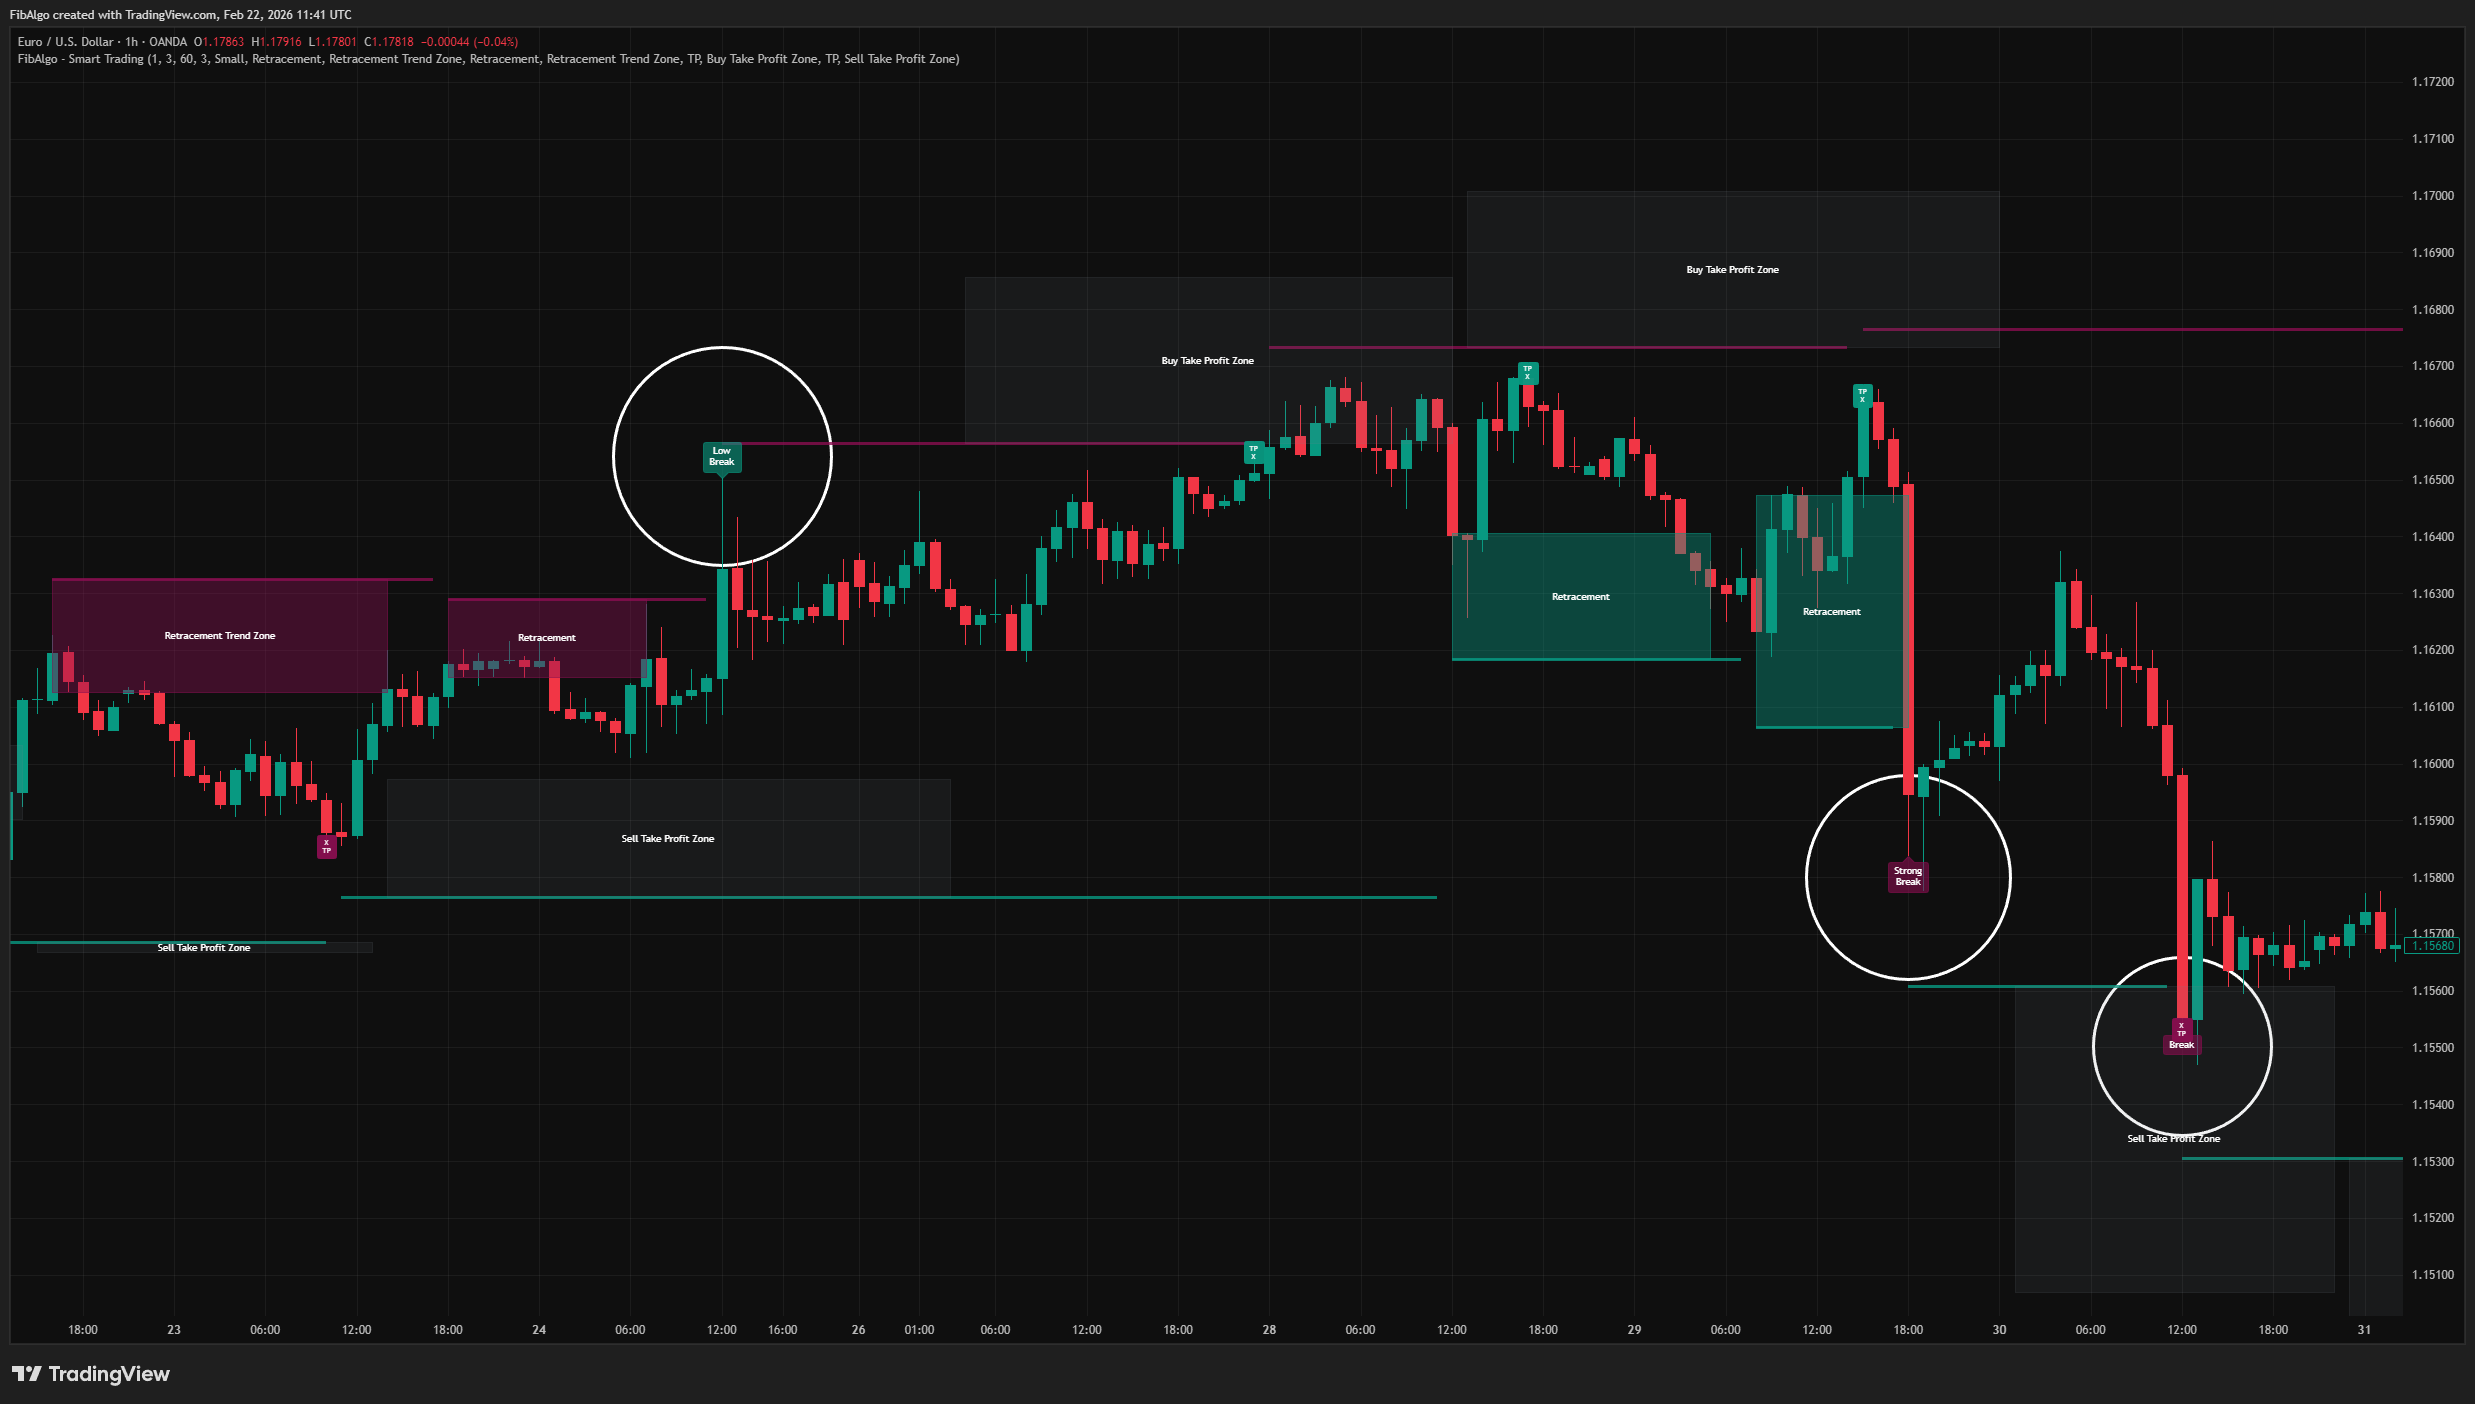
Breakout Classification Labels
- Each breakout is labeled directly on the chart as "Strong Break," "Break," or "Low Break."
- Labels are color-coded: teal for bullish breakouts, maroon for bearish breakouts.
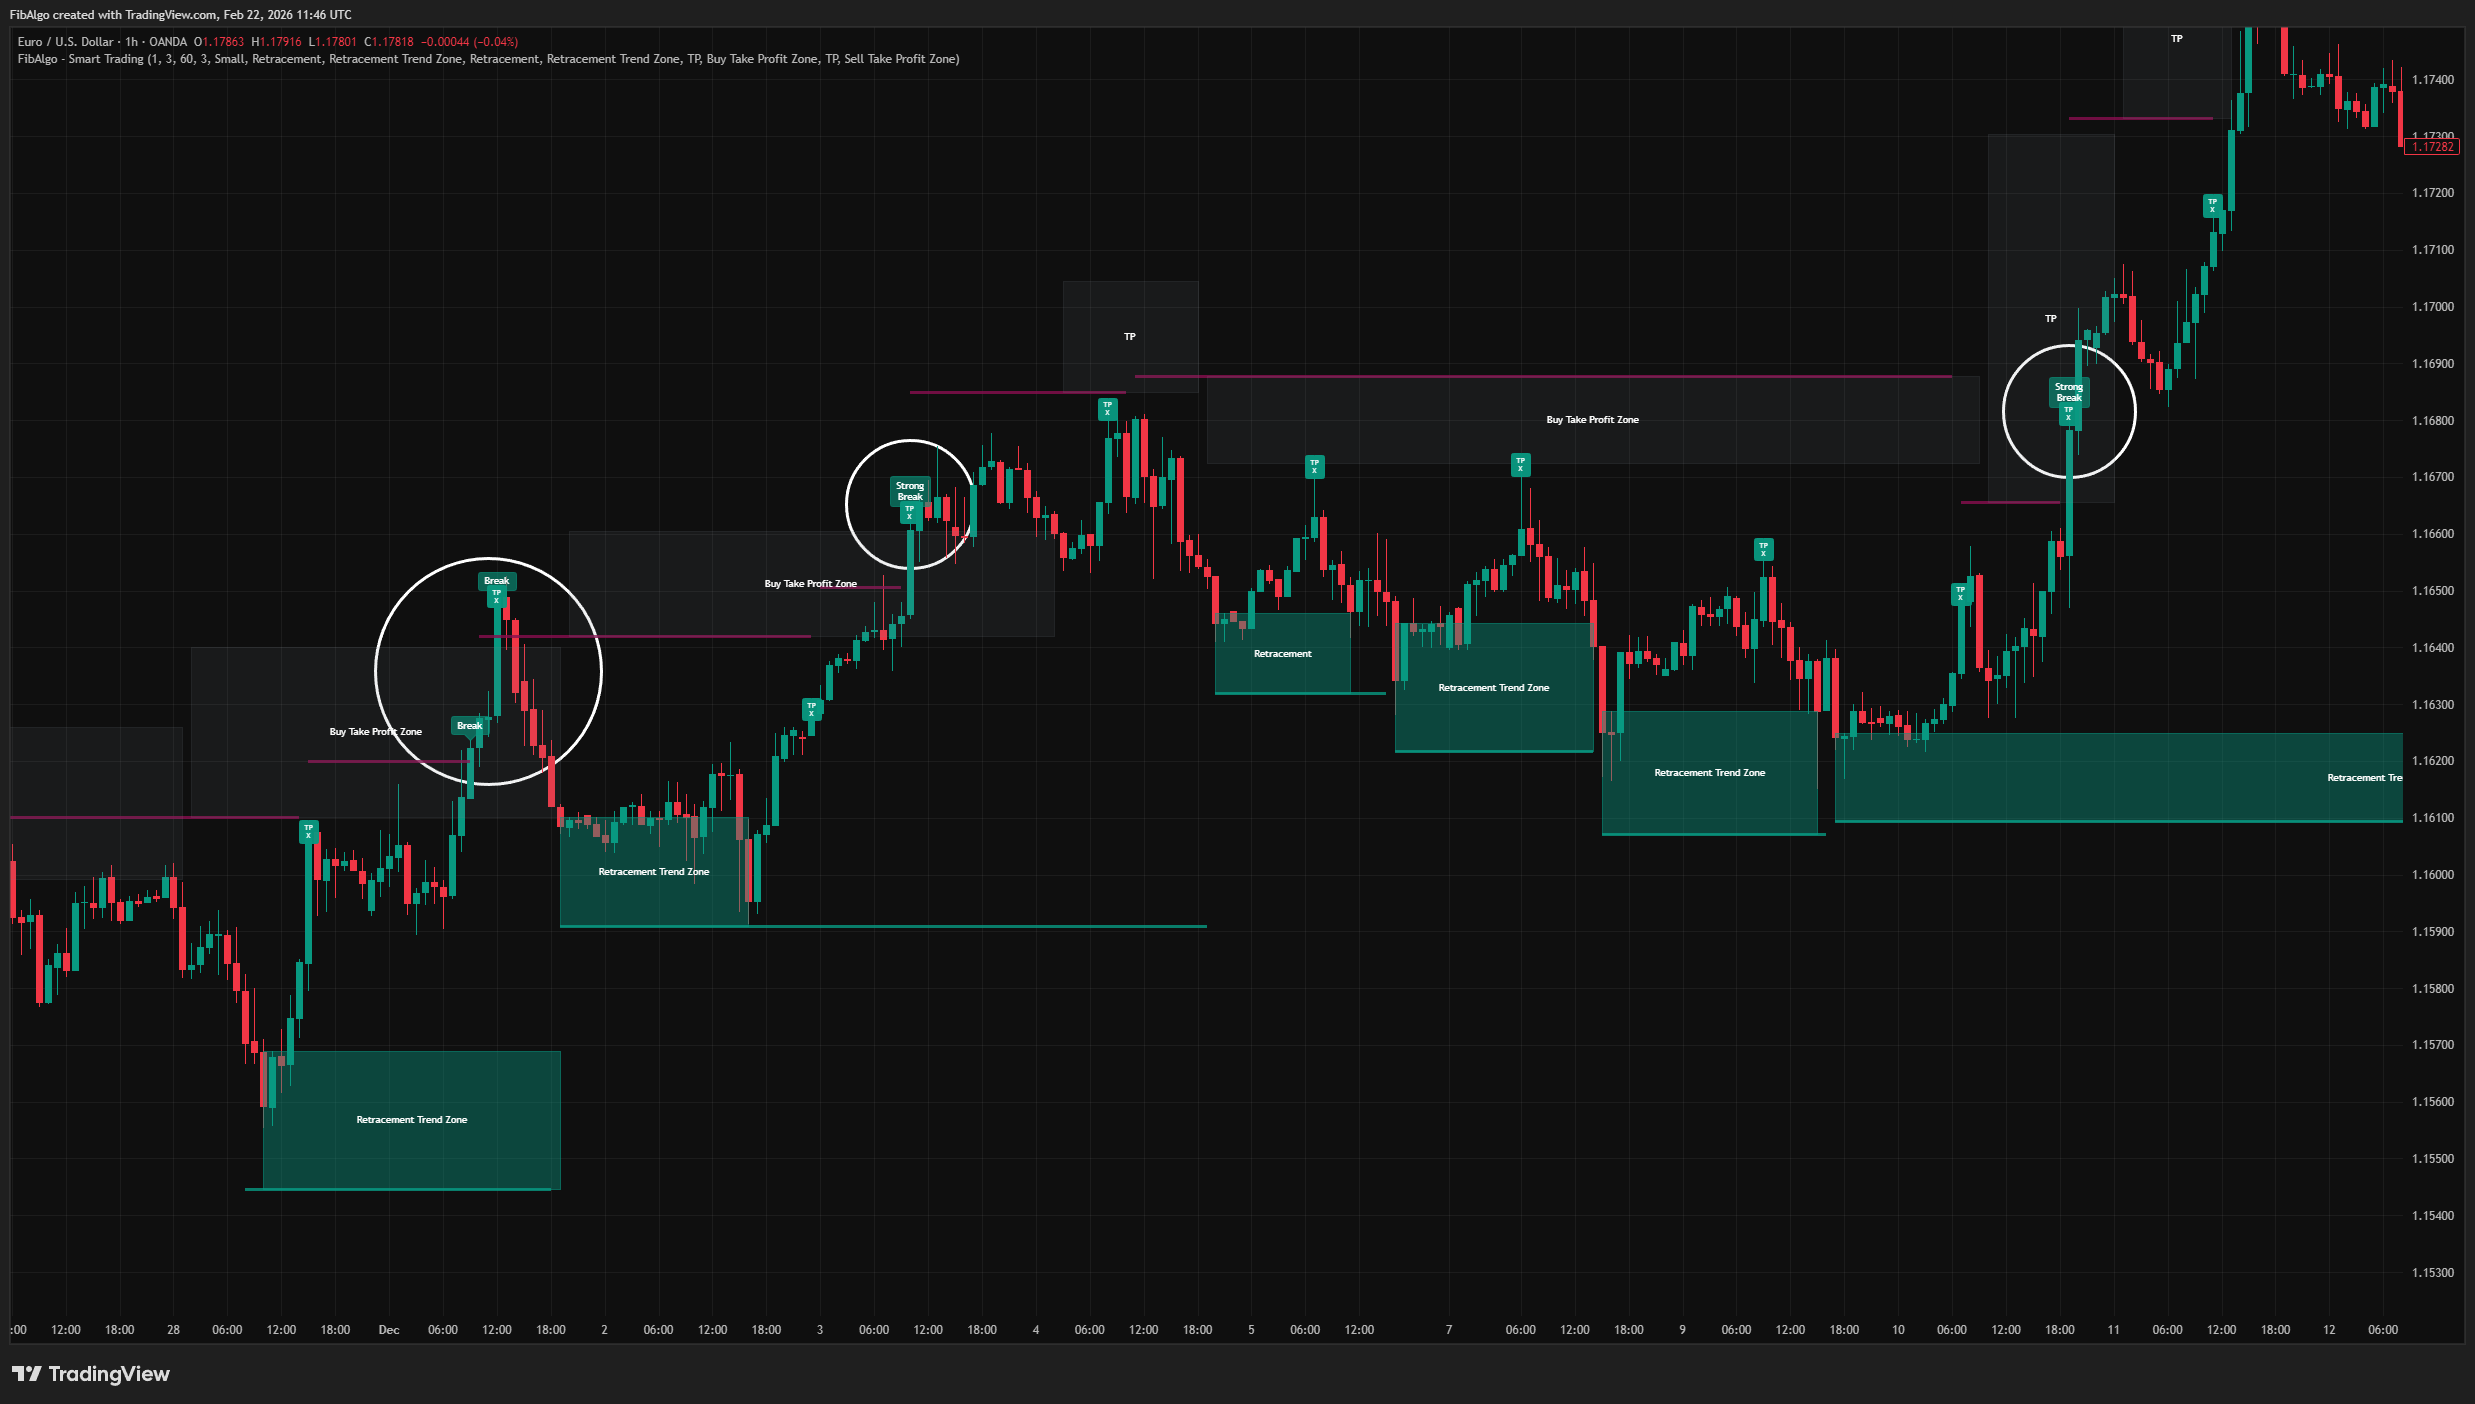
Retracement Zones
- Colored boxes drawn when price retraces into a previous S/R area after a breakout.
- Zones are terminated when price reclaims the Supertrend band or an opposite signal appears.
- Zones receive a descriptive label ("Retracement Trend Zone") after persisting for more than 20 bars.
- Zone text labels are fully customizable through inputs.
Take Profit Zones
- TP zones appear on the opposite side of the breakout direction.
- The zone boundary dynamically follows the Supertrend band.
- A small "TP X" label marks the moment price first enters the TP zone.
- Last closed TP zones continue to extend until a new TP box forms.
HTF Trend Filter
- Optional higher-timeframe Supertrend trend alignment.
- Configurable HTF resolution and sensitivity.
- Optional floating label showing current HTF trend direction.
Comprehensive Alert System
- Alerts for breakouts (up/down, normal and strong separately).
- Alerts for retracement zone creation.
- Alerts for zone entry and exit events with directional information (exited UP / DOWN / SIDE).
- Alerts for TP zone touch events.
- Optional price details (top, bottom, close) included in alert messages.
- All alerts are individually toggleable.
Getting Started
Add the indicator to any chart. The default settings (Volatility Buffer Sensitivity: 1.0, Trend Volatility Sensitivity: 3.0) work well for most liquid instruments on the 1H to 4H timeframes.
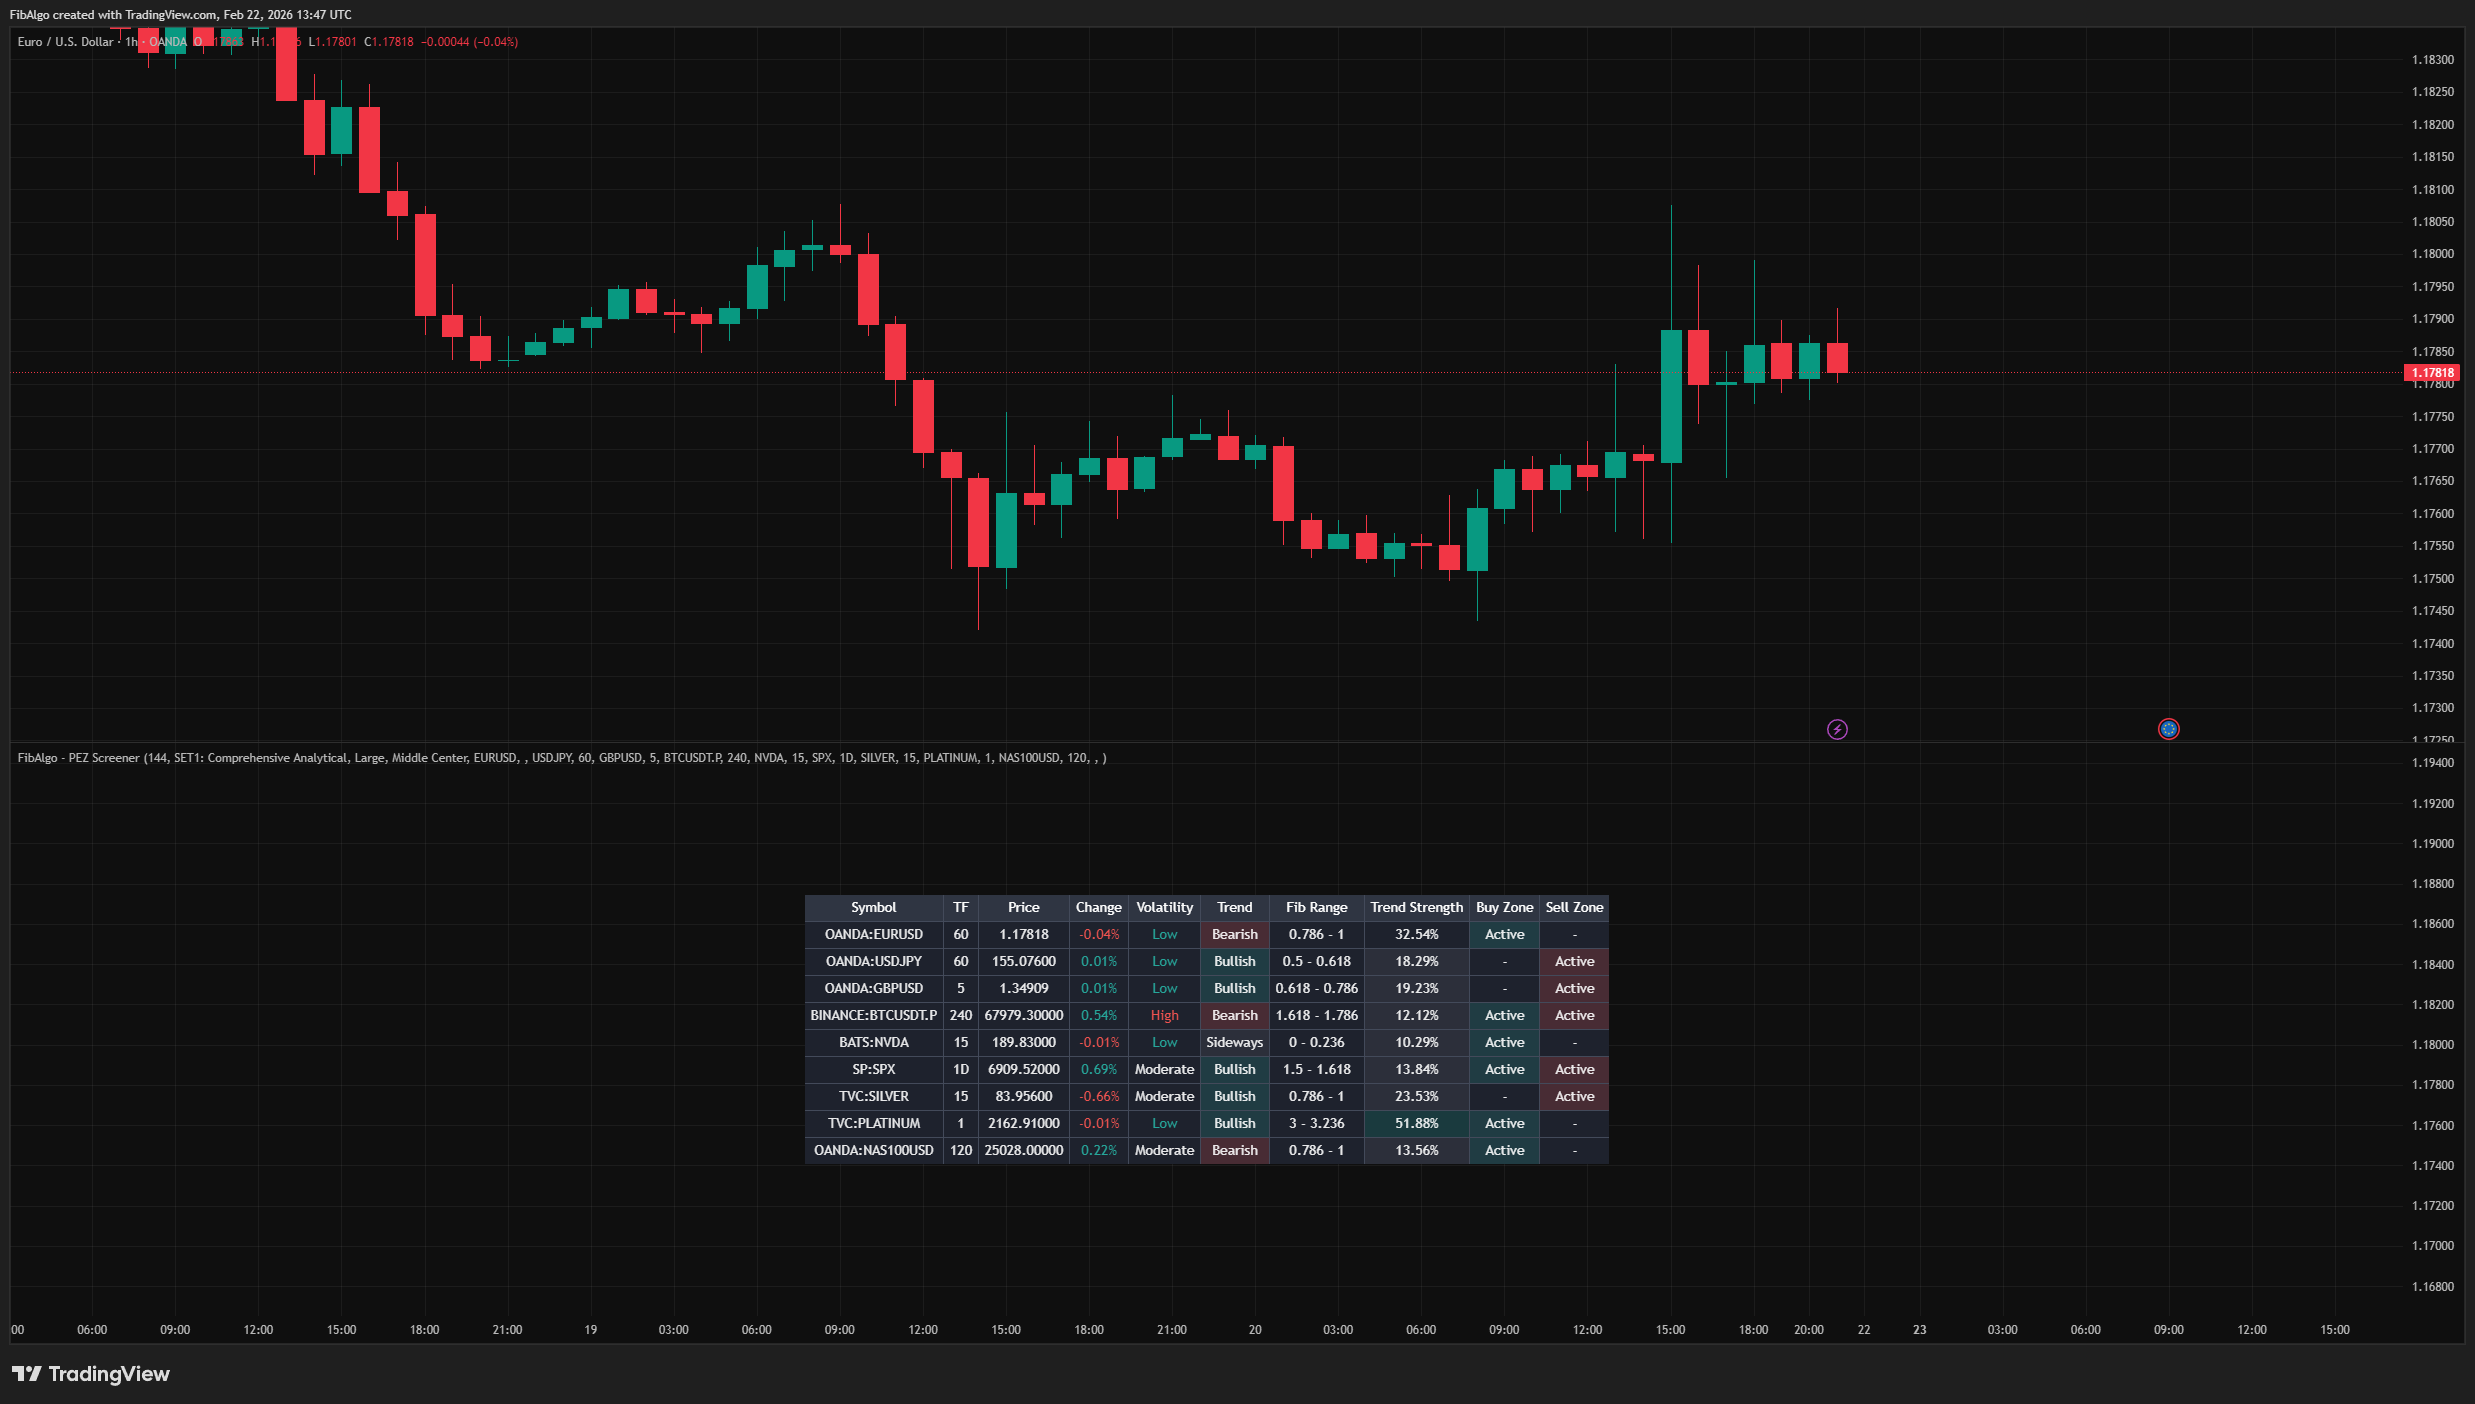
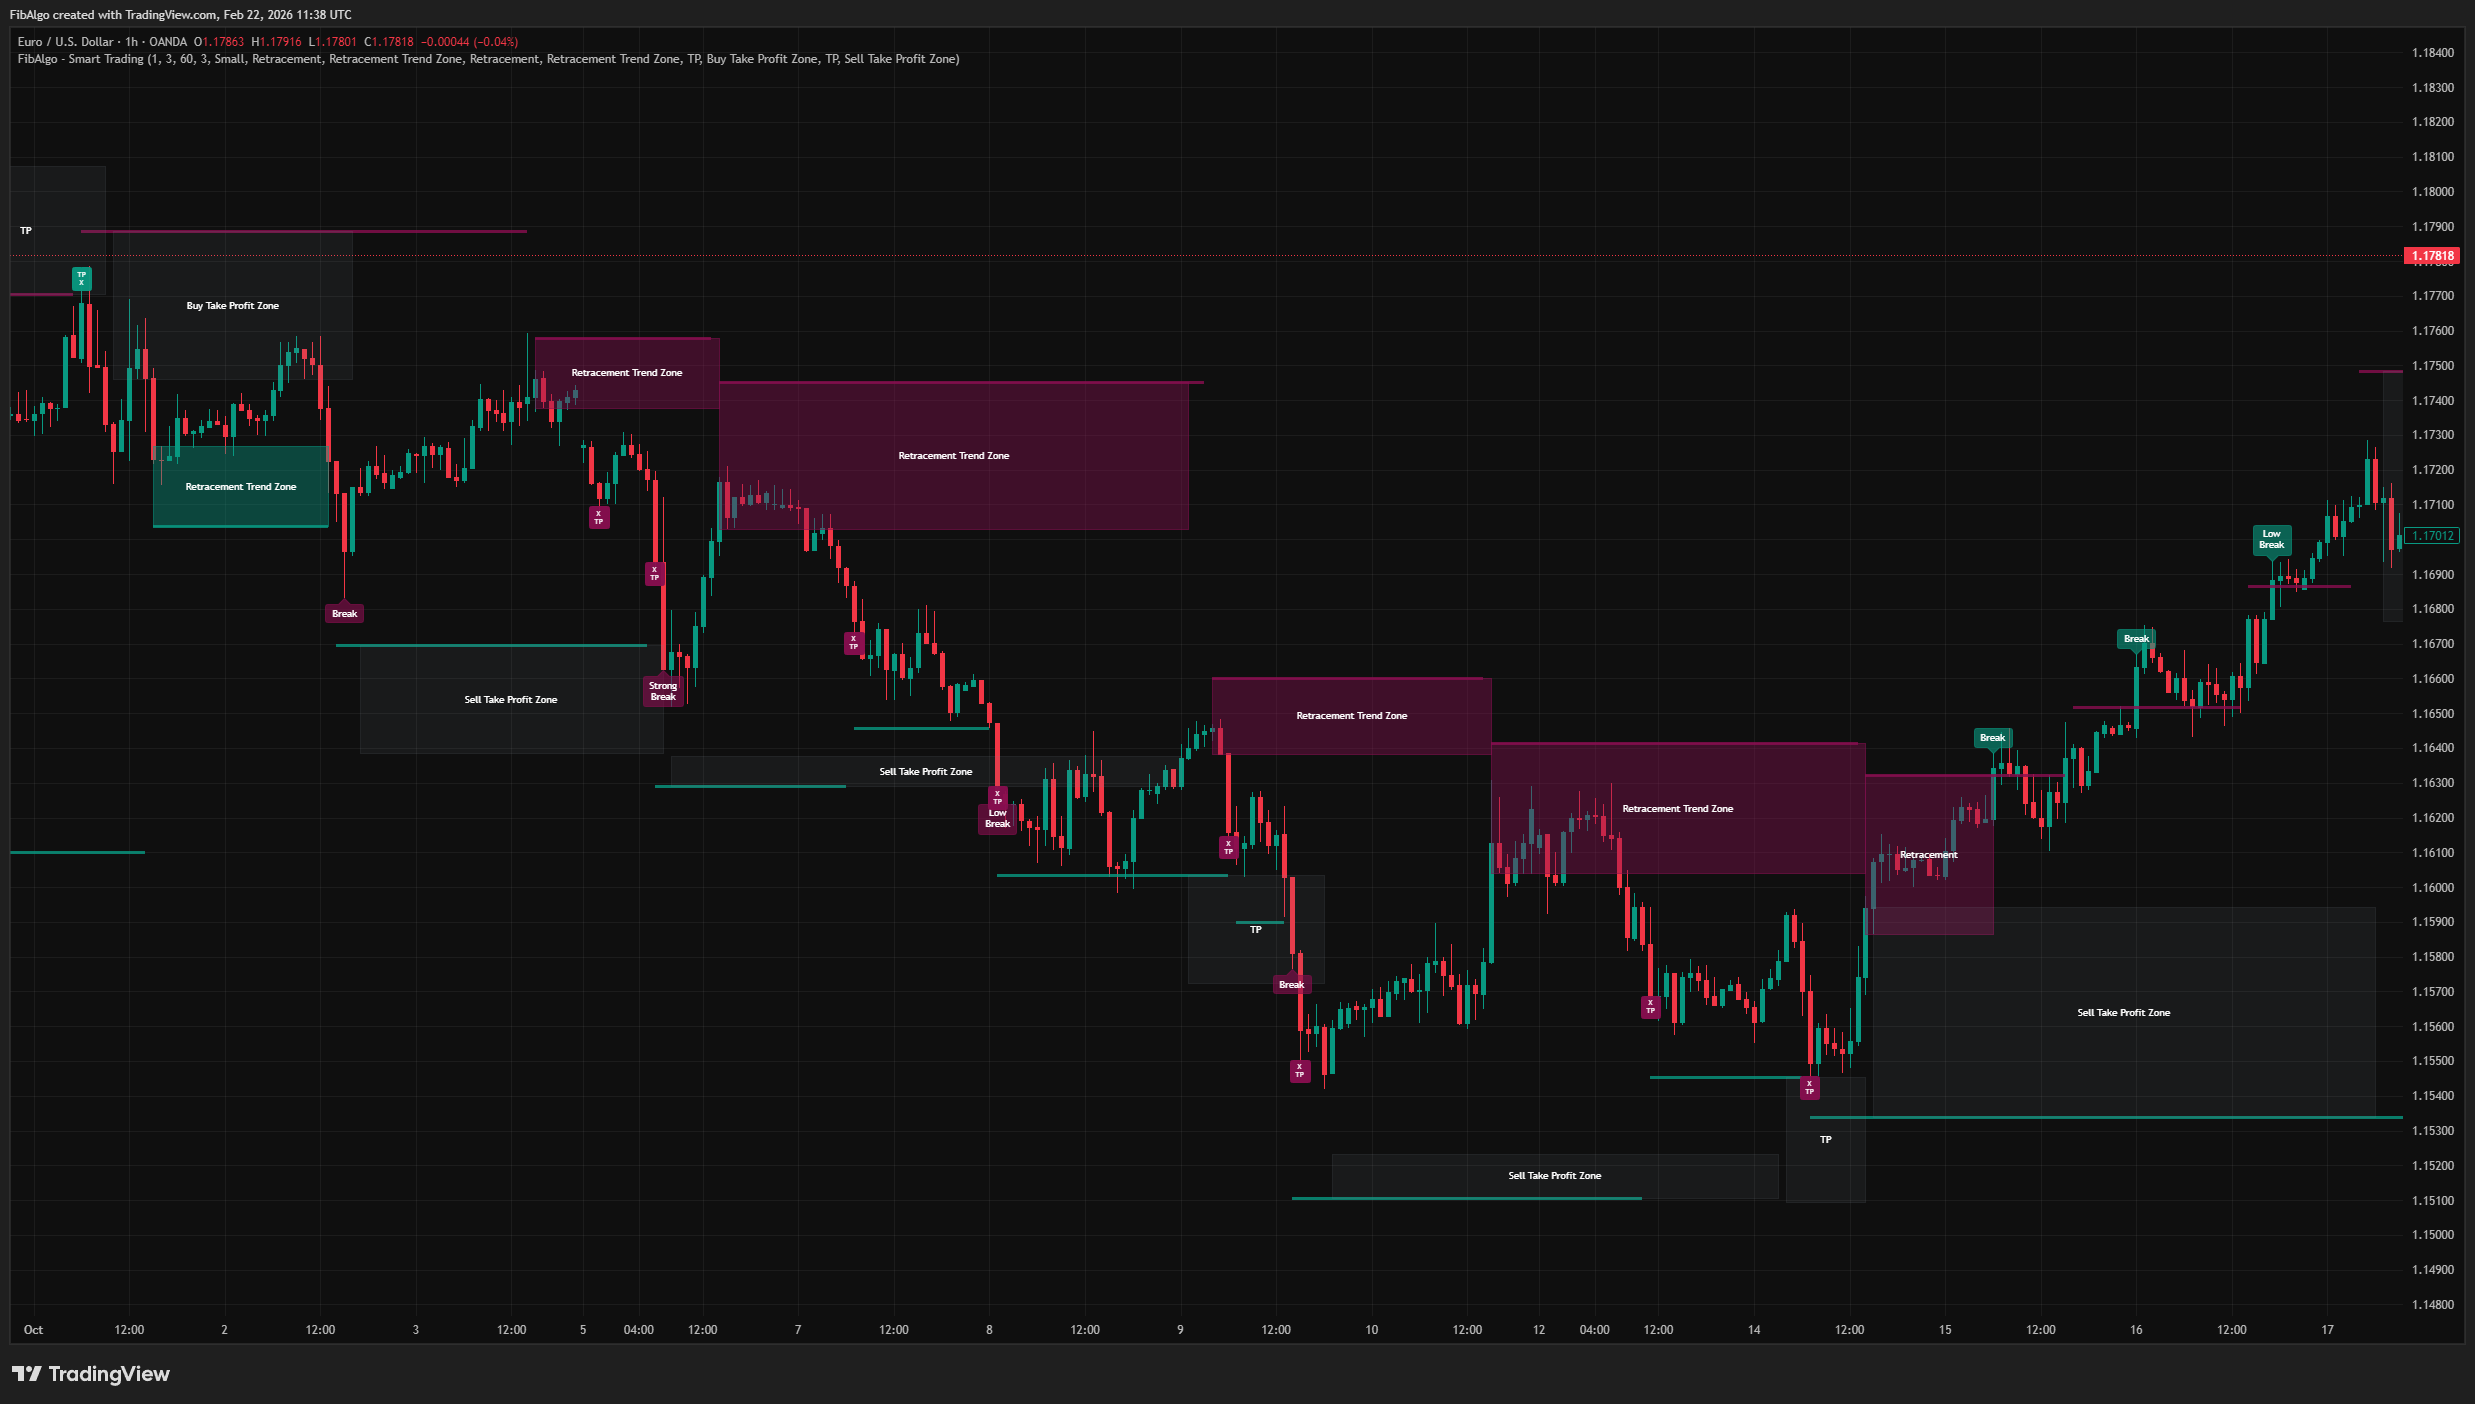
Reading the Chart
- Teal lines = Support levels (below price)
- Maroon lines = Resistance levels (above price)
- Teal labels = Bullish breakout signals
- Maroon labels = Bearish breakout signals
- Colored boxes = Retracement and TP zones
Key Inputs
- Volatility Buffer Sensitivity (0.1 to 2.0): Controls how far S/R lines are offset from swing extremes. Higher values produce wider buffers.
- Trend Volatility Sensitivity (0.5 to 10.0): Controls the Supertrend multiplier. Higher values make the trend slower to reverse.
- HTF Resolution: When HTF filter is enabled, select the higher timeframe for trend alignment.
Suggested Workflow
1. Observe the current trend direction from the Supertrend.
2. Wait for a breakout signal at a S/R line. Prefer "Strong Break" for higher conviction. 3. If the breakout is confirmed and a Retracement Zone appears, consider it as a potential re-entry area in the trend direction. 4. Use the TP zone as a visual guide for areas where momentum may weaken. 5. Enable alerts for your preferred events to stay informed without watching the chart continuously.- This indicator is a technical analysis tool, not a trading system. It does not generate buy/sell orders.
- Breakout classifications are based on historical volatility comparisons. Past volatility patterns do not guarantee future behavior.
- The standard deviation-based volatility buffer is sensitive to sudden regime changes. Parameters may need adjustment across different instruments and timeframes.
- The HTF filter introduces a data dependency via request.security() and inherits the limitations of higher-timeframe data (potential repaint on the latest unconfirmed HTF bar).
- Zone accuracy depends on overall market conditions. Choppy, range-bound markets may produce frequent, short-lived zones.
The trend detection system is based on the Supertrend concept by Olivier Seban. The volatility-adjusted S/R levels, breakout strength classification, retracement zone logic, dynamic TP zone management, and the alert system are original contributions.
Frequently Asked Questions
Unlock exclusive FibAlgo tools
Our best trading indicators plus AI-powered analysis for advanced trading.
Unlock now