Overview
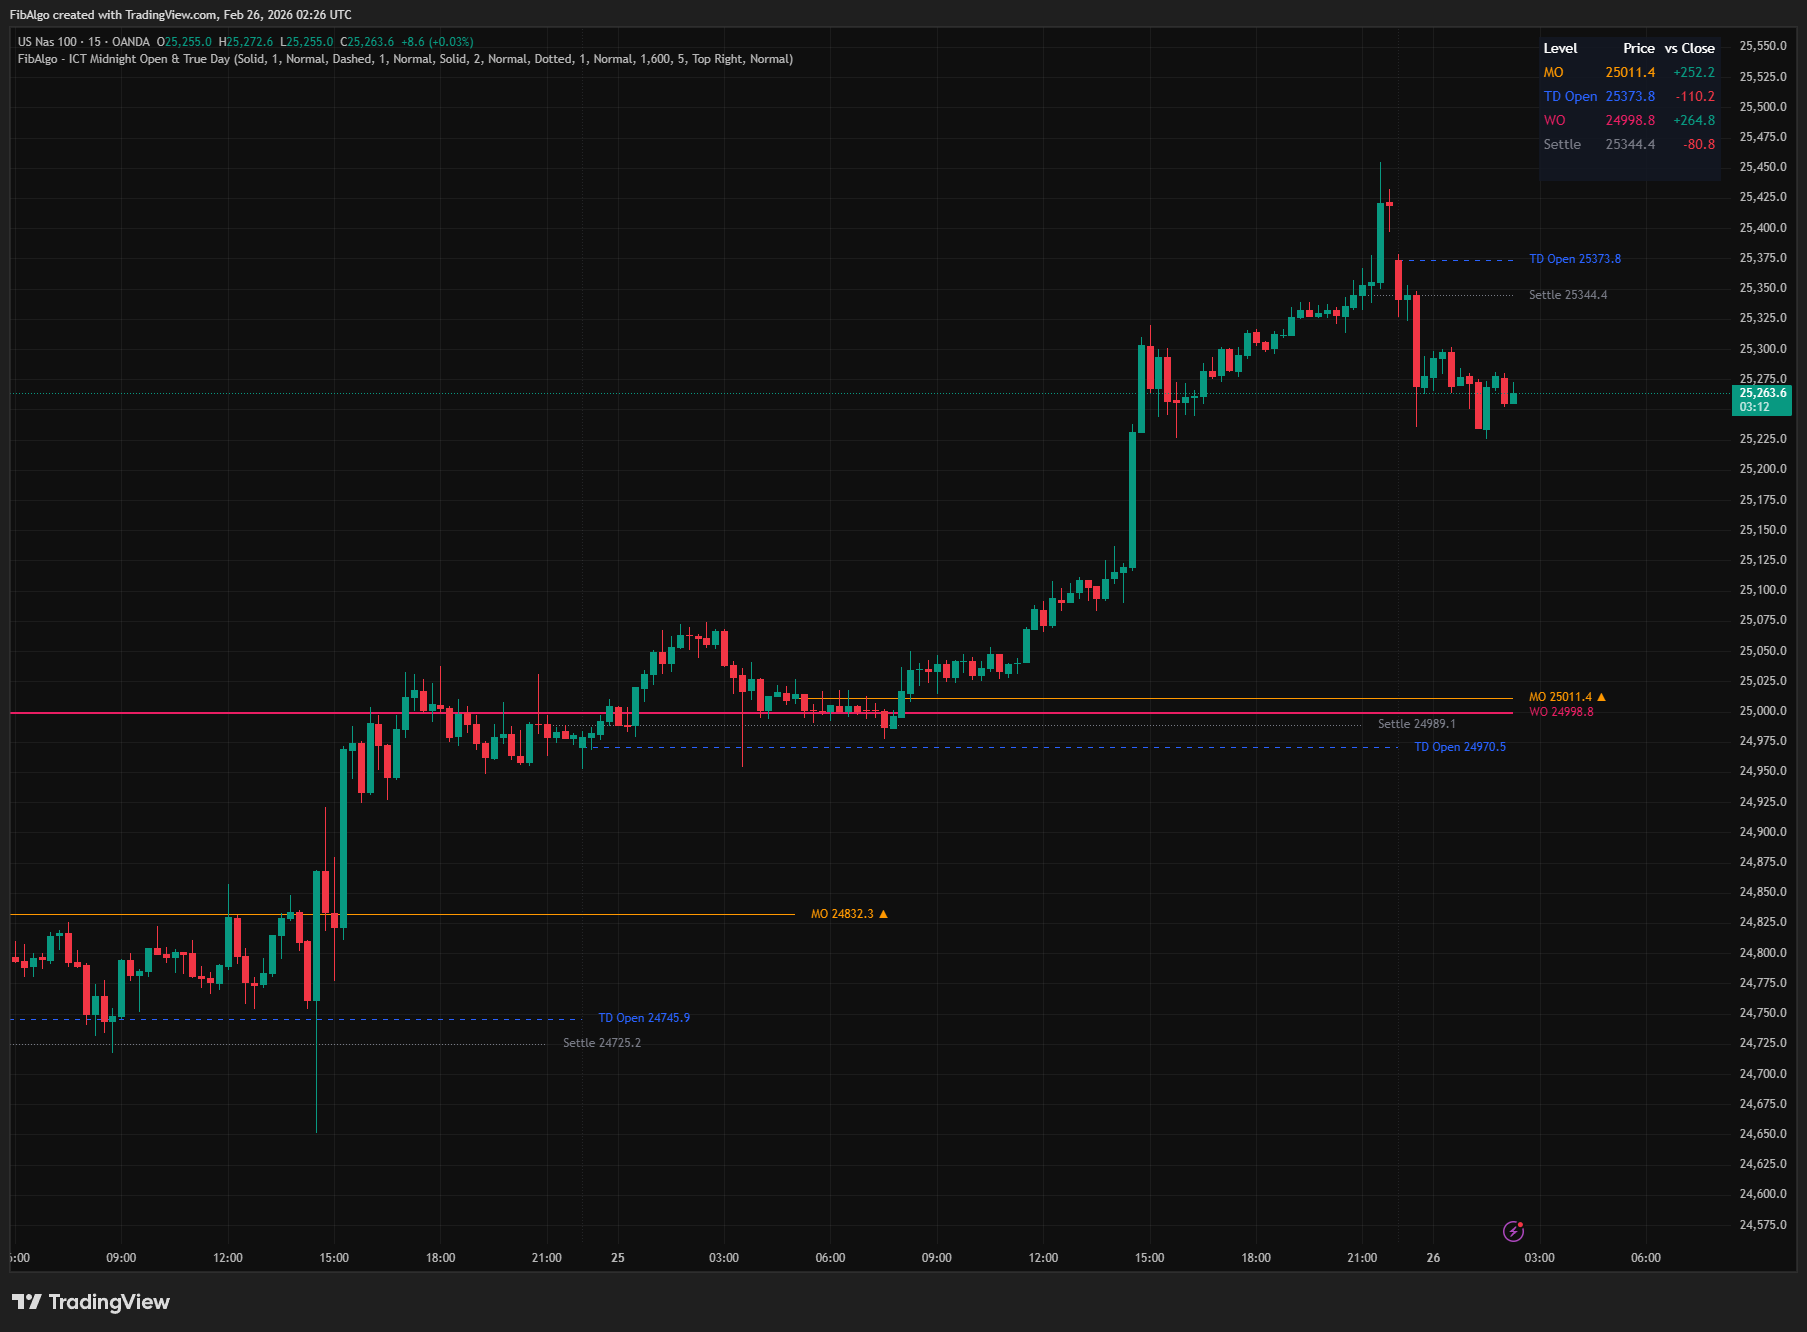
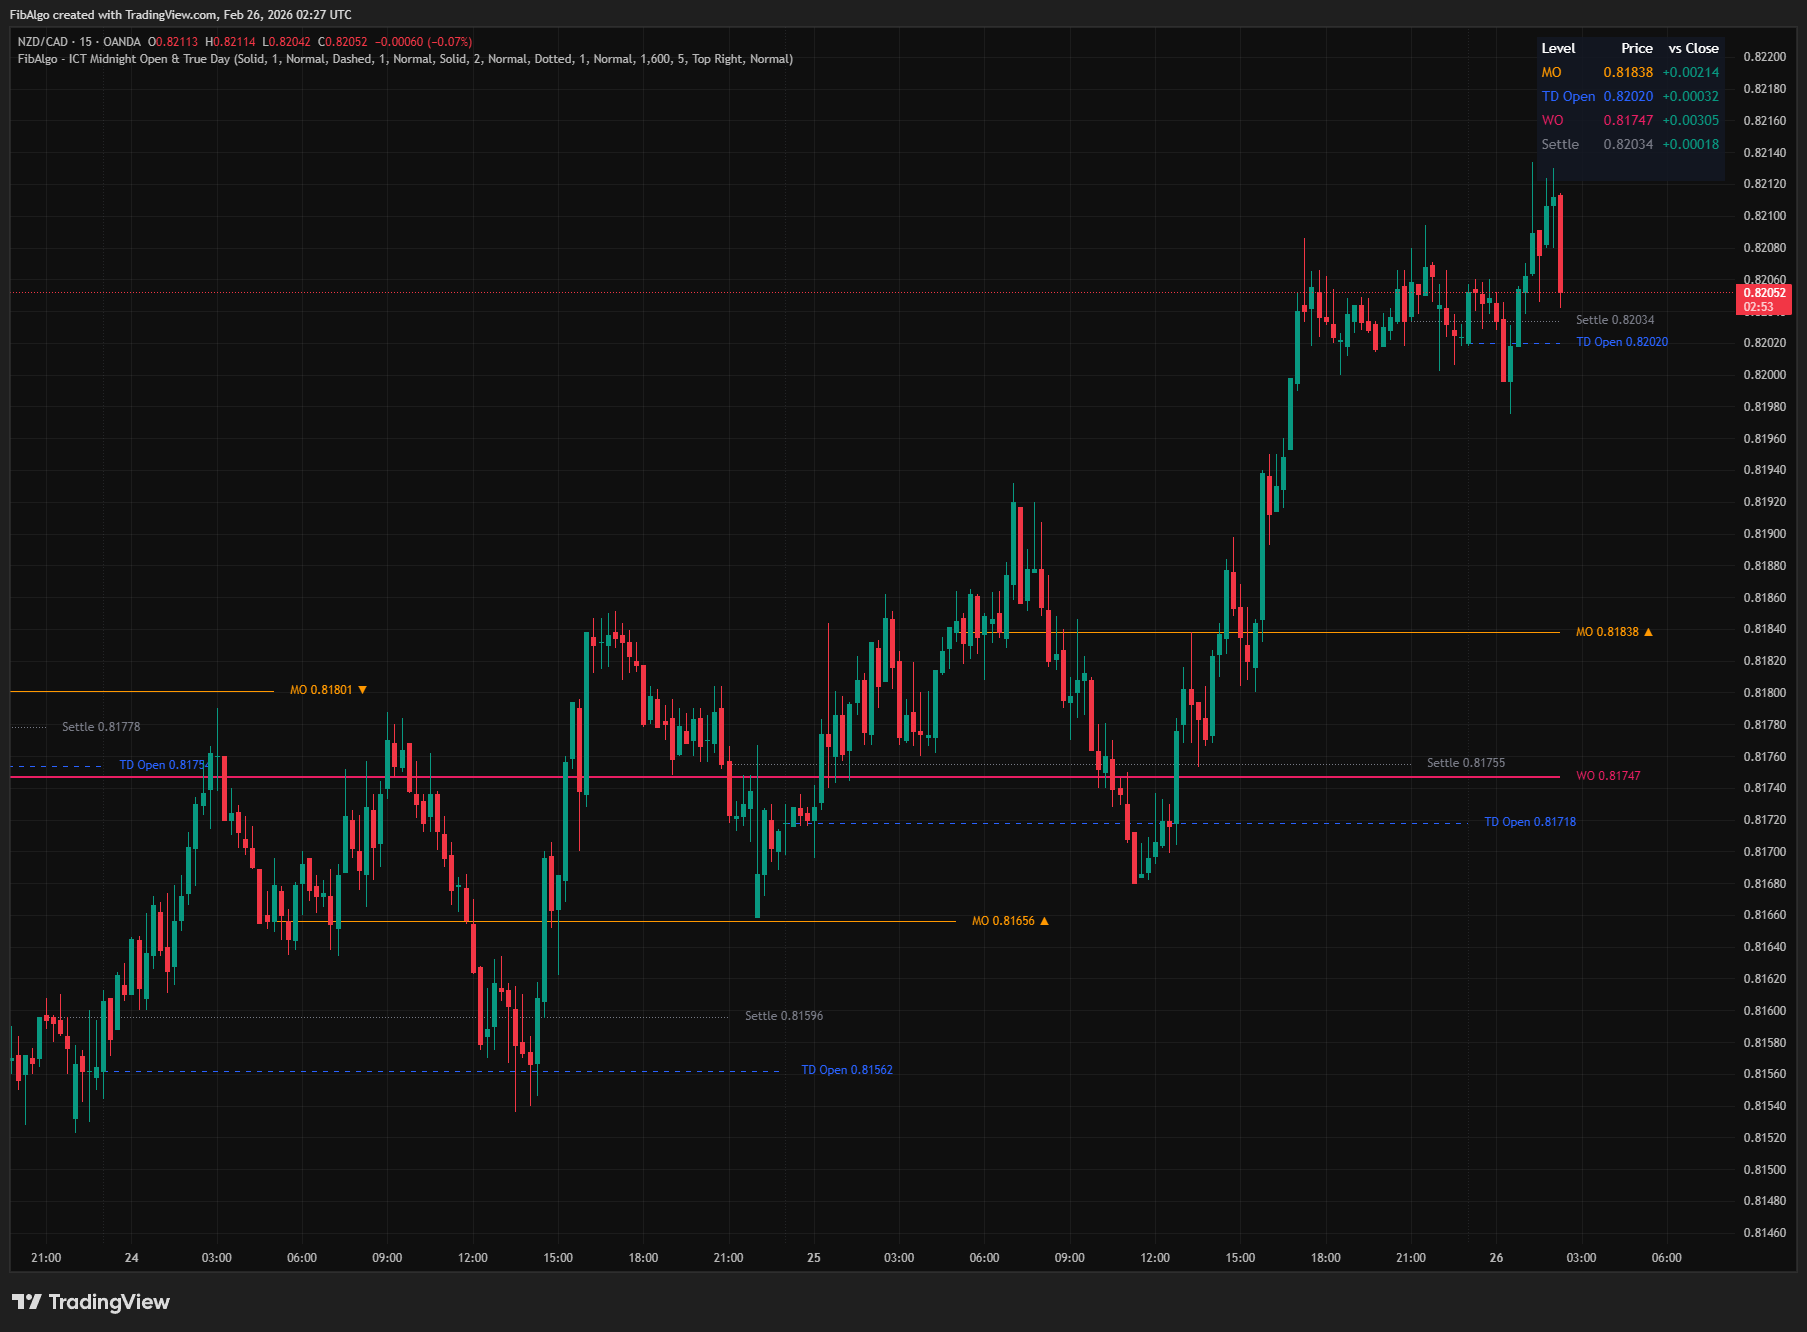
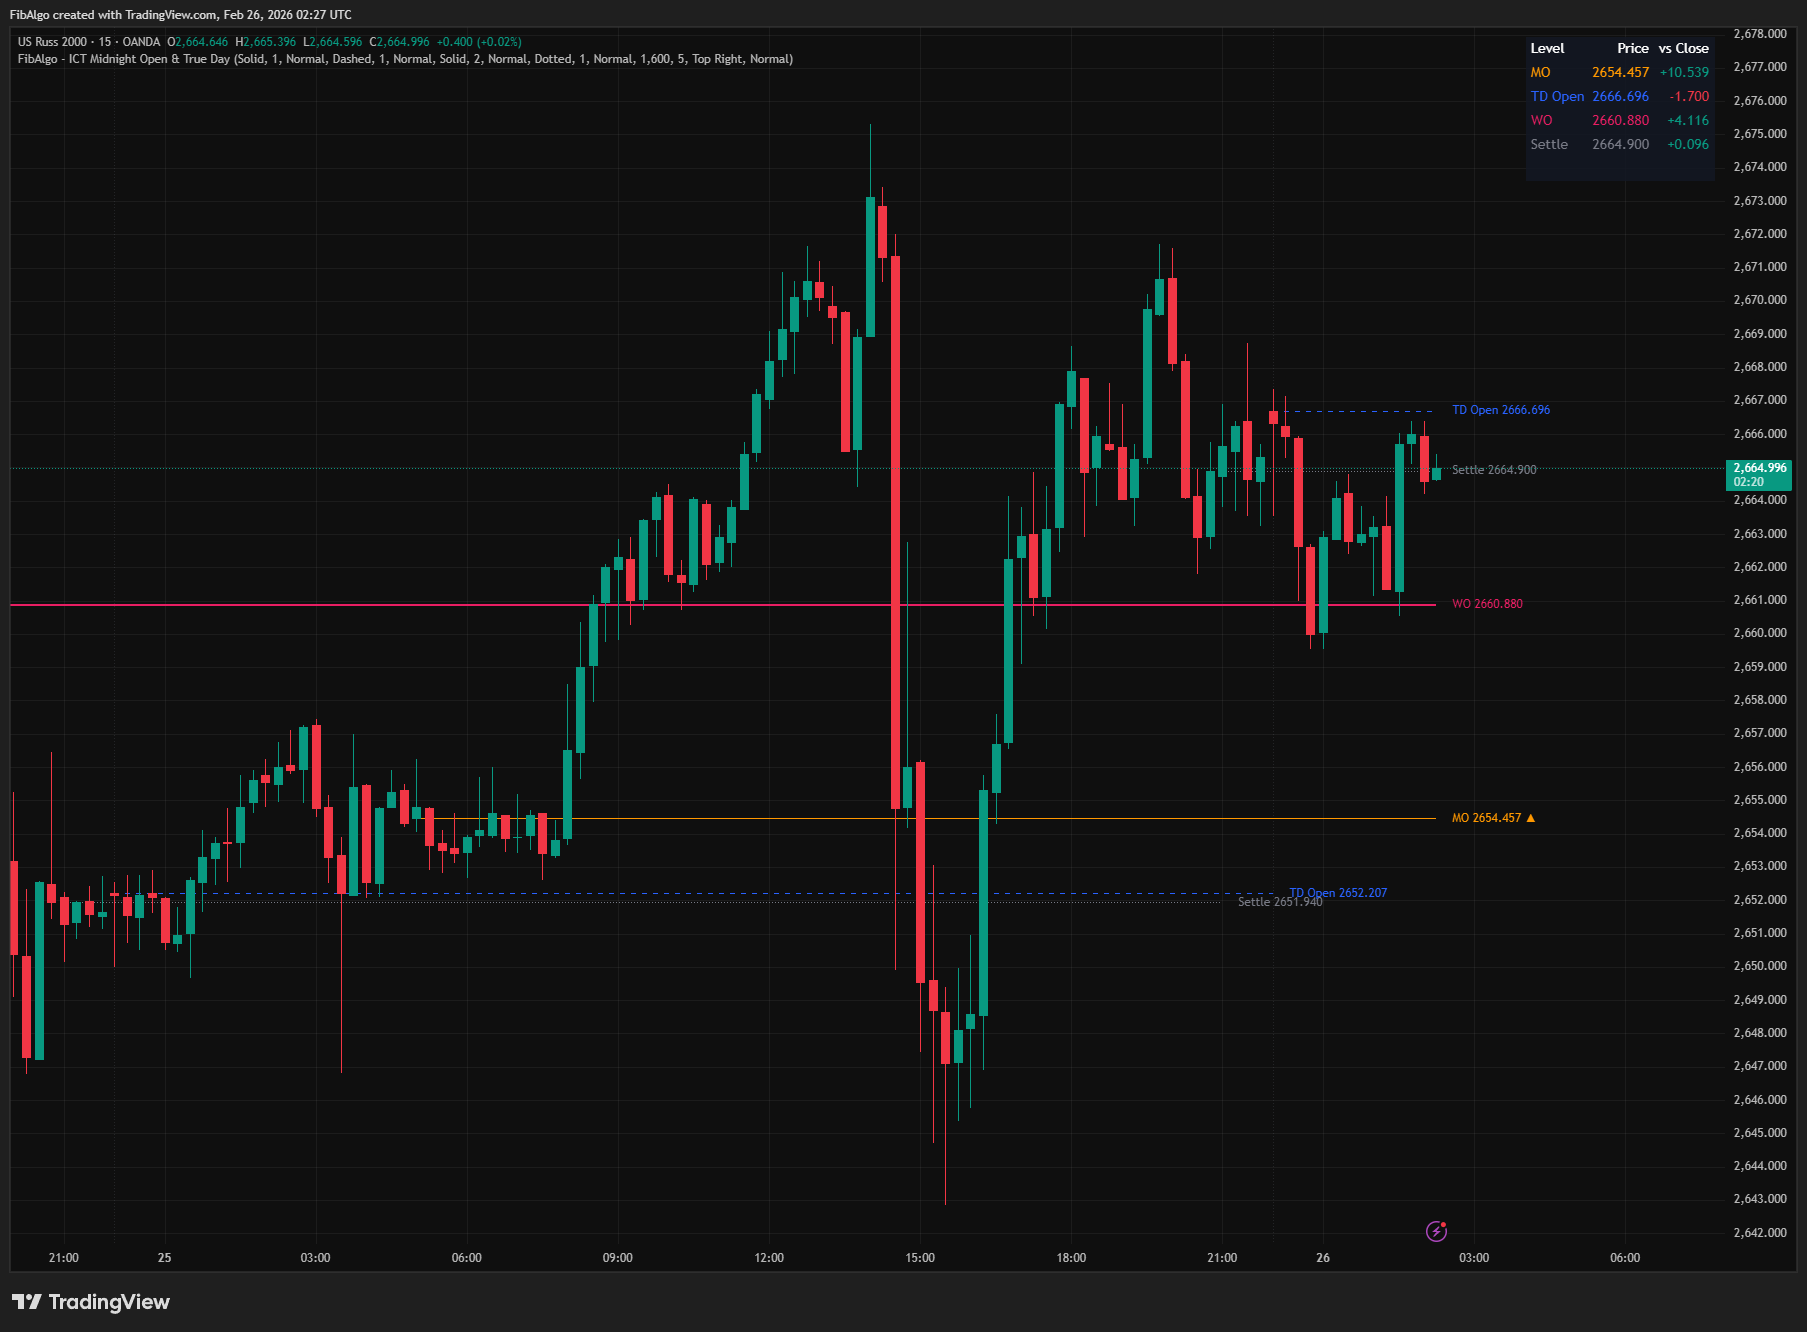
This indicator plots the four key ICT time-based reference levels that institutional traders use to establish daily and weekly directional bias: Midnight Open (MO), True Day Open (TD), Weekly Open (WO), and Settlement Price. Each level is drawn as a horizontal line extending through its relevant session, with automatic detection based on New York timezone calculations. A real-time summary table displays each level's price and distance from the current close, and a directional bias arrow on the Midnight Open label updates every bar.
Key Concepts
- Midnight Open (MO) — The opening price at 00:00 AM New York time. ICT considers this the most important daily bias reference: price trading above the Midnight Open suggests bullish intent for the day; price trading below suggests bearish intent. The MO also acts as an intraday support/resistance level where price frequently reacts.
- True Day Open (TD Open) — The opening price at 6:00 PM ET, when CME futures markets begin the new session. ICT defines this as the "true" start of the trading day — not the conventional 9:30 AM equity open or midnight. The entire 24-hour institutional dealing cycle is measured from this point: open, high, low, and close of the "true day" are referenced to 6 PM ET.
- Weekly Open (WO) — The opening price at Sunday 6:00 PM ET, when weekly futures trading begins. This provides macro directional context for the entire week. If price remains above WO throughout the week, institutional weekly candle bias is bullish. If below, bearish. WO is a key draw-on-liquidity level for weekly setups.
- Settlement / RTH Close — The closing price of Regular Trading Hours (default 4:00 PM ET for US equities and futures). This represents the final institutional consensus at the end of the regular session. The difference between settlement and the next midnight/true-day open signals overnight institutional repositioning.
How It Works
1. Midnight Open Detection The indicator detects when New York time crosses from 23:xx to 00:xx. On that bar, the opening price is captured as the Midnight Open level. A horizontal line is drawn from that bar forward. The previous day's MO line is stopped at the new MO's start bar, keeping the chart clean with non-overlapping historical levels.On intraday timeframes, detection uses the exact NY hour transition. A day-of-week change fallback ensures detection works on higher intraday timeframes (e.g., 2H, 4H) where the bar may not land exactly at midnight. On daily and higher timeframes, the daily candle change is used as a proxy. A deduplication guard (dayofmonth comparison) prevents multiple MO lines from appearing on the same calendar day.
The MO label displays the price and a directional bias indicator that updates every bar: an up arrow when price is above MO (bullish bias) and a down arrow when price is below MO (bearish bias).
2. True Day Open Detection The ICT True Day begins at 6:00 PM ET when CME futures open for the new session. The indicator detects the transition from before 18:00 to 18:00 or later in NY time. Additionally, the Sunday 6 PM session start after the weekend gap is handled separately to ensure correct detection on the first bar of the week.The True Day Open captures the bar's open price at the 18:00 ET transition. On the same day that both MO and TD are active, their lines run in parallel — this is intentional, as they serve different analytical purposes (midnight = calendar day bias, 6 PM = institutional session bias).
True Day detection is only active on intraday timeframes. On daily or higher charts, the concept does not apply (each daily candle already represents one day).
On daily and higher timeframes, a weekly candle change is used as detection. The WO maintains a separate history depth (4 weeks by default), allowing multiple weekly levels to be visible simultaneously.
4. Settlement / RTH Close Detection Settlement is detected when NY time crosses the user-configurable settlement hour (default 16:00 HHMM format). The price used is close[1] — the closing price of the bar immediately before the settlement transition. This represents the last traded price before the official session end, which is the settlement convention.On daily and higher timeframes, the indicator uses the previous bar's close when a new daily candle begins. The settlement time is user-adjustable for instruments with different session schedules (e.g., European markets, commodities).
5. True Day Separators An optional feature draws vertical dotted lines at 6:00 PM ET to visually mark the start of each ICT True Day. These separators help traders see the boundaries between institutional dealing days at a glance. Only available on intraday timeframes. 6. Level Extension and History Each level type maintains an array of historical instances. Only the latest (current) level in each category extends rightward to the current bar — all previous levels are frozen at their endpoint. When a new level is created, the previous level's line is stopped at the new level's start bar. Levels that exceed the configurable history depth are automatically deleted (both line and label) to prevent chart clutter and stay within TradingView's drawing object limits. 7. Summary Table A real-time table displays the most recent level of each active type with three columns: level name (color-coded to match the line), price, and signed distance from the current close. Positive distance (green) indicates price is above the level; negative (red) indicates below. Table position (any corner) and text size (Tiny/Small/Normal) are configurable. Disabled level types are automatically excluded from the table — rows adjust dynamically.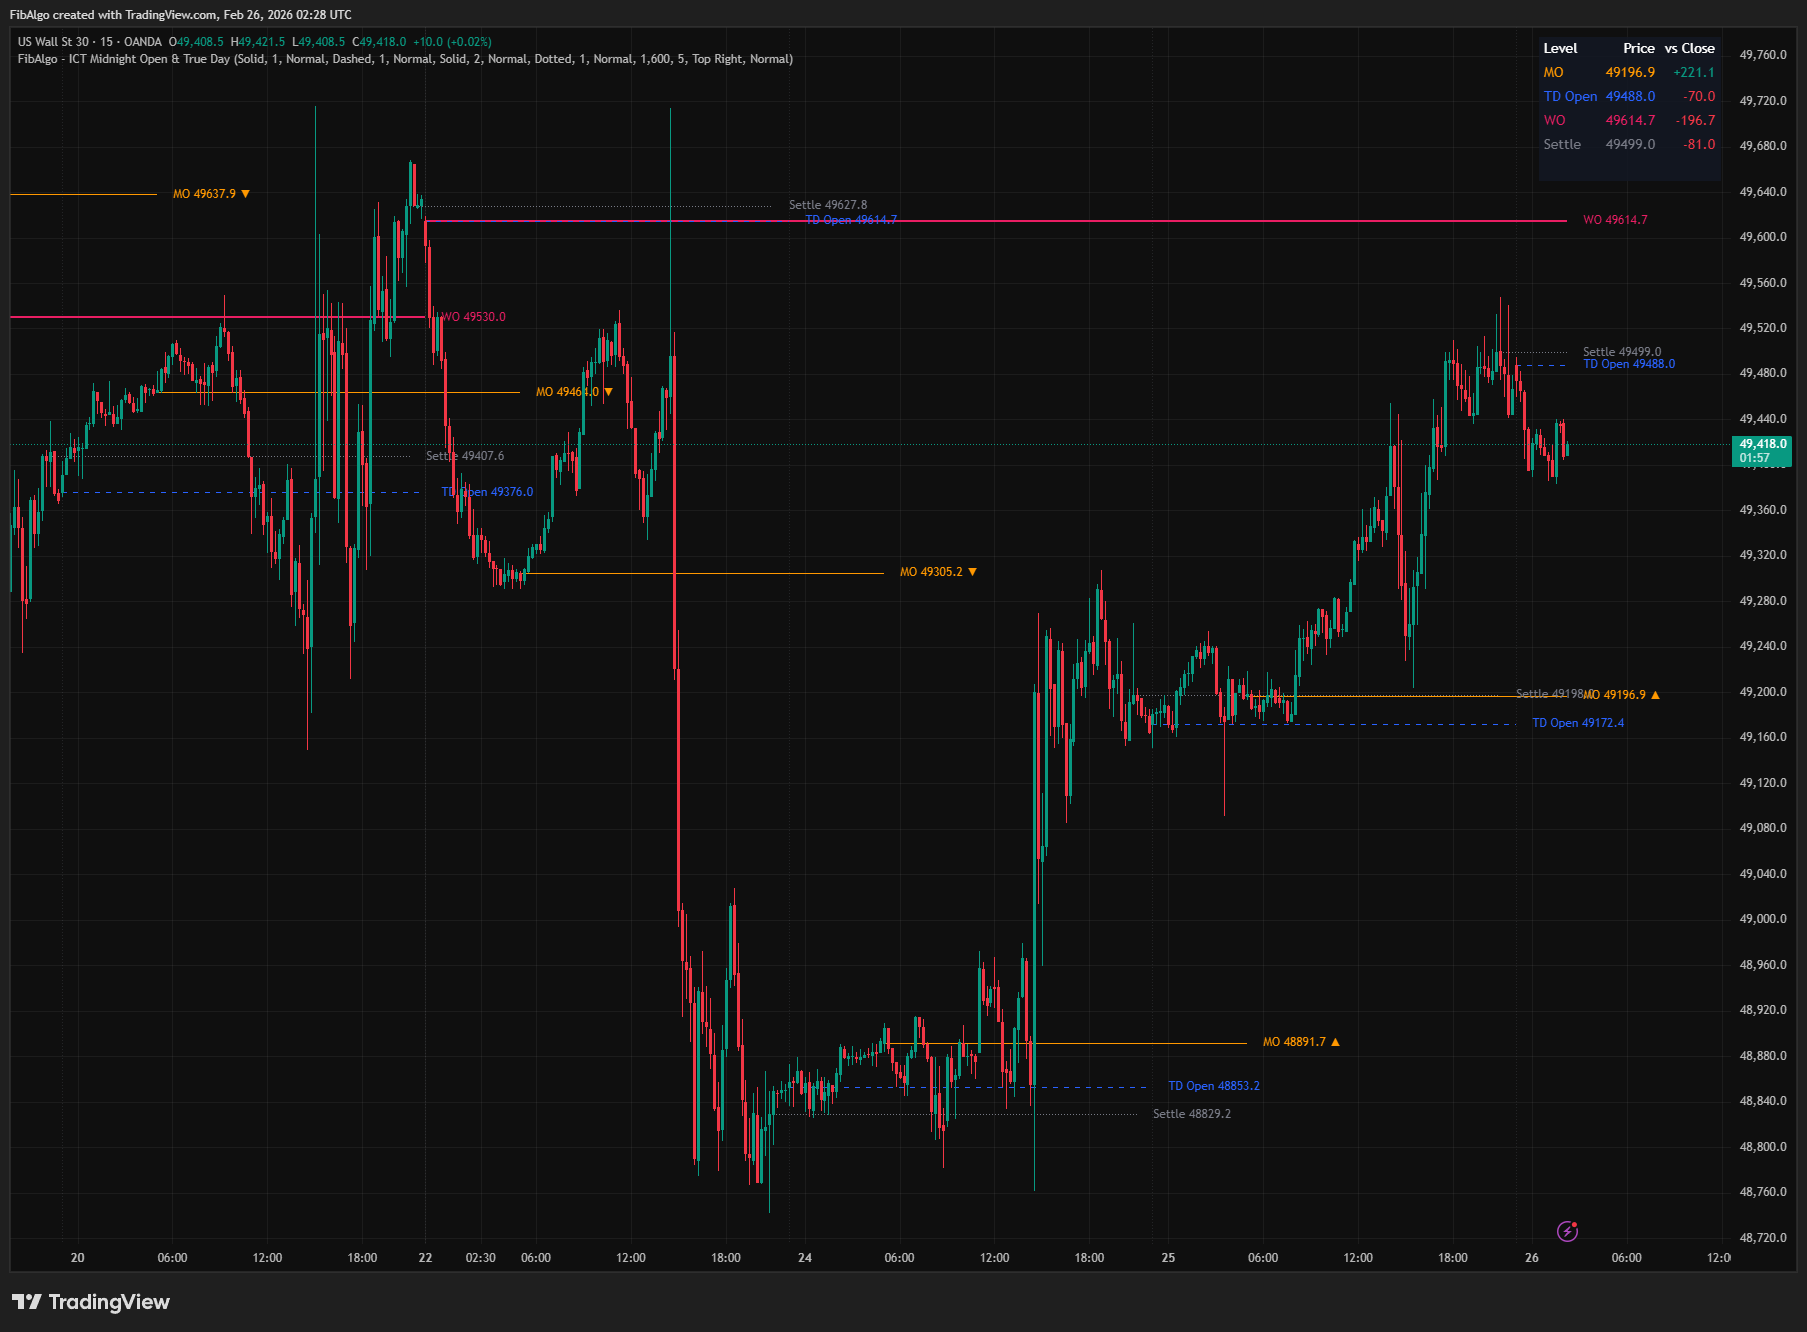
Features
- Midnight Open (MO) — Automatic detection at 00:00 ET on every trading day. Captures the opening price as the primary ICT daily bias level. Works on all intraday timeframes with day-change fallback for daily+ charts.
- True Day Open (TD Open) — Detects the 18:00 ET futures session open, including the Sunday 6 PM start after the weekend gap. ICT's institutional daily reference point.
- Weekly Open (WO) — Captures the first bar of the trading week (Sunday 6 PM ET). Provides macro weekly bias context. Independent history depth (4 weeks).
- Settlement / RTH Close — Records the last traded price before the configurable settlement time (default 16:00 ET). Adjustable for any market's session schedule.
- Directional Bias Indicator — The MO label displays an up/down arrow based on current price relative to the Midnight Open level. Updates every bar for real-time bias tracking.
- True Day Separators — Optional vertical dotted lines at 6:00 PM ET marking institutional day boundaries. Provides visual session framing on intraday charts.
- Independent Styling Per Level — Each of the four levels has its own color, line style (Solid/Dashed/Dotted), line width (1–4), and label size (Tiny/Small/Normal) controls. Full visual independence.
- Configurable History Depth — Show 1 to 30 days of historical levels. Older levels are automatically cleaned up. Previous levels are frozen at their natural endpoint — only the current level extends.
- Real-Time Summary Table — Shows each active level's price and signed distance (+ or -) from the current close. Color-coded: green for positive, red for negative. Configurable position and text size.
- 4 Alert Conditions — Price crosses Midnight Open, True Day Open, Weekly Open, or Settlement. Each alert includes the exact price level, symbol, and timeframe. Master enable toggle plus per-level toggles.
- Timezone-Safe — All time detection uses America/New_York timezone functions. Works correctly regardless of the user's chart timezone setting. Daylight Saving Time adjustments are handled automatically.
- Multi-Timeframe Support — Full detection on intraday timeframes. Daily+ charts use day-change and week-change fallback logic for MO, WO, and Settlement.
How to Use
- Daily Bias with Midnight Open: At the start of each session, note the MO level. If price is above MO, the day has bullish bias — look for long setups. If below, bearish bias — look for shorts. The bias arrow on the label confirms this in real time. This is one of ICT's primary daily directional filters.
- True Day Context: The True Day Open at 6 PM ET sets the institutional opening price for the entire 24-hour session. Compare current price to TD Open for intraday directional bias. When price is above both MO and TD Open, bullish conviction is highest. Below both, bearish conviction is strongest.
- Weekly Framing with WO: The Weekly Open provides macro context. If price remains above WO throughout the week, the weekly candle is building bullish. Below WO all week, bearish. Use WO as the first directional filter before drilling down to daily/intraday levels.
- Overnight Gap Analysis: Compare the Settlement level with the next day's MO and TD Open. A gap between settlement and the new session's opening levels signals overnight institutional repositioning — the direction and size of this gap indicates the urgency of institutional intent.
- Confluence Levels: When multiple levels cluster together (e.g., MO near TD Open near WO), that price zone becomes a high-probability reaction area. Combine with Order Blocks, Fair Value Gaps, or Killzones for precision entries at these confluence zones.
- Combine with ICT Tools: Midnight Open and True Day define WHEN bias is set. Pair with Market Structure (trend direction), Liquidity Levels (sweep targets), Fair Value Gaps (rebalancing), Premium/Discount (range positioning), and Killzones (session timing) for a complete ICT analytical framework.
Limitations
- Midnight Open detection requires intraday timeframes for exact precision. On daily and higher timeframes, the daily candle open is used as a proxy — this may not correspond to exactly 00:00 ET.
- True Day Open detection is only active on intraday timeframes. On daily or higher charts, the concept does not apply since each candle already represents one calendar day.
- Weekly Open detection on intraday charts captures the first bar after the weekend. If your instrument does not have bars on Sunday evening (e.g., equity-only feeds without extended hours), the WO may not appear for that week.
- Settlement time is configurable but defaults to 16:00 ET (US equity/futures). Adjust for your specific market if session hours differ. The settlement price uses the bar's close immediately before the transition — accuracy depends on having bars near the settlement time.
- True Day Separators use extend.both, so the vertical line spans the full visible chart height. On compressed charts, these may appear dense — disable them or increase the timeframe for a cleaner view.
- History depth is shared across MO, TD, and Settlement levels (Weekly Open uses a fixed 4-week depth). Setting high history values on low timeframes may consume drawing objects — TradingView limits lines and labels to 500 each.
- Alert conditions use close-to-close crossover detection (close[1] vs close relative to the level). A wick-only touch without a close crossing does not trigger the alert.
- This indicator displays reference levels for directional bias — it does not generate buy/sell signals. Use it alongside ICT Market Structure, Order Blocks, Fair Value Gaps, Liquidity Levels, and Killzones for a complete trading framework.