Overview
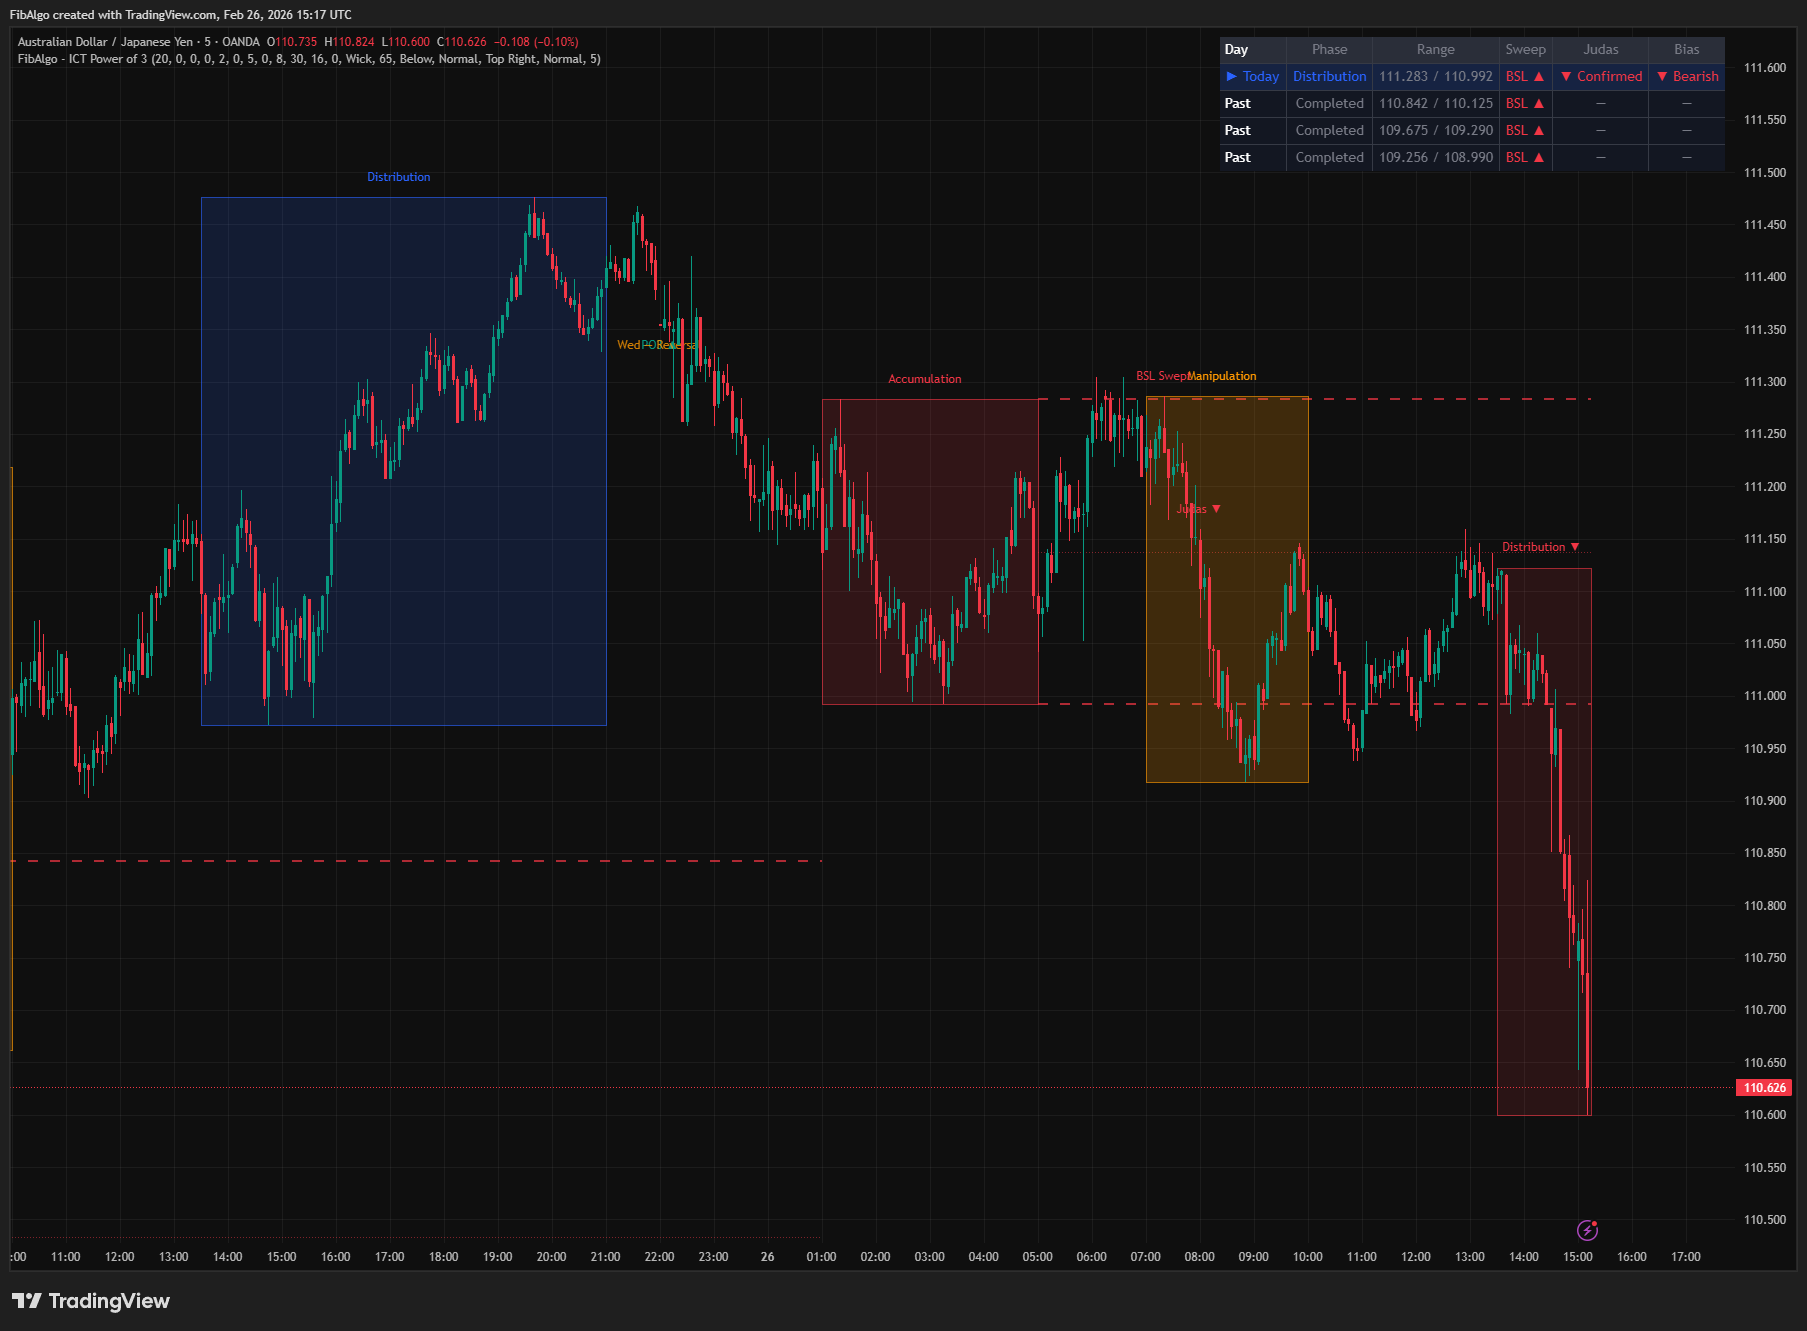
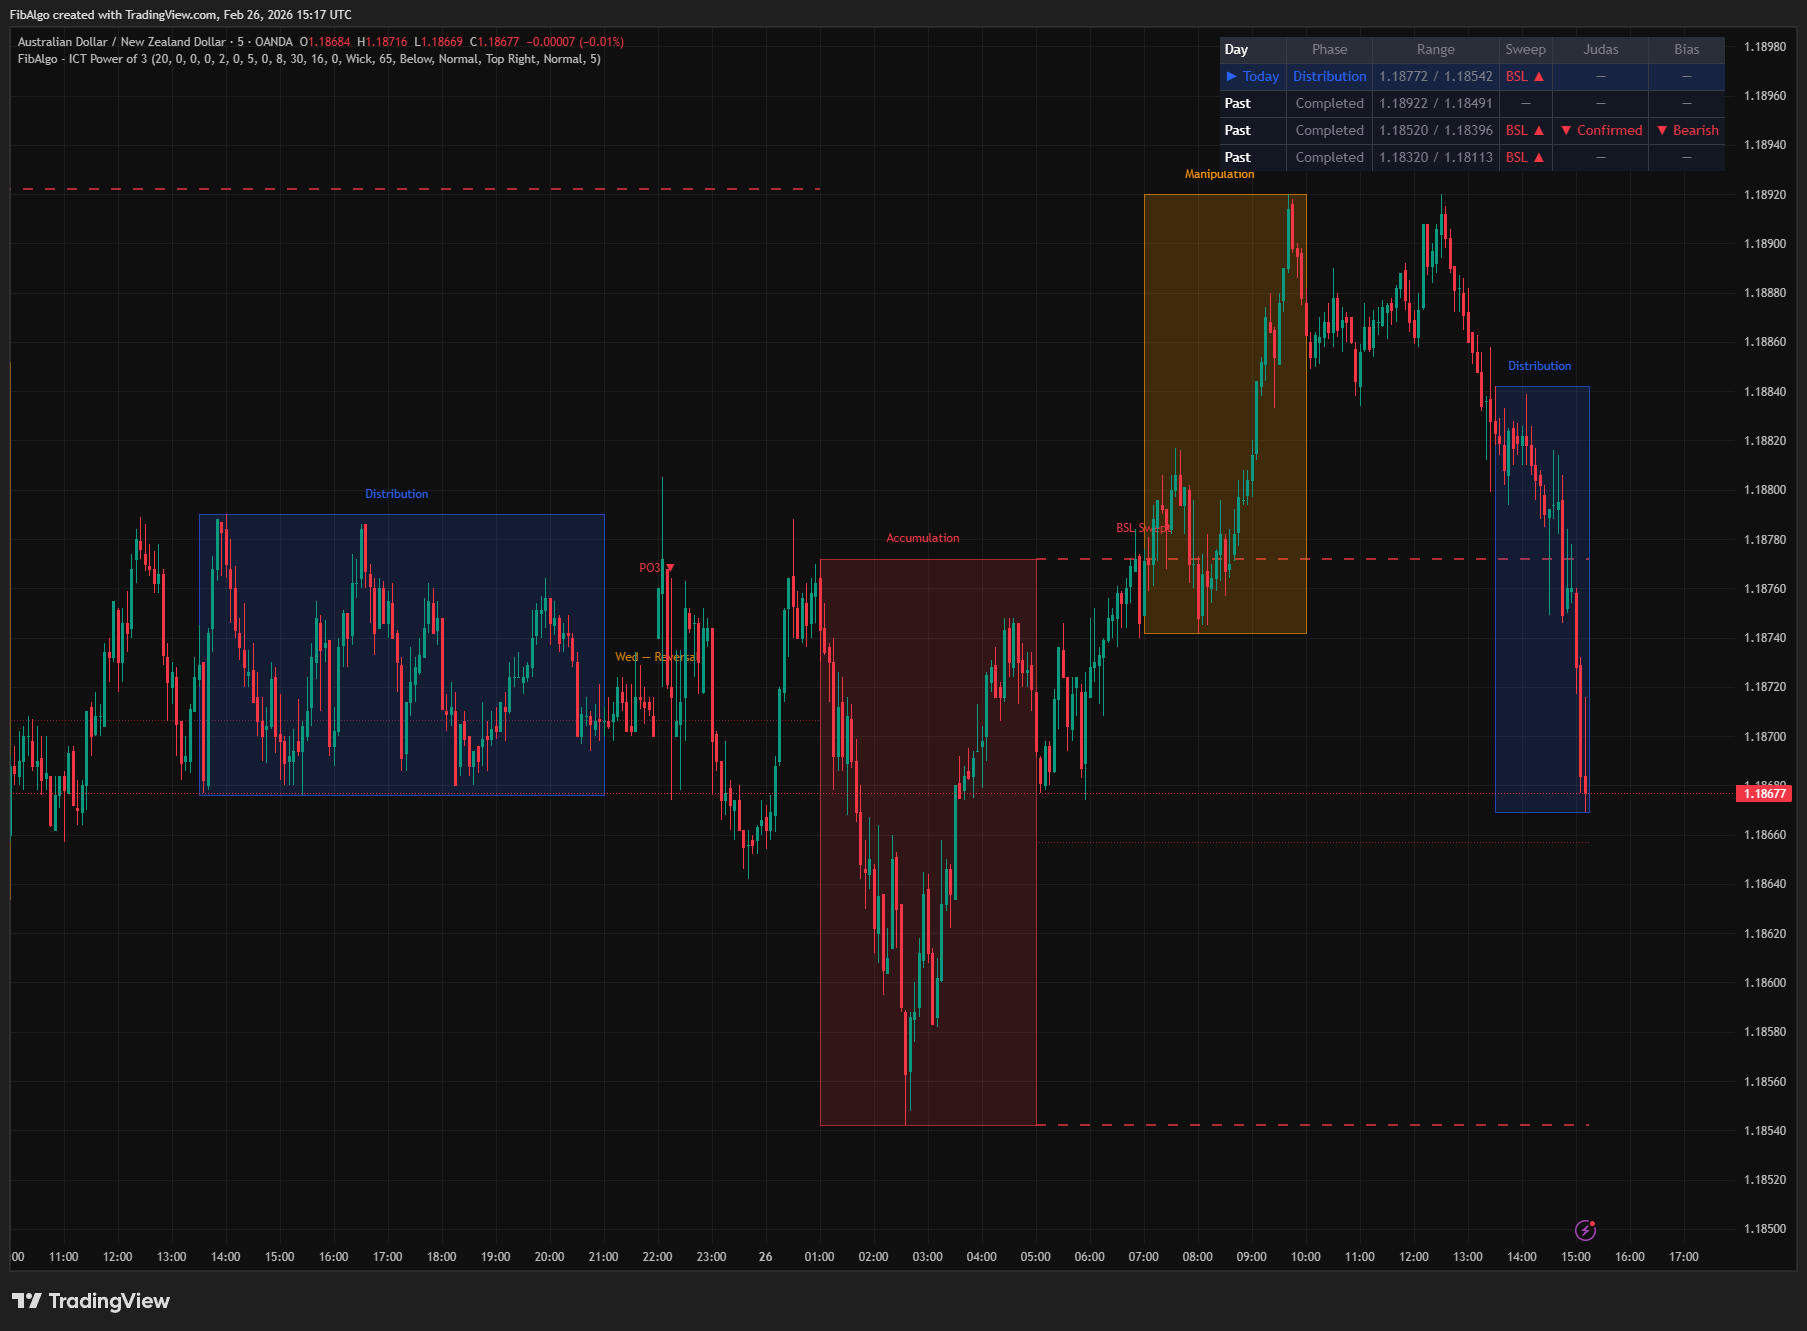
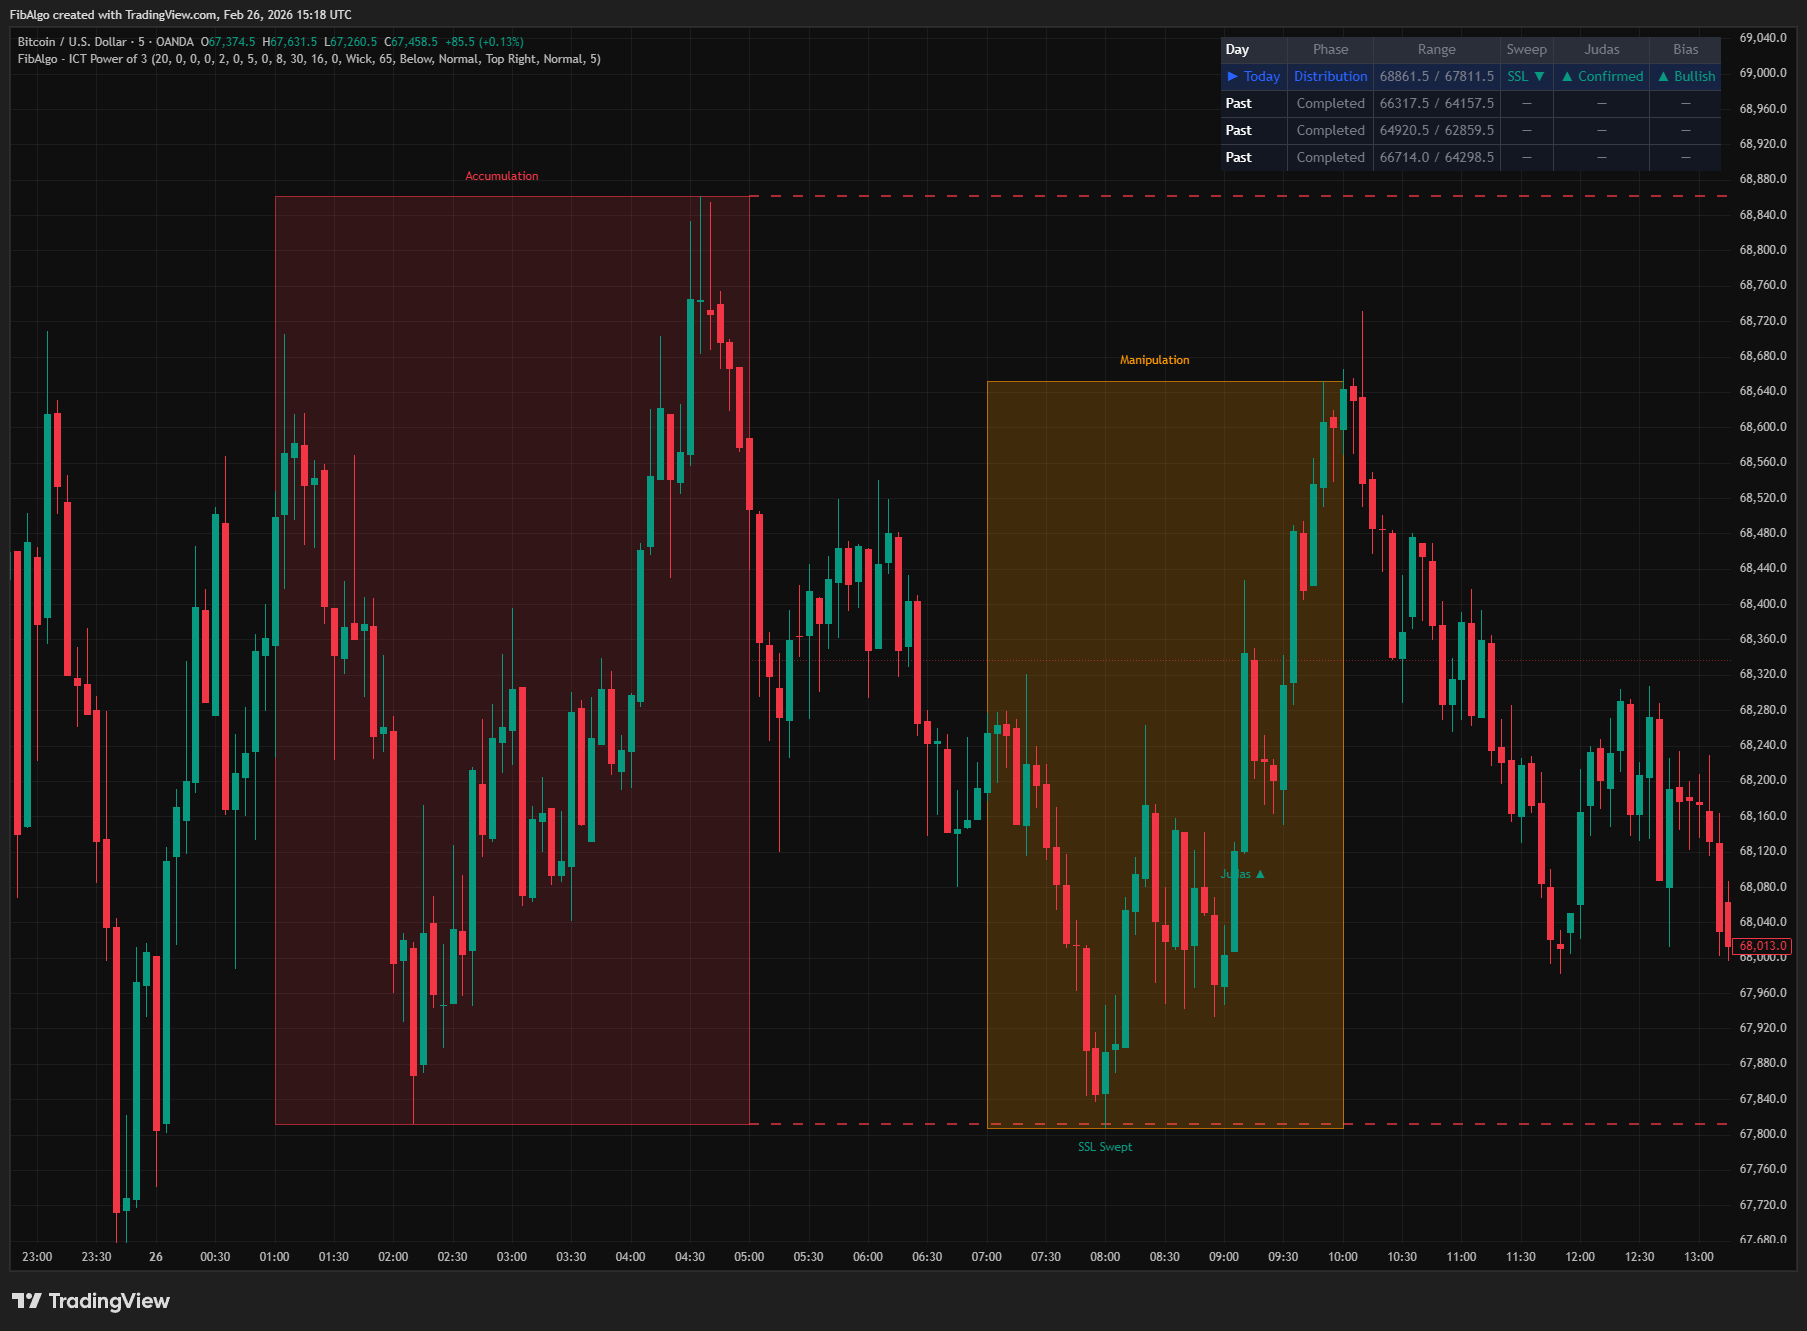
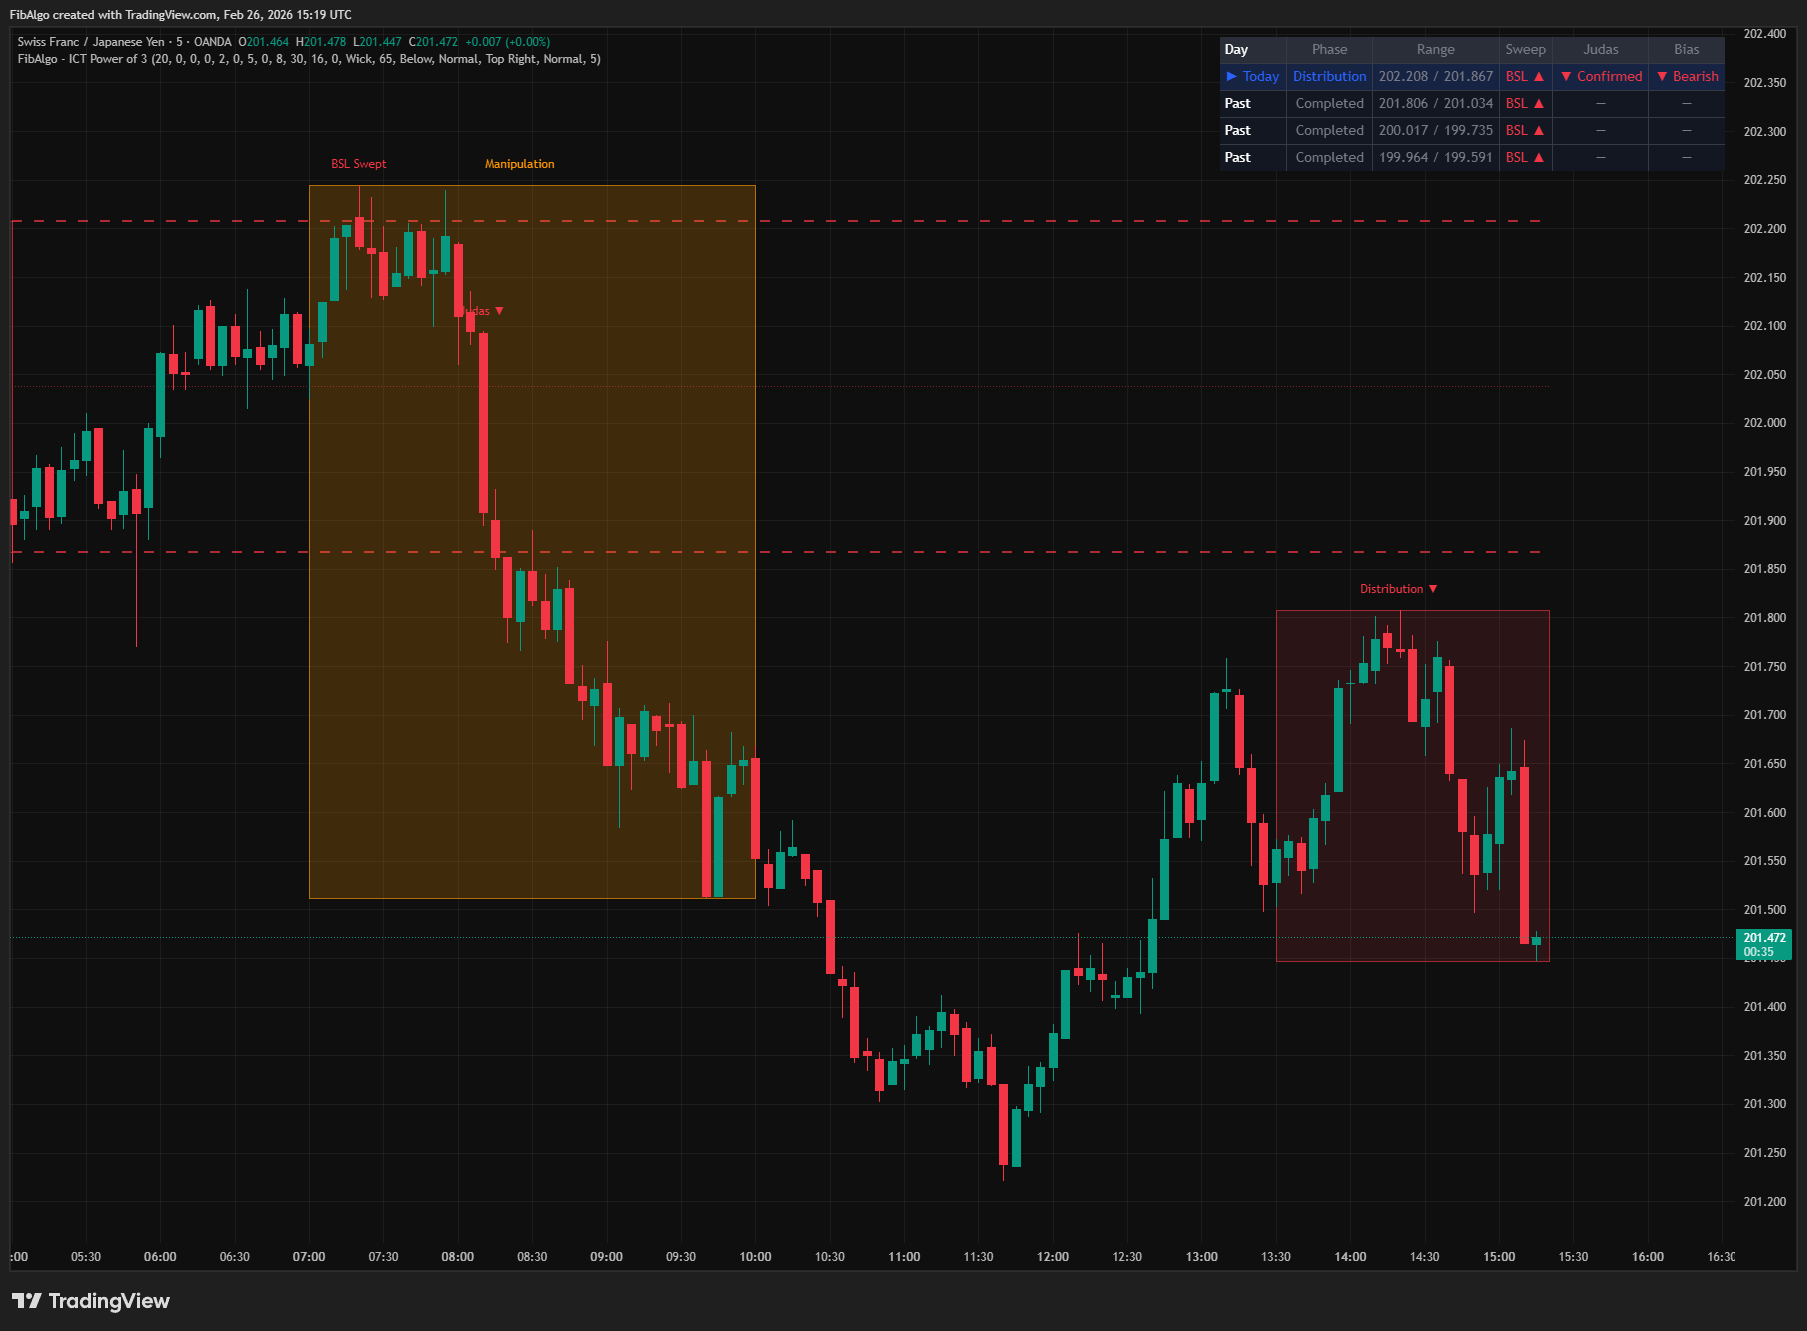
This indicator visualizes the ICT Power of 3 (AMD — Accumulation, Manipulation, Distribution) daily cycle using cross-session analysis. It maps the three institutional price delivery phases across trading sessions: Asia builds the consolidation range (Accumulation), London sweeps that range with a Judas Swing (Manipulation), and New York delivers the true directional move (Distribution). The indicator draws session boxes, tracks accumulation range levels, detects BSL/SSL sweeps with Judas Swing confirmation, scores completed daily candles for PO3 structure, and displays a weekly AMD template overlay.
Key Concepts
- Accumulation (Asia Range) — The consolidation range formed during the Asian session (default 20:00–00:00 ET). This range defines the high and low levels that Smart Money will target for liquidity. The range is tracked dynamically and freezes when the session ends.
- Manipulation (Judas Swing) — During the London Kill Zone (default 02:00–05:00 ET), price sweeps beyond the accumulation range to grab liquidity — either above the high (BSL sweep, bearish signal) or below the low (SSL sweep, bullish signal). This false breakout is the Judas Swing.
- Distribution (True Move) — The New York session (default 08:30–16:00 ET) delivers the real directional move opposite to the manipulation sweep. If BSL was swept, distribution trends bearish. If SSL was swept, distribution trends bullish.
- BSL / SSL Sweep — Buy Side Liquidity (BSL) rests above the accumulation high; Sell Side Liquidity (SSL) rests below the accumulation low. The manipulation phase targets one of these pools. Detection can use wick or close-based methods.
- Daily PO3 Candle — A retrospective scoring system that analyzes completed daily candles. Open position, close position, manipulation wick size, and body ratio produce a 0–100 score indicating how well the OHLC structure matches the PO3 pattern.
- Weekly AMD Template — ICT's weekly framework: Monday = Accumulation, Tuesday = Manipulation, Wednesday = Reversal, Thursday/Friday = Distribution. Day-of-week labels map this template onto your chart.
How It Works
1. Accumulation Phase (Asia Session) When the Asian session opens (default 20:00 ET), a new daily AMD cycle begins. The indicator draws an Accumulation box and tracks the session's high and low in real time. The box expands dynamically as new extremes form. When the session ends (default 00:00 ET), the range is frozen and becomes the reference for the rest of the day. 2. Range Extension Lines Once the accumulation range is set, dashed horizontal lines extend the range high and low forward through London and New York sessions. An optional dotted midpoint (EQ) line marks the equilibrium level — this is the reversal confirmation threshold for the Judas Swing. These lines act as key reference levels for the entire trading day.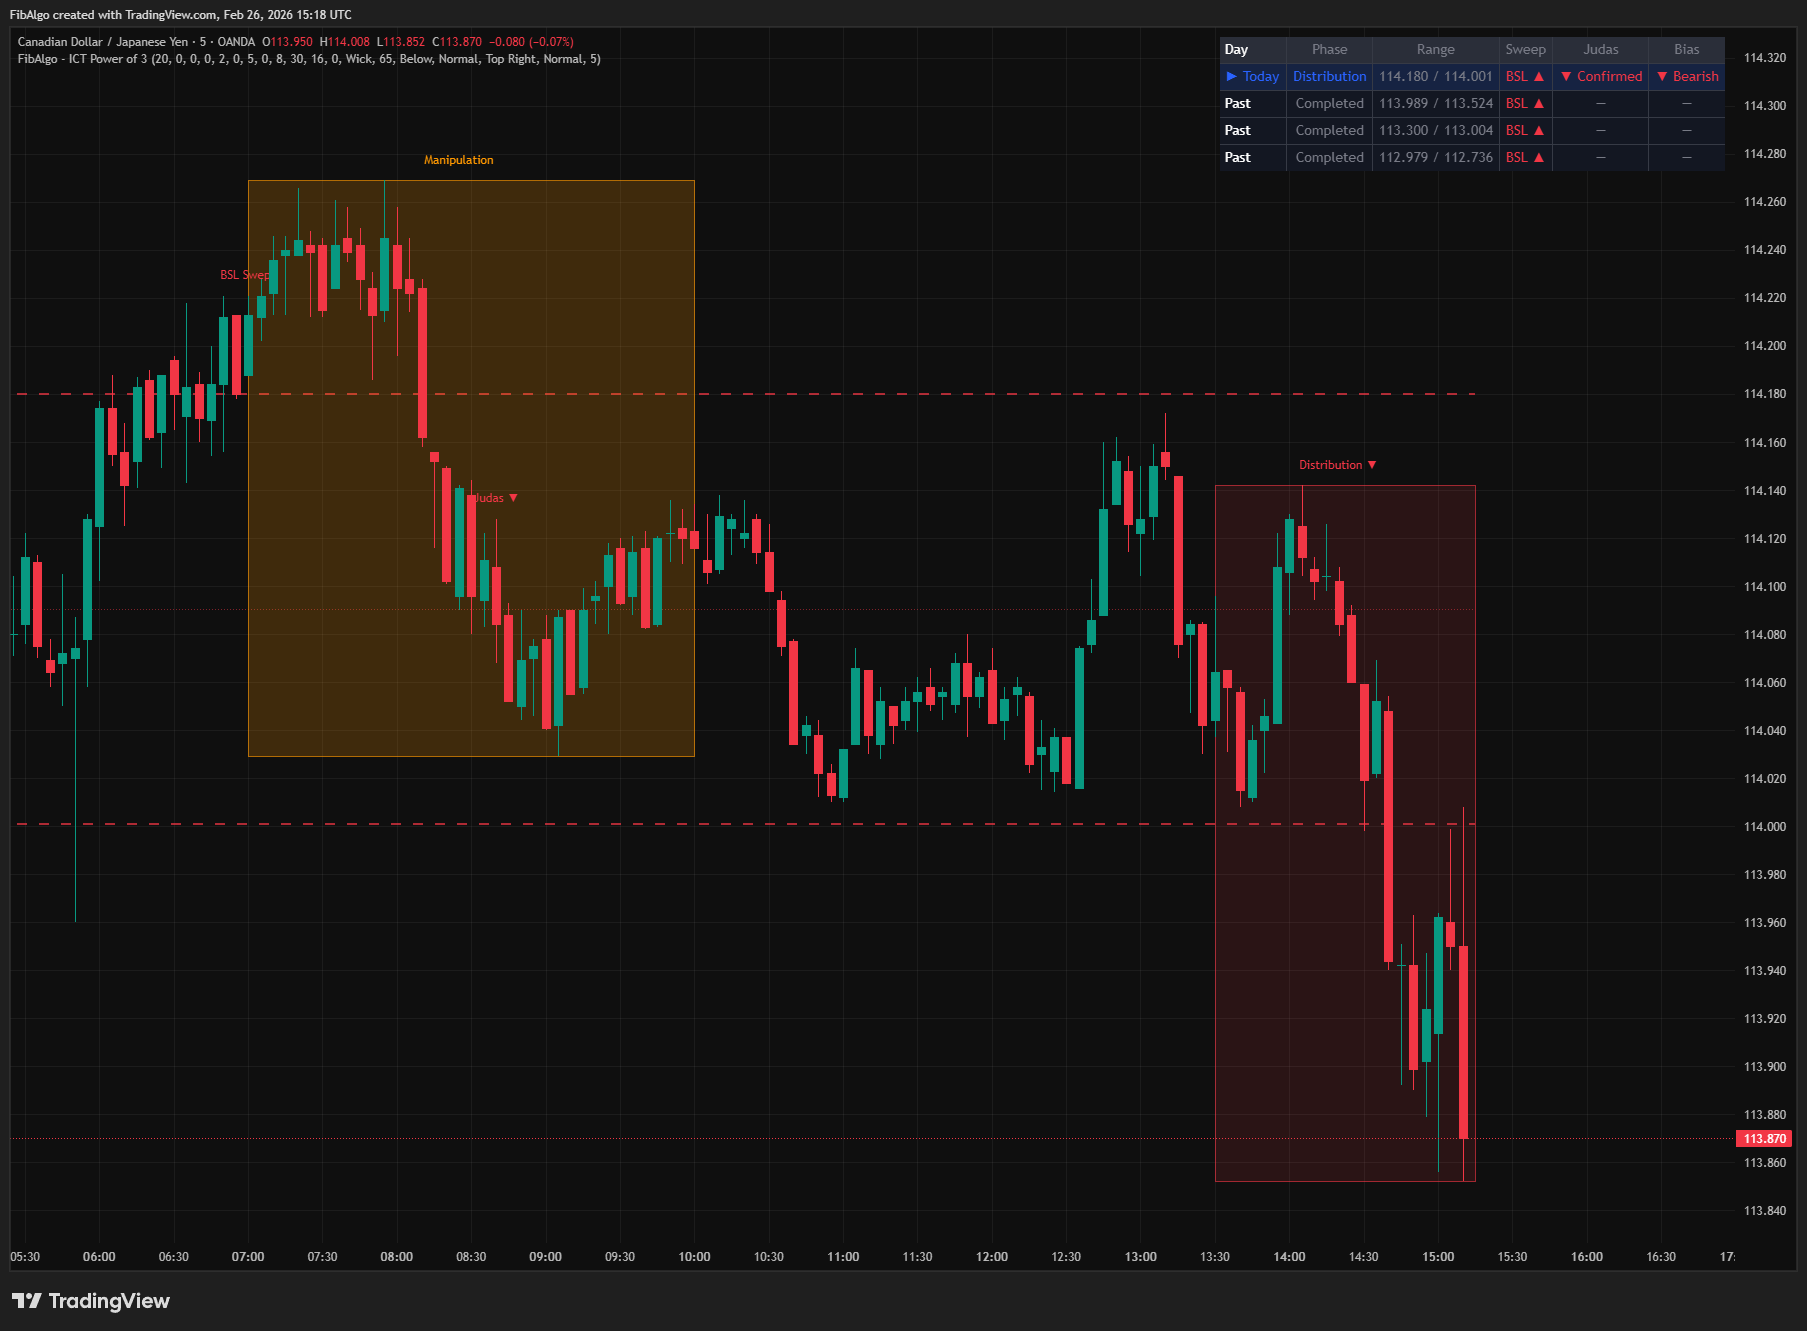
- Wick — High/low wick beyond the range (more sensitive, default).
- Close — Candle must close beyond the range (stricter confirmation).
- Green — Bullish distribution (SSL was swept, Judas confirmed upward).
- Red — Bearish distribution (BSL was swept, Judas confirmed downward).
- Blue — Unconfirmed (no sweep occurred or no Judas confirmation).
Features
- Cross-Session AMD Visualization — Three large session boxes (Asia, London, NY) matching the classic ICT Power of 3 layout. Each box tracks its session's high/low in real time.
- Accumulation Range Extension Lines — Dashed high/low lines and dotted midpoint (EQ) extending from Asia close through London and NY sessions as key reference levels.
- Automatic Sweep Detection — Identifies BSL or SSL sweeps via wick or close method. One-shot detection locks the first sweep direction as daily bias.
- Judas Swing Confirmation — Optional reversal confirmation requiring price to close past the accumulation midpoint. Supports both immediate and delayed (multi-bar) confirmation.
- BSL/SSL Swept Labels — Clear markers at the exact sweep point showing which liquidity pool was targeted.
- Dynamic Distribution Box Coloring — Green for confirmed bullish, red for confirmed bearish, blue for unconfirmed direction.
- Daily PO3 Candle Scoring — 0–100 retrospective analysis of completed daily candles based on open position, close position, manipulation wick, and body ratio.
- Weekly AMD Template Labels — Day-of-week labels mapping ICT's weekly framework: Mon/Tue = Accumulation/Manipulation, Wed = Reversal, Thu/Fri = Distribution.
- Fully Configurable Session Times — Adjust Asia, London, and NY windows to any ET times via hour/minute inputs.
- Summary Table — Shows current phase, accumulation range, sweep status, Judas confirmation, and directional bias for recent daily cycles.
- Multi-Timeframe Compatible — Works best on 1m to 15m charts. All session times are ET-based regardless of chart timezone.
- Alert System — Three configurable alerts: Accumulation Range Swept, Judas Swing Confirmed, Daily PO3 Candle Detected. Each includes symbol and timeframe.
- History Management — Configurable history depth (1–30 days) with automatic cleanup of older cycles.
How to Use
- Identify the Daily Range: Apply to a 5m or 15m chart. Watch the Accumulation box form during Asia — this is your reference range for the entire day.
- Monitor for Sweeps: When London opens, watch for price to break above the accumulation high (BSL) or below the accumulation low (SSL). The sweep label tells you which liquidity pool was targeted.
- Confirm the Judas Swing: After the sweep, wait for the Judas confirmation arrow. Once confirmed, the daily bias is set — expect distribution in the opposite direction during NY.
- Trade the Distribution: Use the Distribution box's directional coloring as a visual bias filter. Green = expect bullish continuation, Red = expect bearish continuation.
- Use Range Lines as S/R: The accumulation high/low extension lines act as key support/resistance levels throughout the day. The midpoint (EQ) line is the equilibrium level.
- Check Daily PO3 Candles: PO3 labels on previous days show which daily candles exhibited clean AMD structure — useful for understanding recurring patterns.
- Weekly Context: Use the weekly template labels to understand where the current day sits within the weekly AMD cycle.
- Combine with ICT Tools: Pair with Order Blocks (WHERE price reacts), Fair Value Gaps (WHERE price rebalances), Liquidity Levels (WHERE stops rest), and Market Structure (WHICH direction) for complete ICT analysis.
Limitations
- This indicator is a visualization tool — it does not generate buy/sell signals. Use it for structural understanding and confluence with other ICT tools.
- Works best on intraday timeframes (1m–15m). On 1H+ charts, session boxes may appear compressed and less informative.
- Session times are fixed in Eastern Time (ET / America/New_York). They automatically adjust for US Daylight Saving Time. If you trade instruments in other timezone conventions, adjust the time windows accordingly.
- The daily PO3 candle score is retrospective — it labels yesterday's completed candle, not the current one.
- Not every day produces a clean AMD cycle. If London does not sweep the accumulation range, the daily cycle remains unconfirmed (blue Distribution box, no bias in the summary table).
- Sweep detection is one-shot per day: the first confirmed sweep direction sets the bias. If both BSL and SSL are swept in the same London session, only the first detection counts.
- The weekly template (Mon=Accum, Tue=Manip, Wed=Rev, Thu/Fri=Dist) is a general ICT guideline, not a guaranteed pattern. Market conditions vary.
- On weekends and holidays, no new AMD cycles will form.
- Asset-specific behavior may vary — forex, indices, and crypto may show different AMD session characteristics.
Tags
#Sessions & Time#Smart Money#Price Action