Overview
This indicator automatically detects the ICT Unicorn Model — one of the highest-conviction setups in the Inner Circle Trader methodology. The Unicorn Model occurs when a Breaker Block and a Fair Value Gap (FVG) overlap in the same price zone, creating an exceptionally strong area of institutional interest. The indicator identifies Order Blocks, converts them to Breaker Blocks when broken, detects Fair Value Gaps, and highlights the exact overlap zone where both structures converge.
Key Concepts
- Unicorn Model — A specific ICT setup where a Breaker Block overlaps with a Fair Value Gap, creating a very high-probability entry zone. Named for its rarity and reliability.
- Breaker Block — An Order Block that has been "broken" — price traded through it — and now acts as a zone on the opposite side. A bullish OB that fails becomes a bearish Breaker, and vice versa. The key distinction from a Mitigation Block is that a Breaker involves a structural break (price closing beyond the zone).
- Fair Value Gap (FVG) — A three-candle pattern where the middle candle creates an imbalance, leaving a gap between the first candle's high/low and the third candle's low/high. Represents institutional urgency and undelivered price.
- Overlap Zone — The exact price area where the Breaker Block and FVG intersect. This is the core of the Unicorn Model and the zone where price is most likely to react.
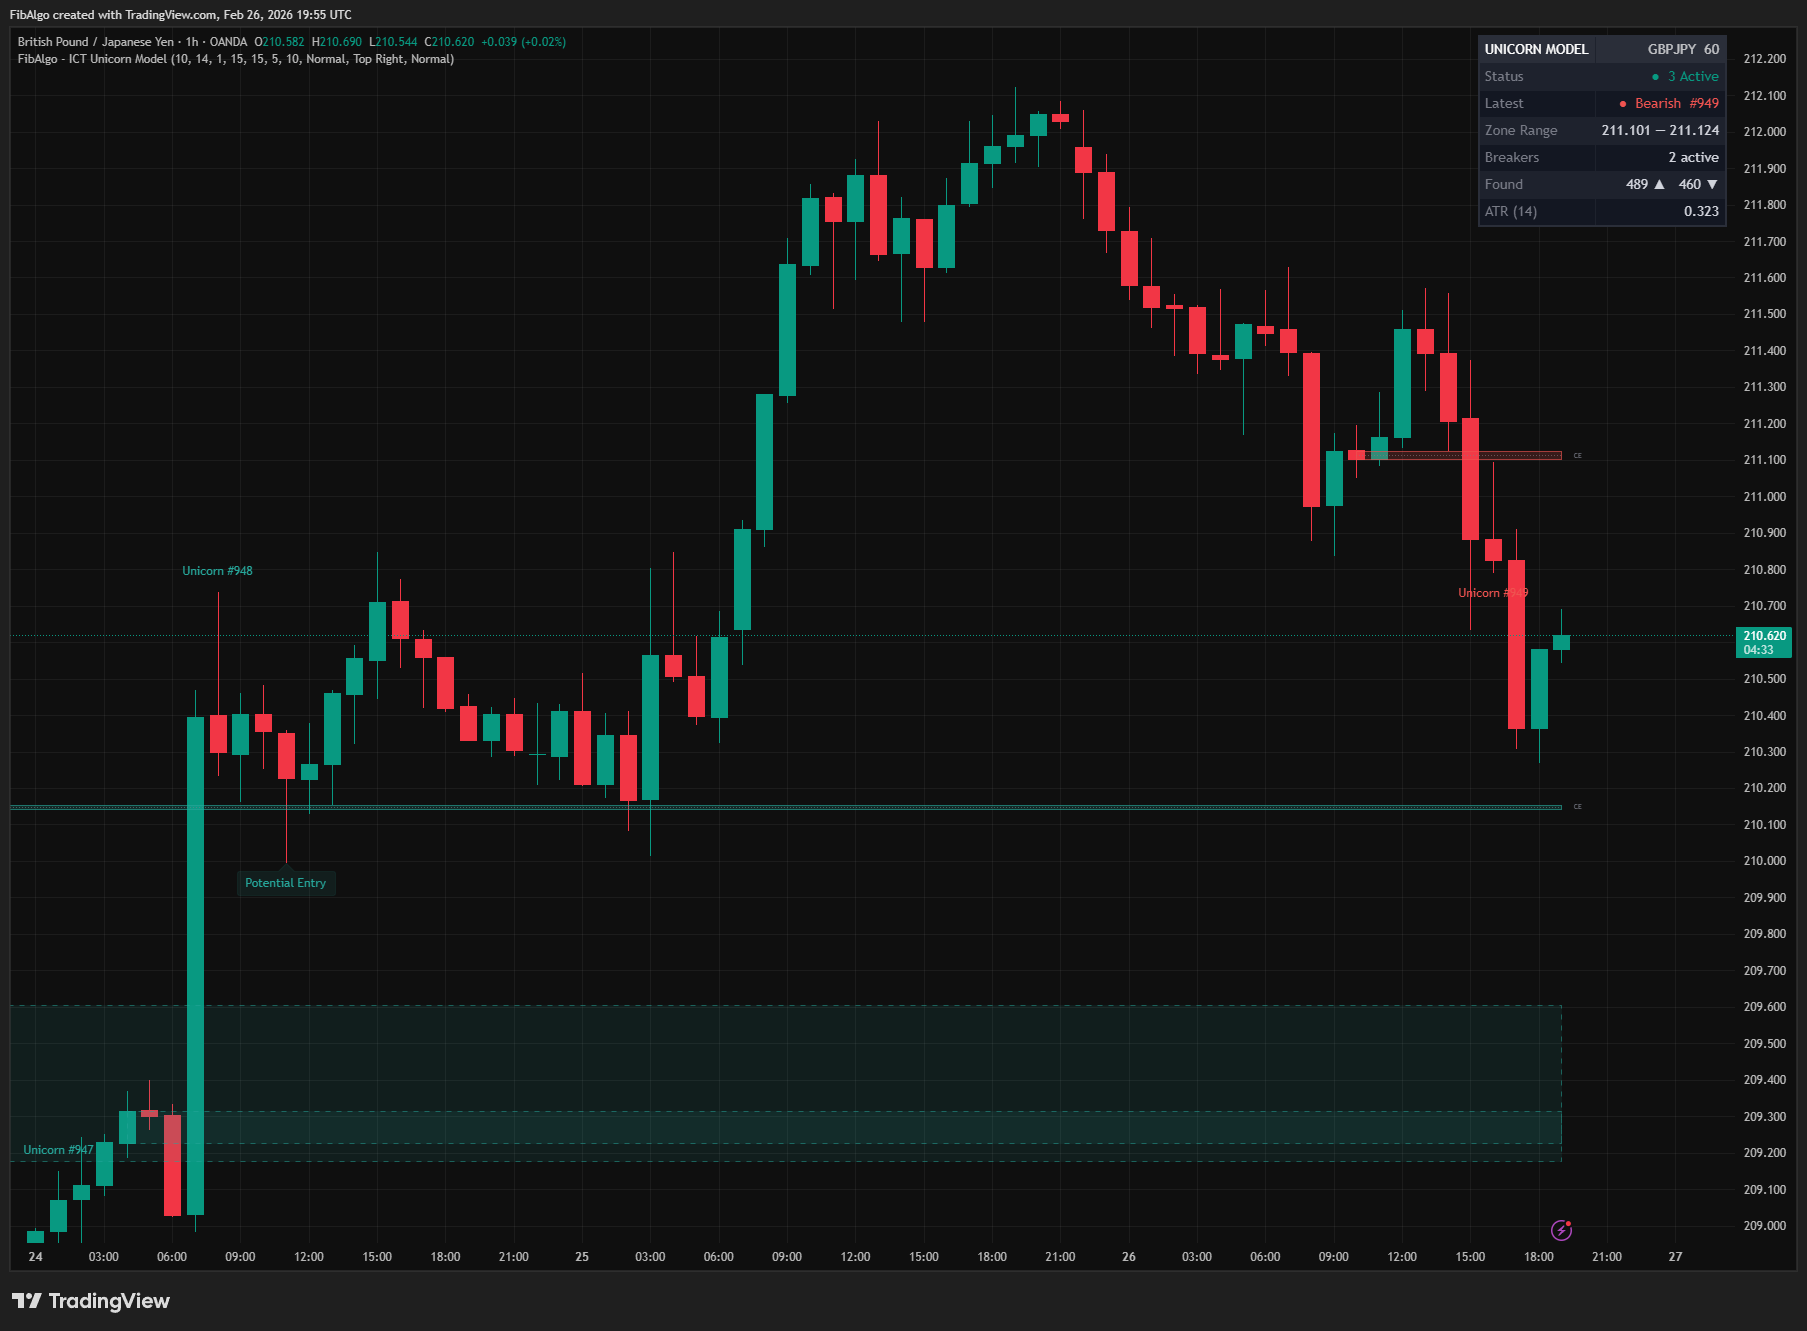
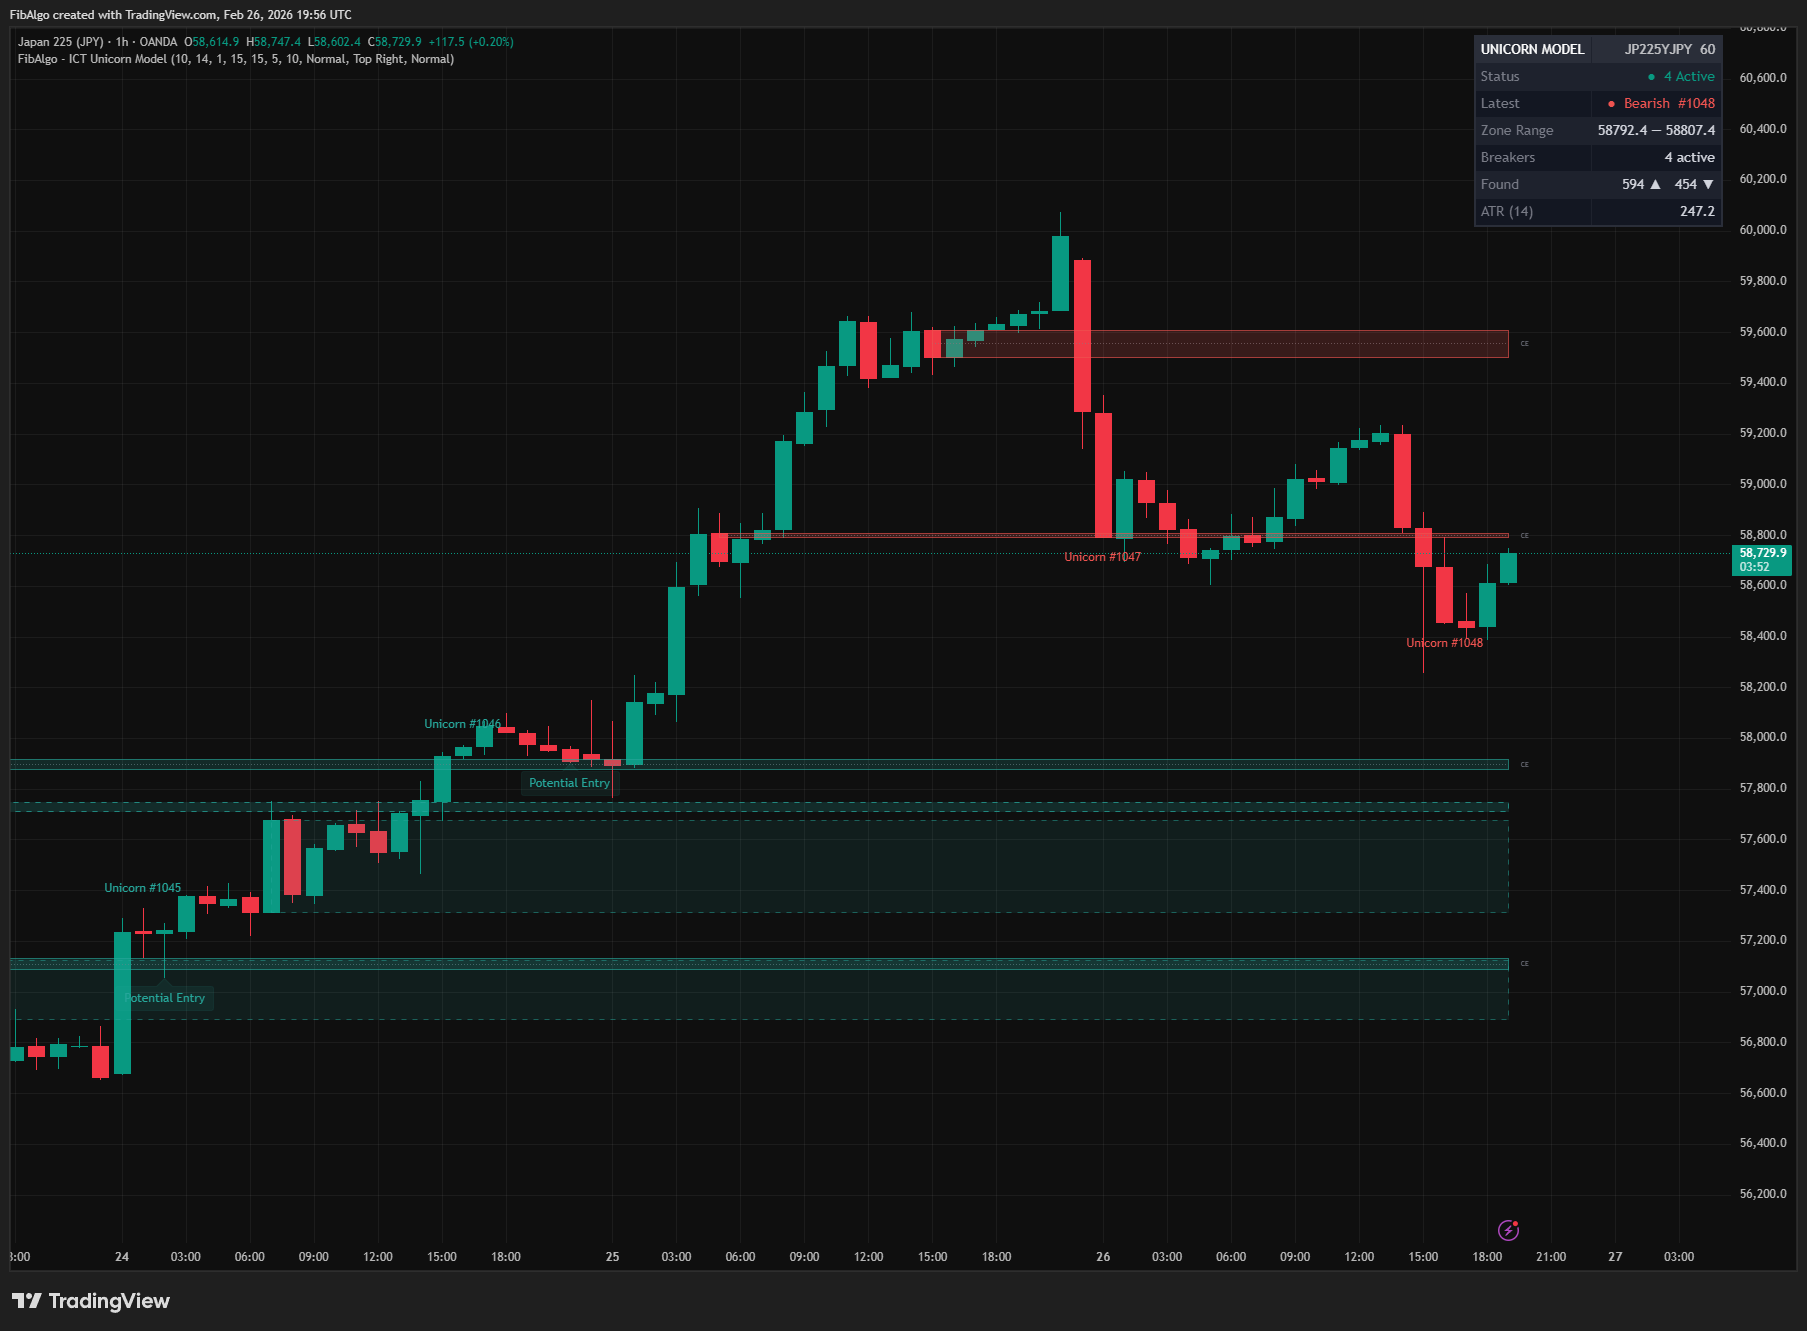
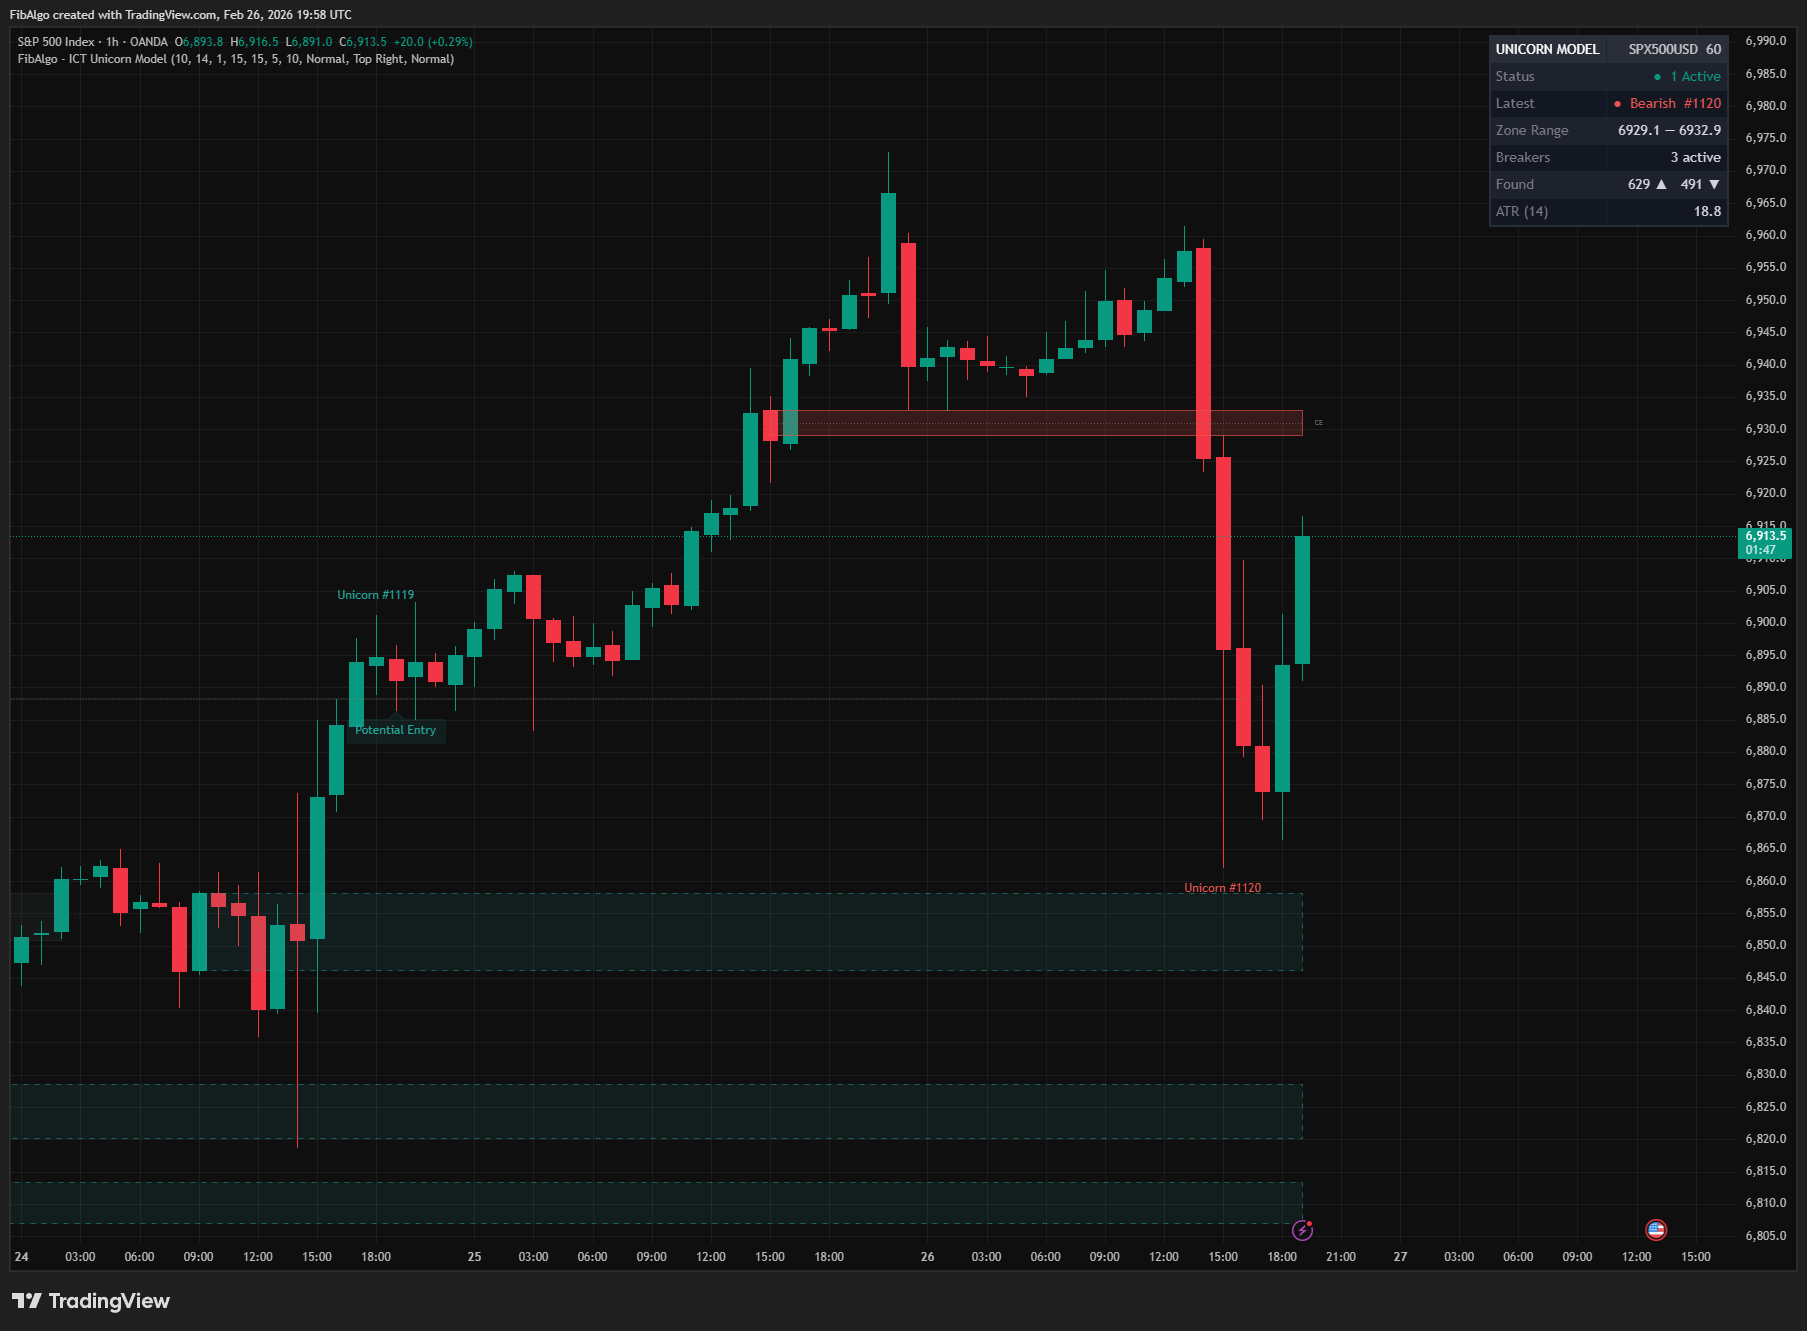
- Consequent Encroachment (CE) — The 50 % midpoint of the overlap zone. Price often reacts at this level, making it a precise reference for entries and targets.
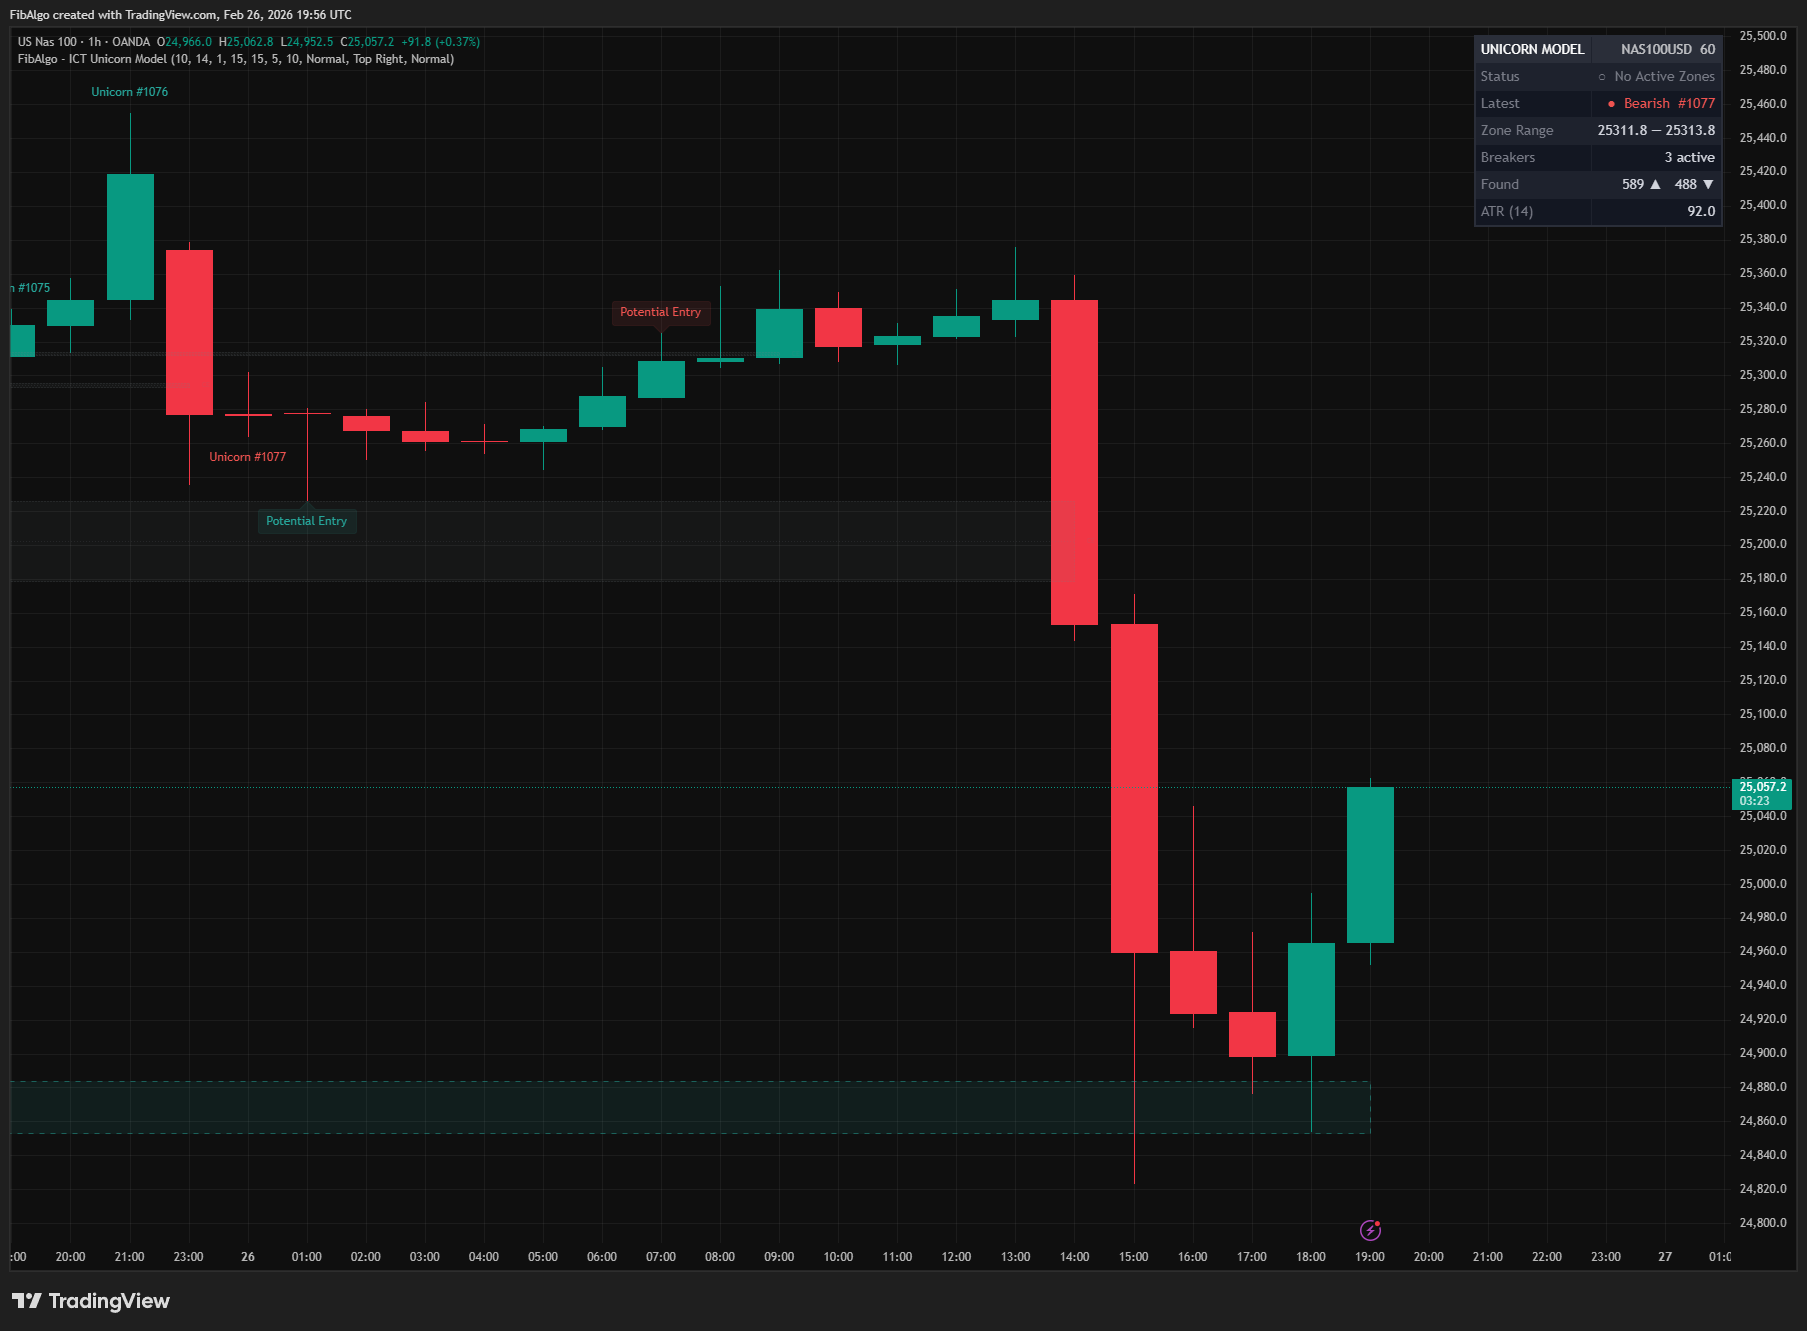
- Potential Entry — When price returns to an active Unicorn zone after its formation, the indicator marks the bar with a "Potential Entry" label to highlight the opportunity.
How It Works
1. Order Block Detection The indicator scans for institutional displacement candles (body exceeding ATR × multiplier) and identifies the last opposite-color candle preceding the displacement as an Order Block. Both body-based and full-range OB modes are supported. 2. Breaker Block Conversion When price closes beyond an active Order Block with displacement (candle body exceeds ATR × multiplier), the OB is "broken." The zone flips direction — a failed Bullish OB becomes a Bearish Breaker Block, and a failed Bearish OB becomes a Bullish Breaker Block. This displacement requirement ensures that only genuine structural breaks create Breaker Blocks, filtering out weak or insignificant breaks. Breaker Blocks are drawn with dashed borders in their respective colors when the display toggle is enabled. 3. Fair Value Gap Detection Classic three-bar FVG detection runs in parallel:- Bullish FVG (BISI): current bar low > two bars ago high
- Bearish FVG (SIBI): current bar high < two bars ago low
- Breaker and FVG must share the same direction
- FVG completion bar must be within Max Bar Gap of the Breaker formation bar (default: 5)
- Overlap top = min(Breaker top, FVG top)
- Overlap bottom = max(Breaker bottom, FVG bottom)
- If overlap top > overlap bottom, there is a valid intersection
- The overlap must meet the minimum overlap percentage threshold (default 10 %)
Features
- Automatic Unicorn Detection — Fully automated identification of Breaker Block + FVG overlap zones without manual analysis.
- Zone Numbering — Each Unicorn zone receives a sequential ID (#1, #2, etc.) for easy reference across the chart and in the info table.
- Potential Entry Markers — Labels drawn automatically when price leaves a Unicorn zone and then returns to it, placed at candle low (bullish) or high (bearish) for clear visibility. Requires a genuine price return — not triggered at zone formation.
- Breaker Block Visualization — Optional display of the underlying Breaker Blocks with dashed borders and directional coloring.
- FVG Visualization — Optional display of the underlying Fair Value Gaps (disabled by default for chart clarity).
- CE Midline with End Label — Consequent Encroachment dotted line at the 50 % midpoint with a "CE" end-label for clear identification.
- Invalidation Logic — Zones automatically turn gray with dotted borders when price closes beyond them, providing clear visual distinction between active and invalidated zones.
- Drawing Cleanup — Configurable maximum zones with automatic removal of oldest drawings to stay within platform limits.
- Info Table — Dashboard showing status indicators, latest zone direction and ID, zone range, active breaker count, total bull/bear count, and current ATR — all with alternating row backgrounds.
- Rich Tooltips — Hover over any Unicorn label or entry marker for detailed information including zone ID, direction, CE level, Breaker and FVG price levels.
- Configurable Detection — Adjustable OB lookback, ATR period, displacement multiplier, body/range toggle, minimum overlap percentage, and temporal proximity gap for precise control over detection sensitivity.
- Three Alert Types — Separate alerts for new Unicorn zone detection, potential entry signals (price return), and zone invalidation — each with price levels, direction, and timeframe.
- Full Color Customization — Independent color inputs for bullish/bearish Unicorns, Breaker Blocks, and FVGs.
How to Use
- Identify High-Probability Zones — Unicorn zones represent the overlap of a Breaker Block and an FVG — two separate ICT structures converging at the same price level. Focus on zones that form after clear displacement.
- Wait for Price Return — After a Unicorn zone forms, the indicator waits for price to move away from the zone and then retrace back. Only then will it draw a "Potential Entry" label. This ensures a genuine re-test rather than an immediate signal.
- Use CE as Precision Reference — The CE midline within the Unicorn zone provides a more precise level for entries and risk management.
- Combine with Trend Context — Bullish Unicorn zones work best in an overall bullish market structure; bearish zones in bearish structure. Use a market structure indicator for directional bias.
- Toggle Underlying Zones — Enable "Show Breaker Blocks" and "Show FVGs" to understand the components forming each Unicorn zone. Disable them once comfortable for a cleaner chart.
- Monitor the Info Table — The table provides at-a-glance status of active zones, latest zone details, active breaker count, and current ATR for context.
Limitations
- This indicator does not generate buy or sell signals. It highlights structural zones for educational and analytical purposes.
- Unicorn Model detection depends on displacement ATR thresholds — results vary across timeframes and instruments. Adjust the ATR multiplier for your specific market.
- Order Block and FVG detection are simplified implementations; they may not capture every nuance of manual ICT analysis.
- Very tight or very wide minimum overlap settings may produce too many or too few detections. The default of 10 % is balanced for most markets.
- Maximum drawing limits apply. Only the most recent Unicorn zones (default: 5) are preserved on the chart.
- Past performance of detected zones is not indicative of future results.
Tags
#Smart Money#Price Action#Signals