Overview
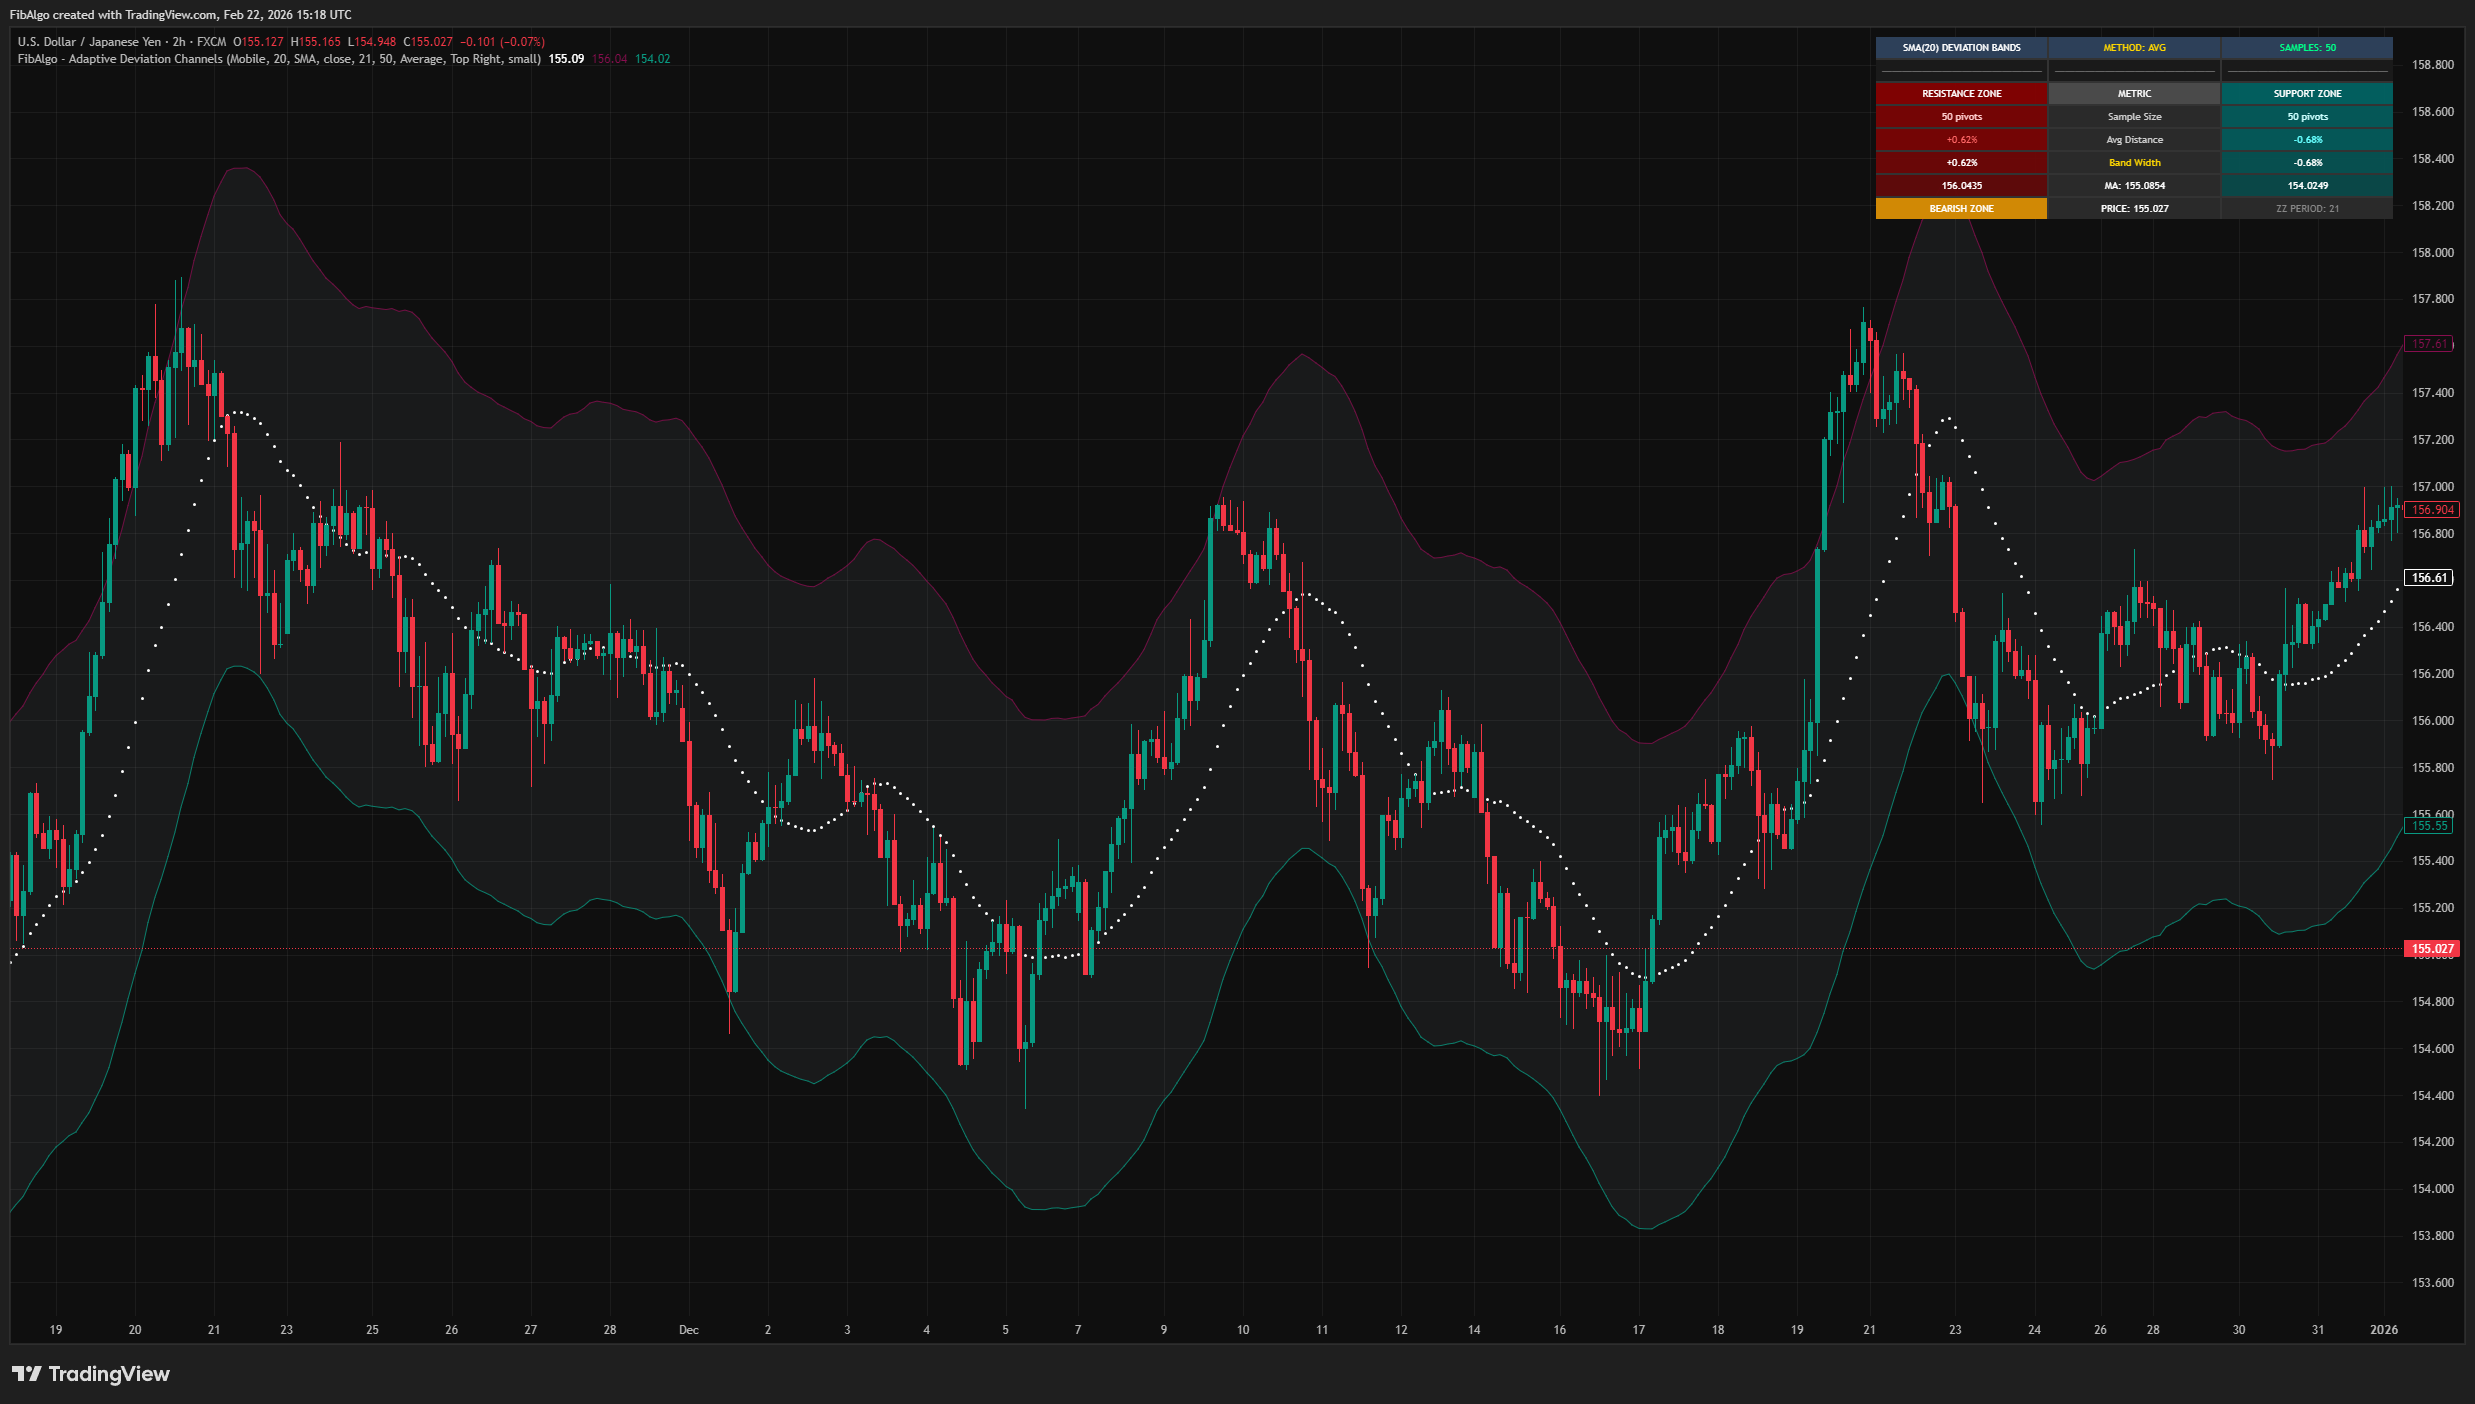
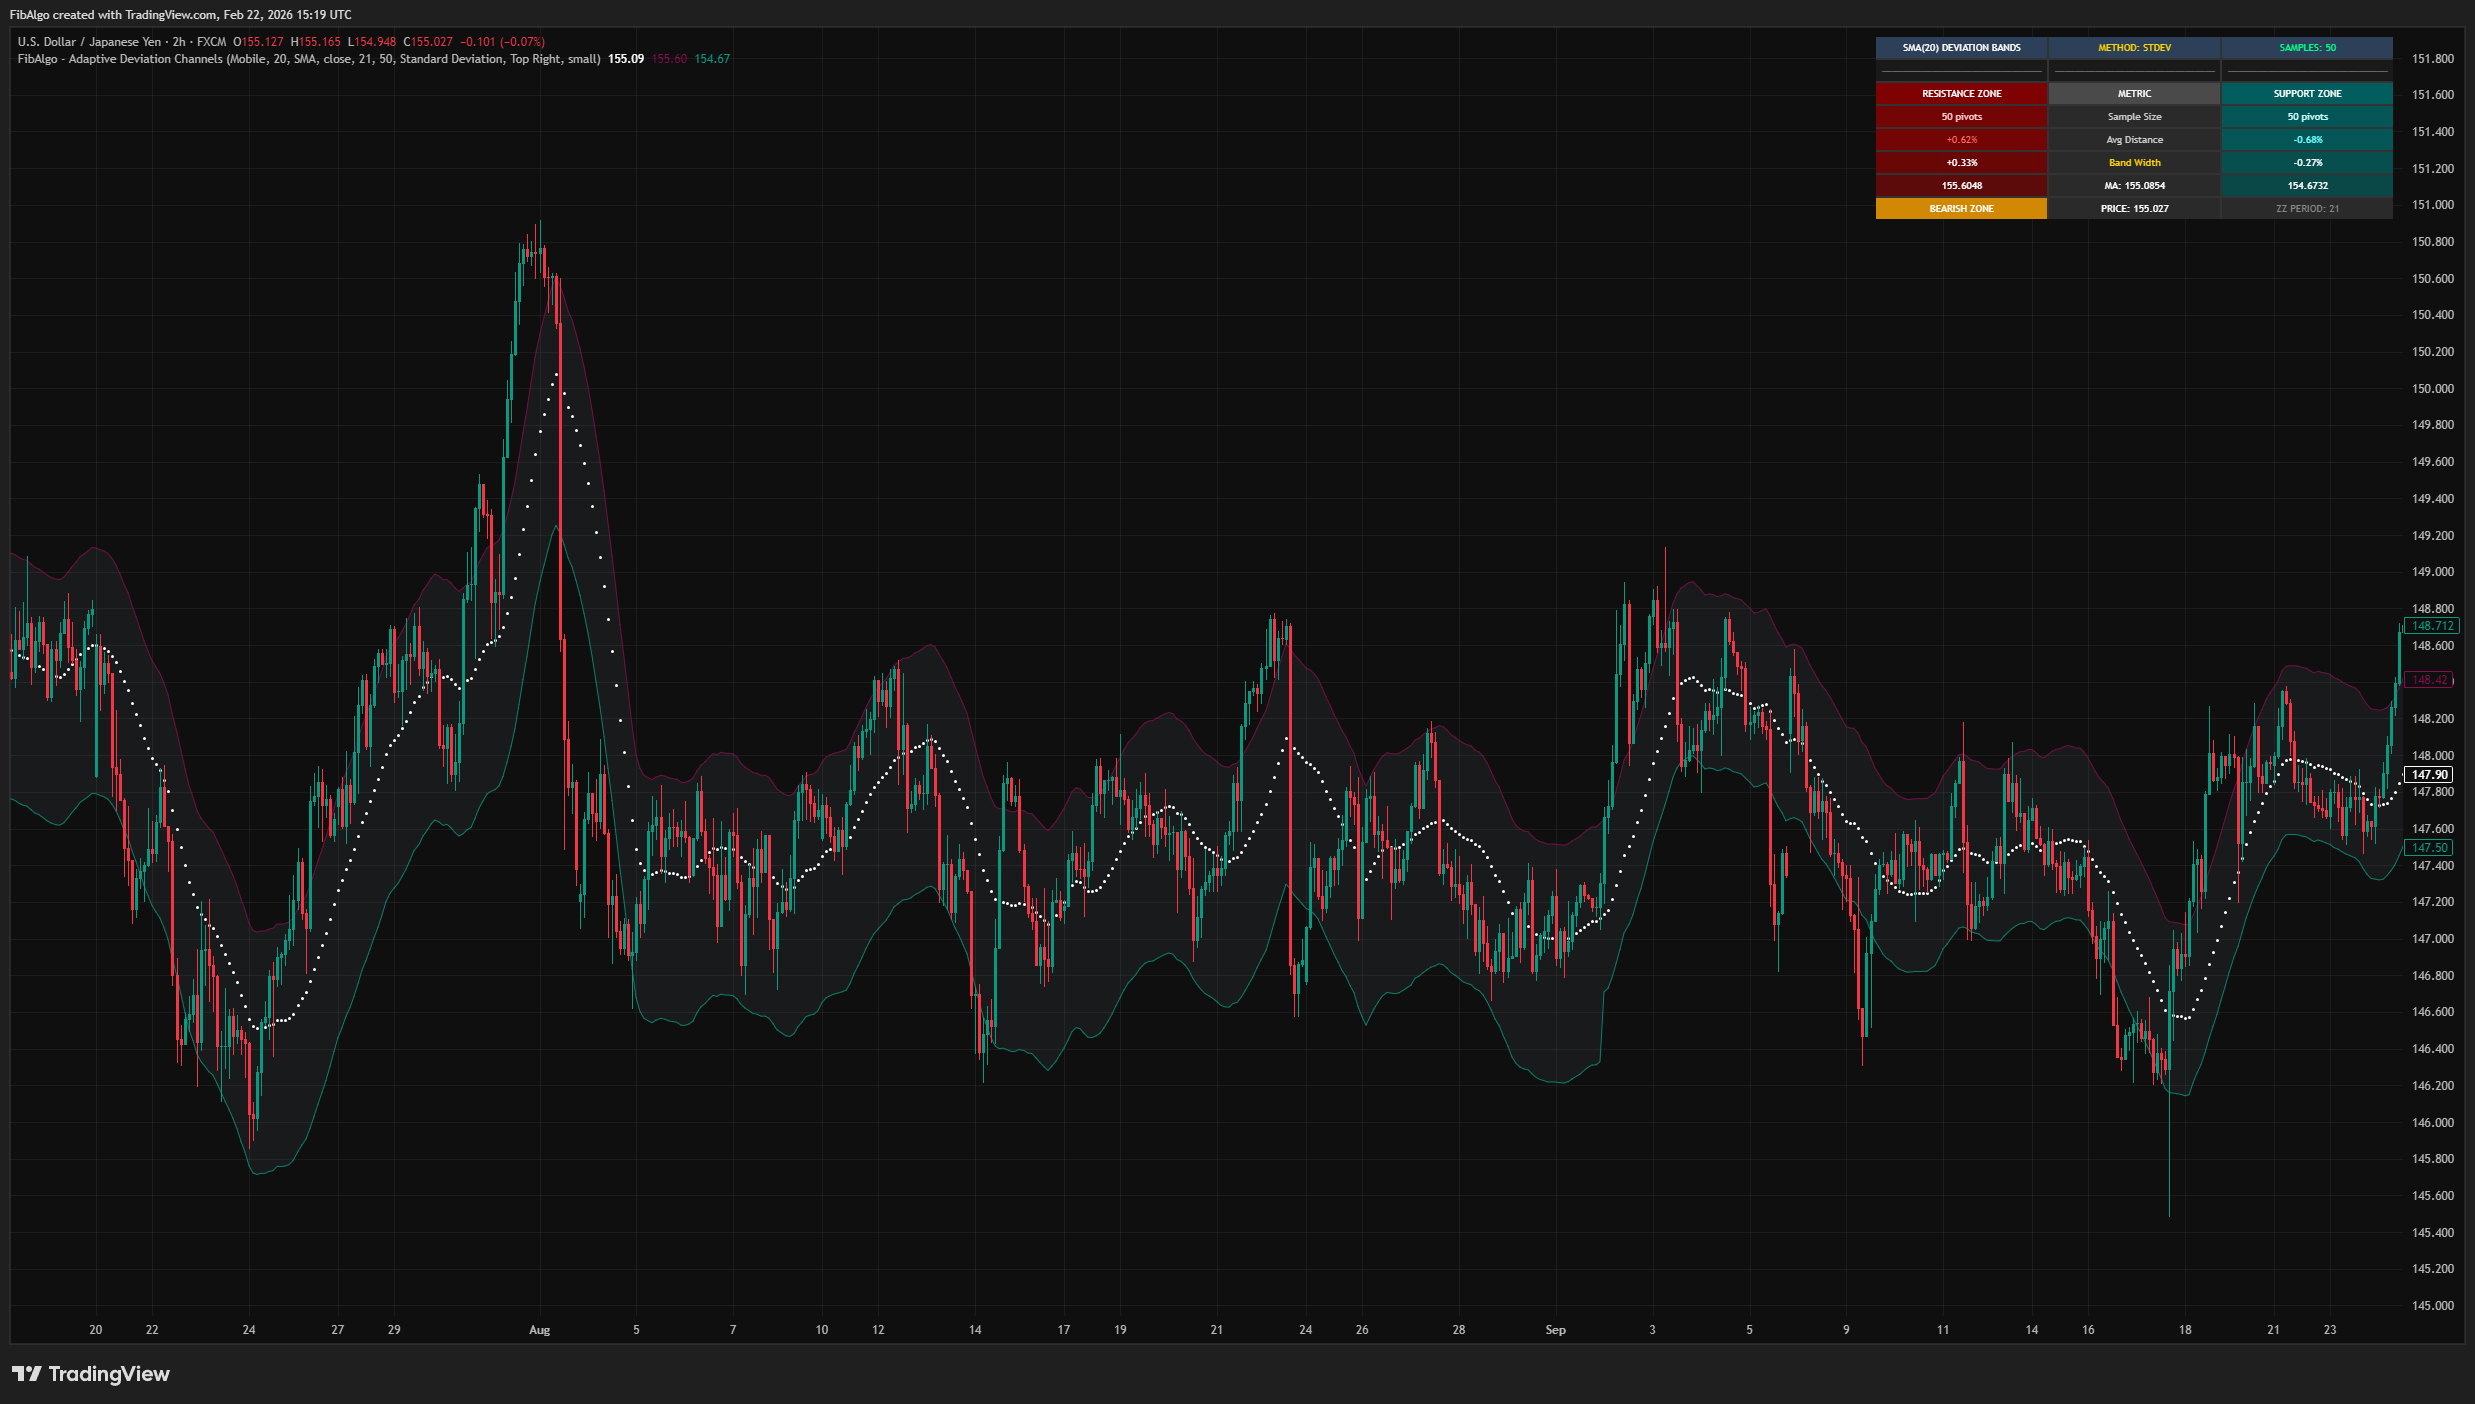
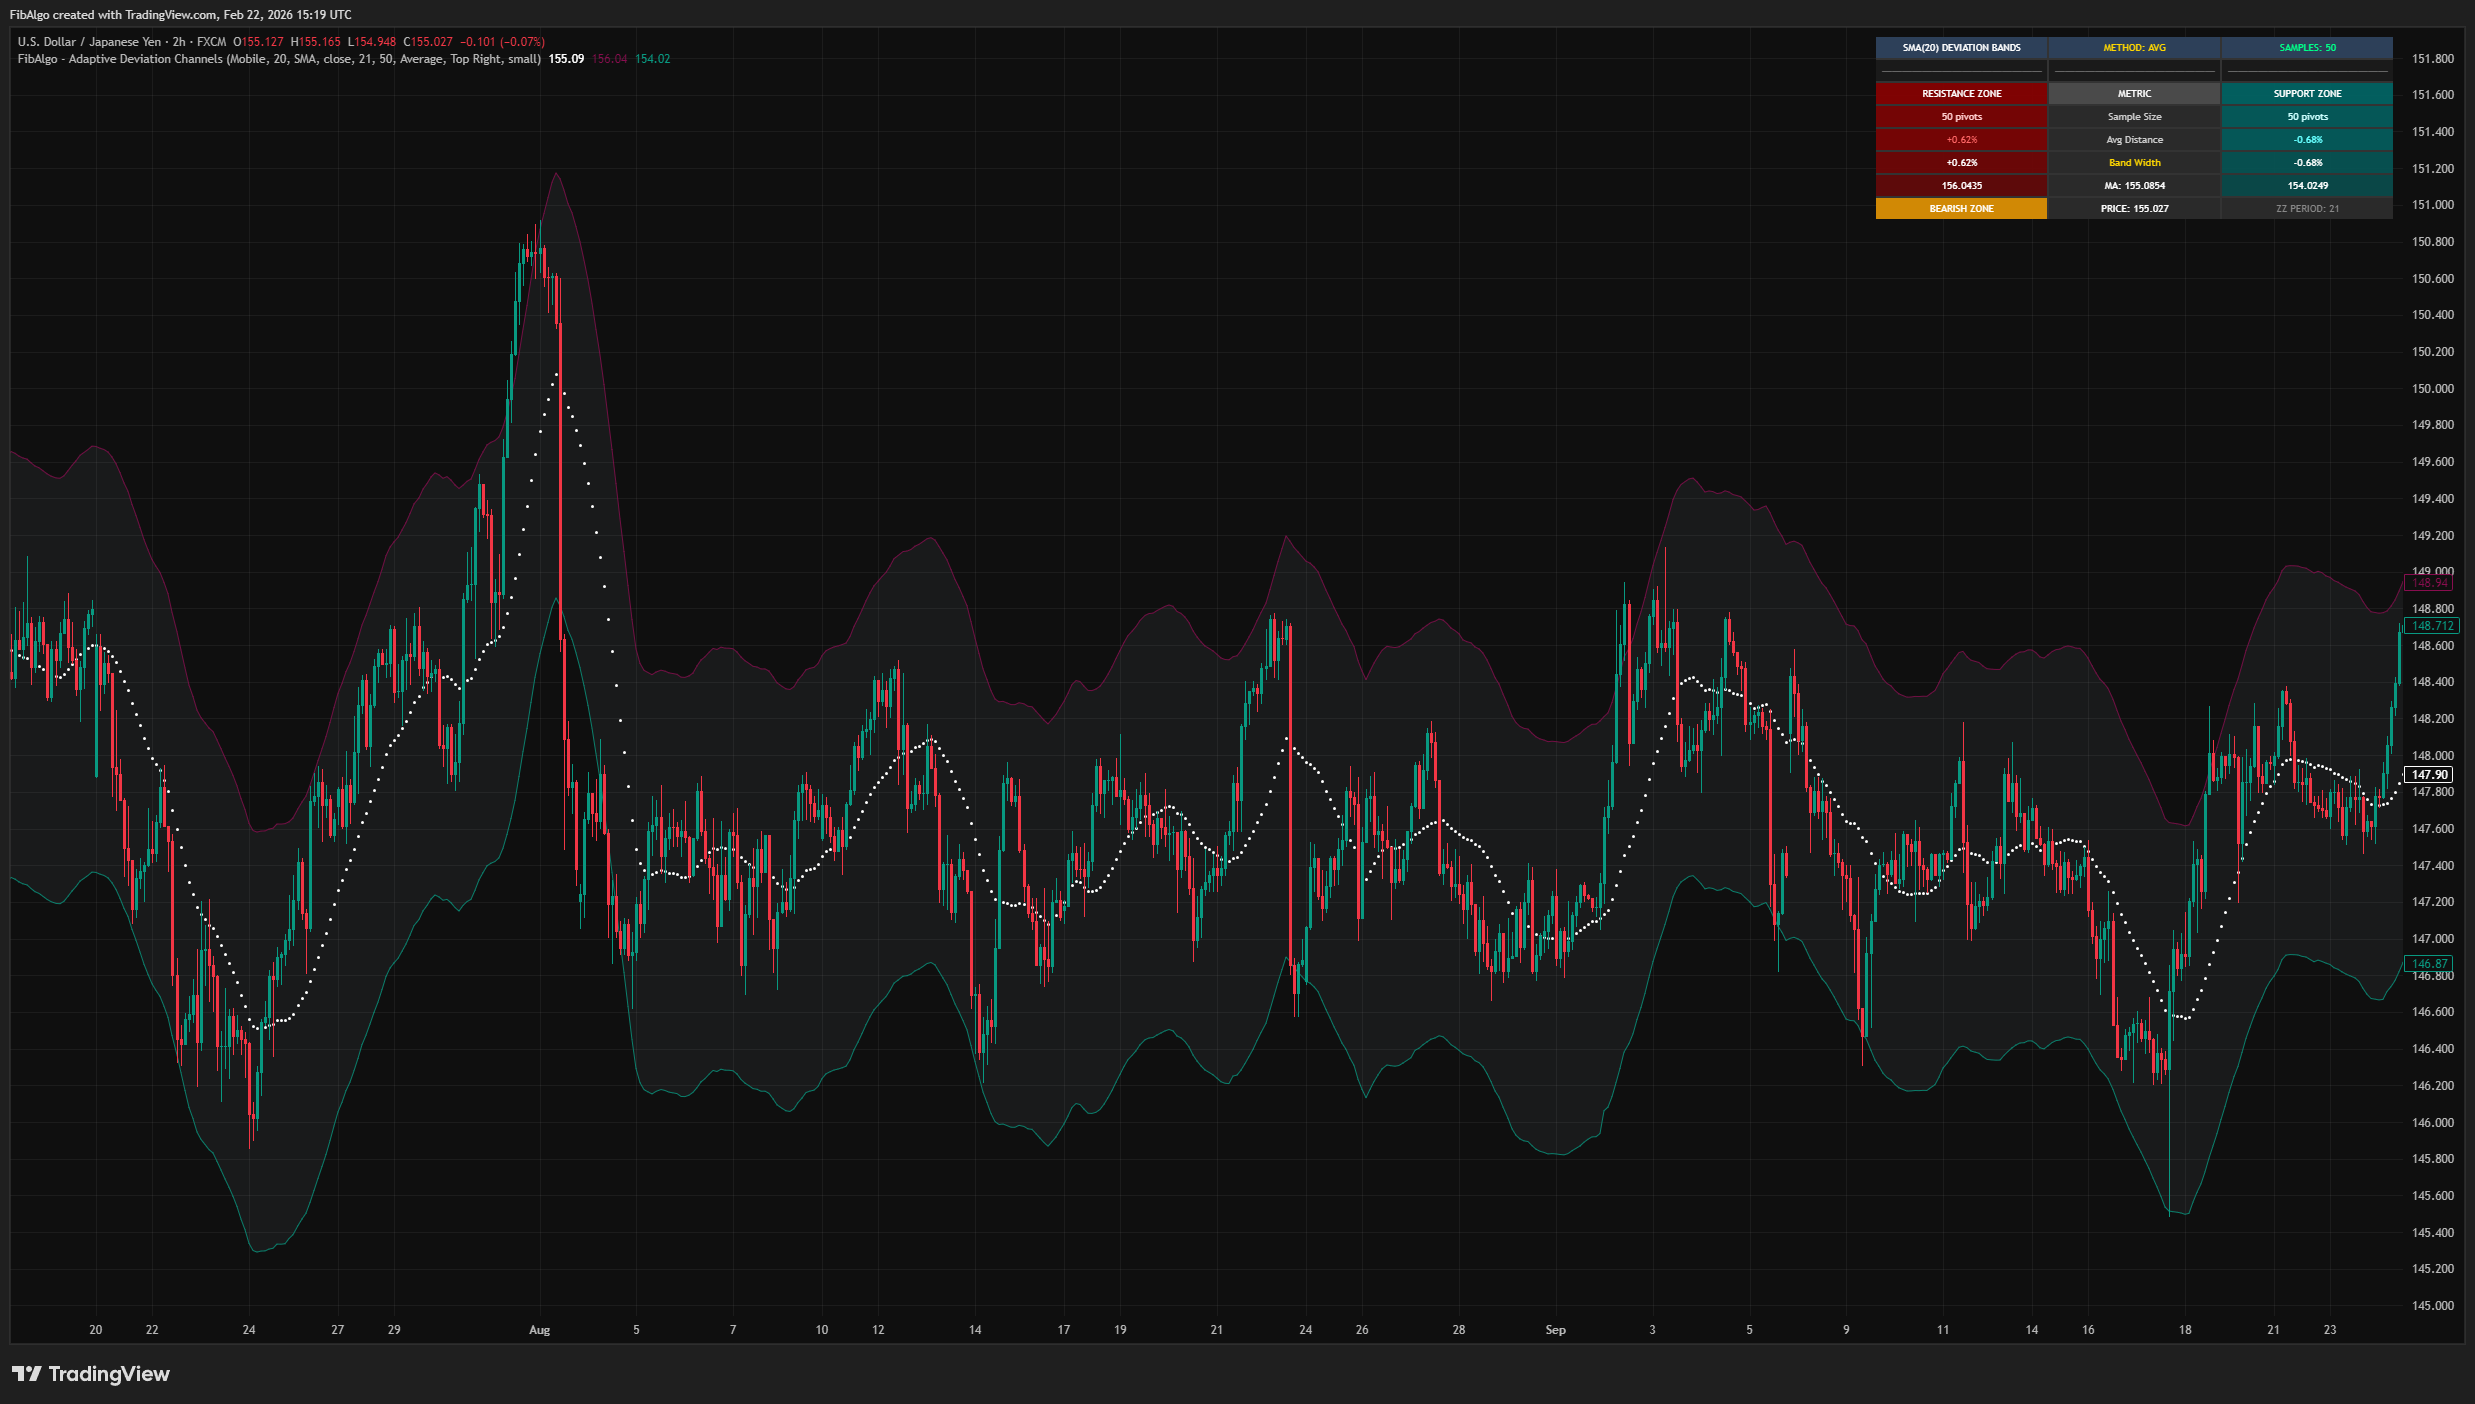
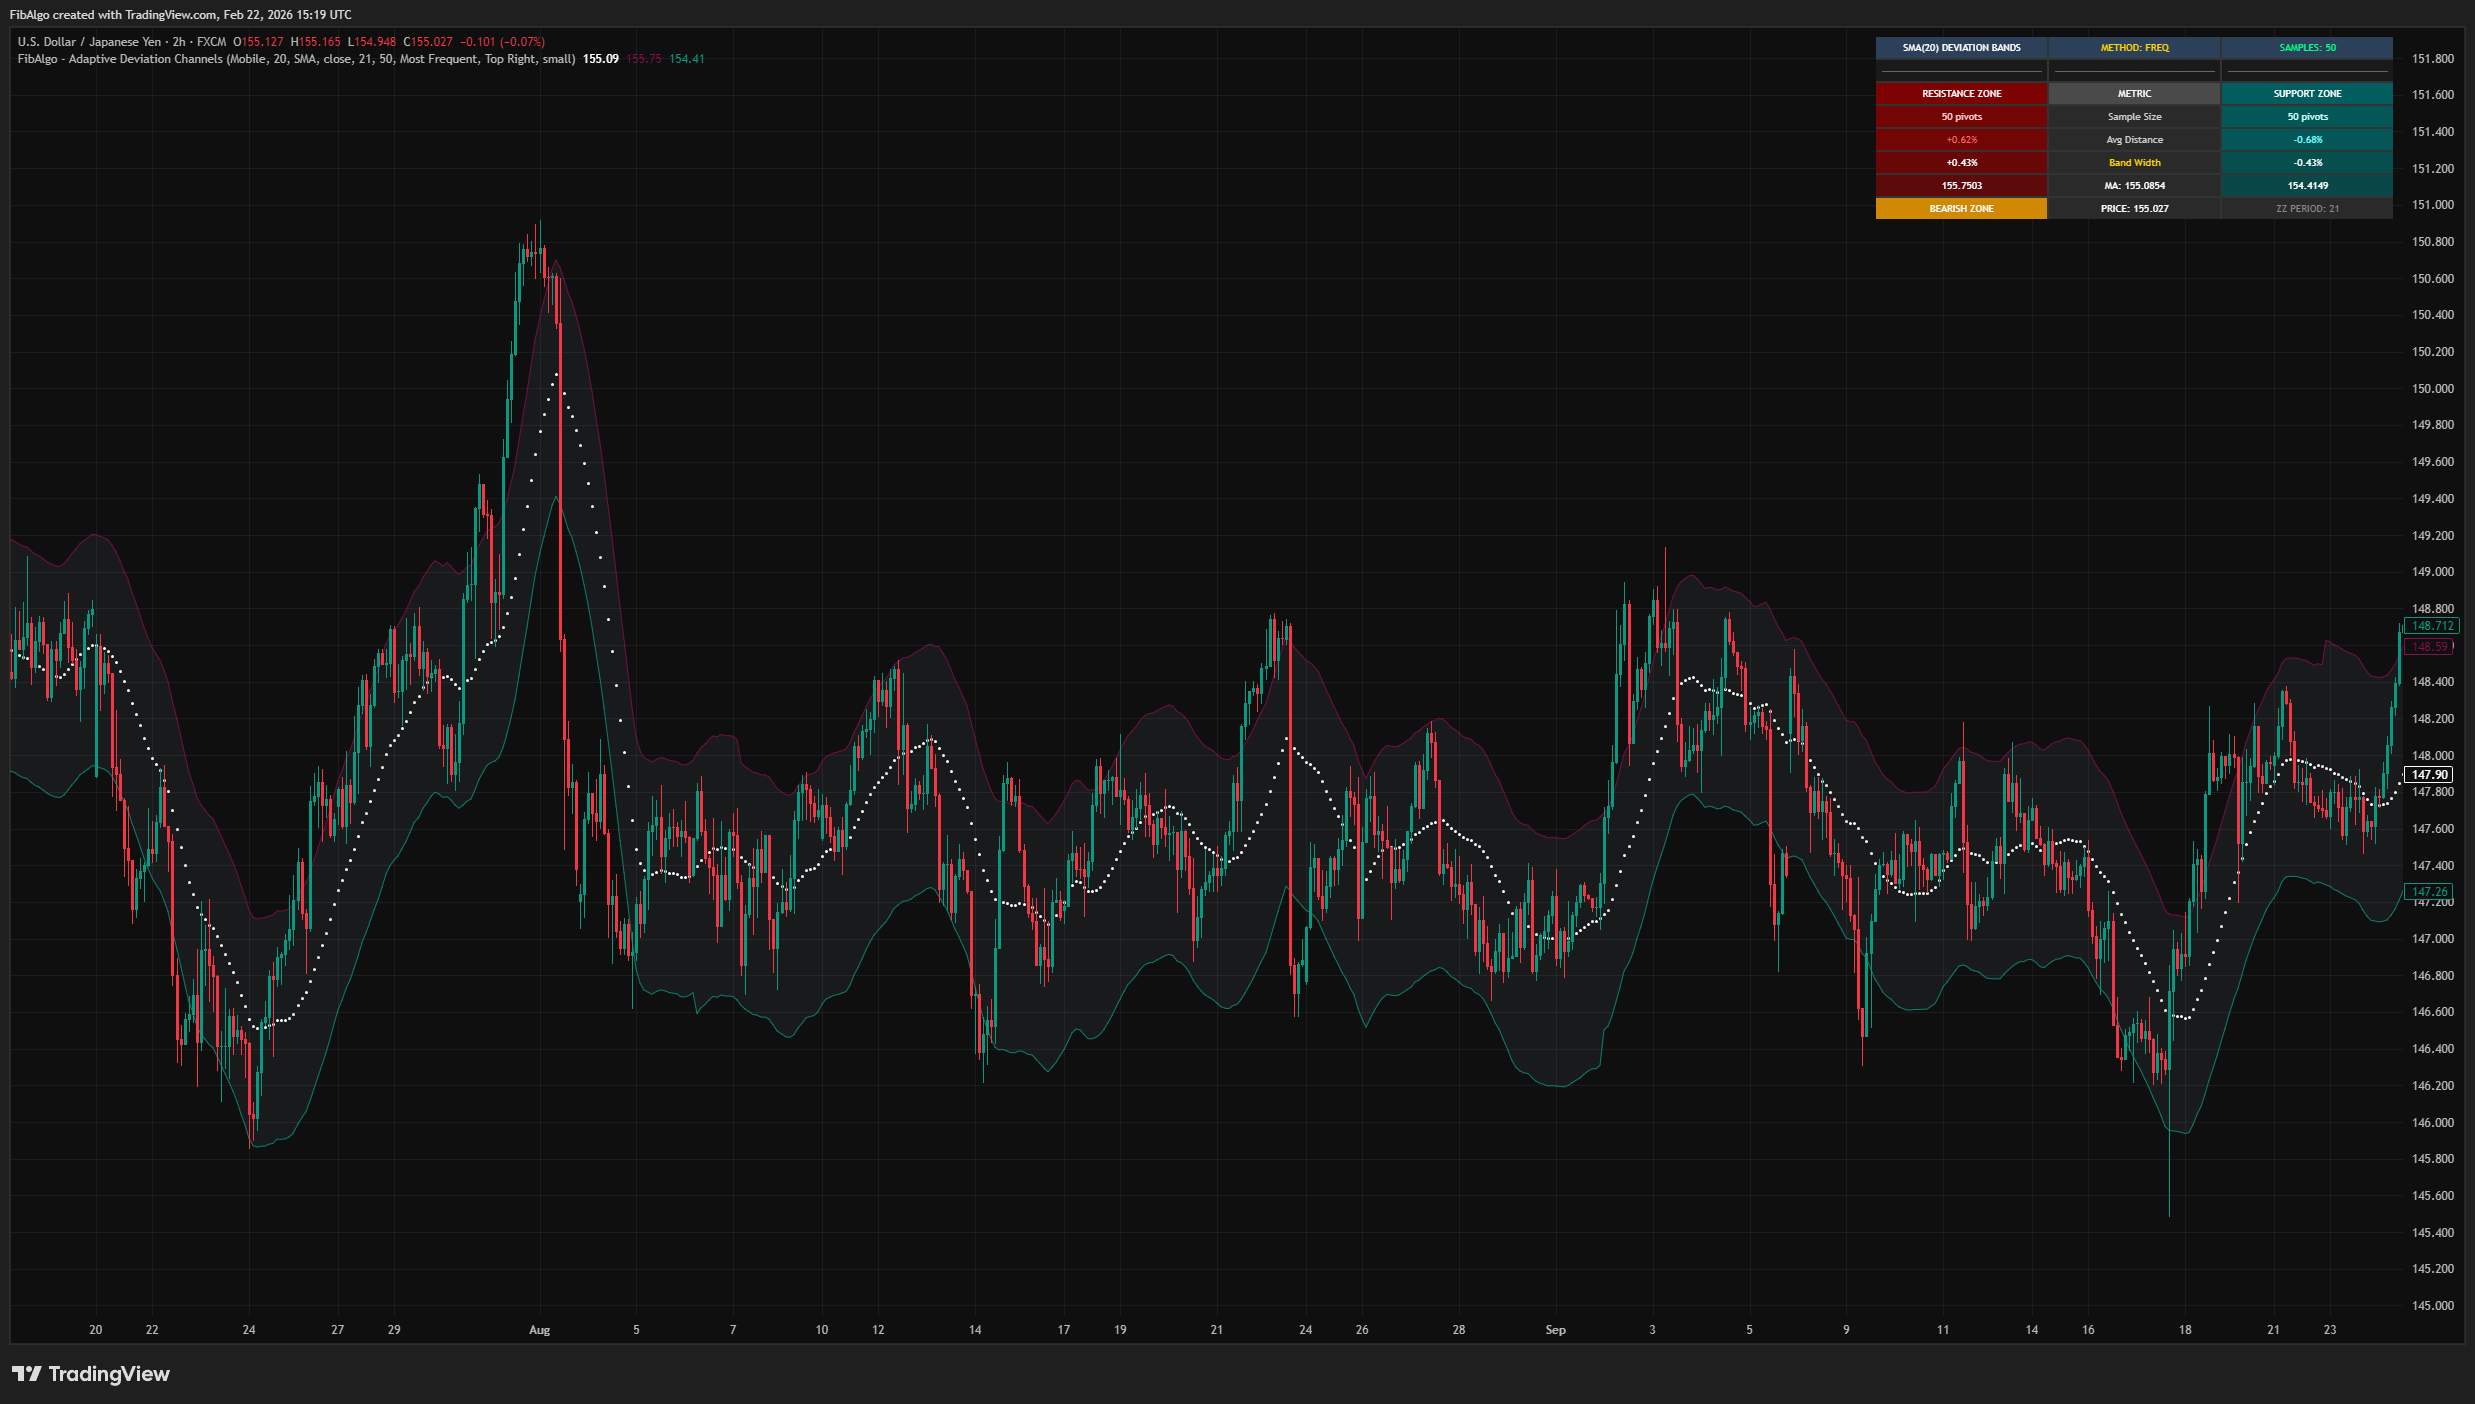
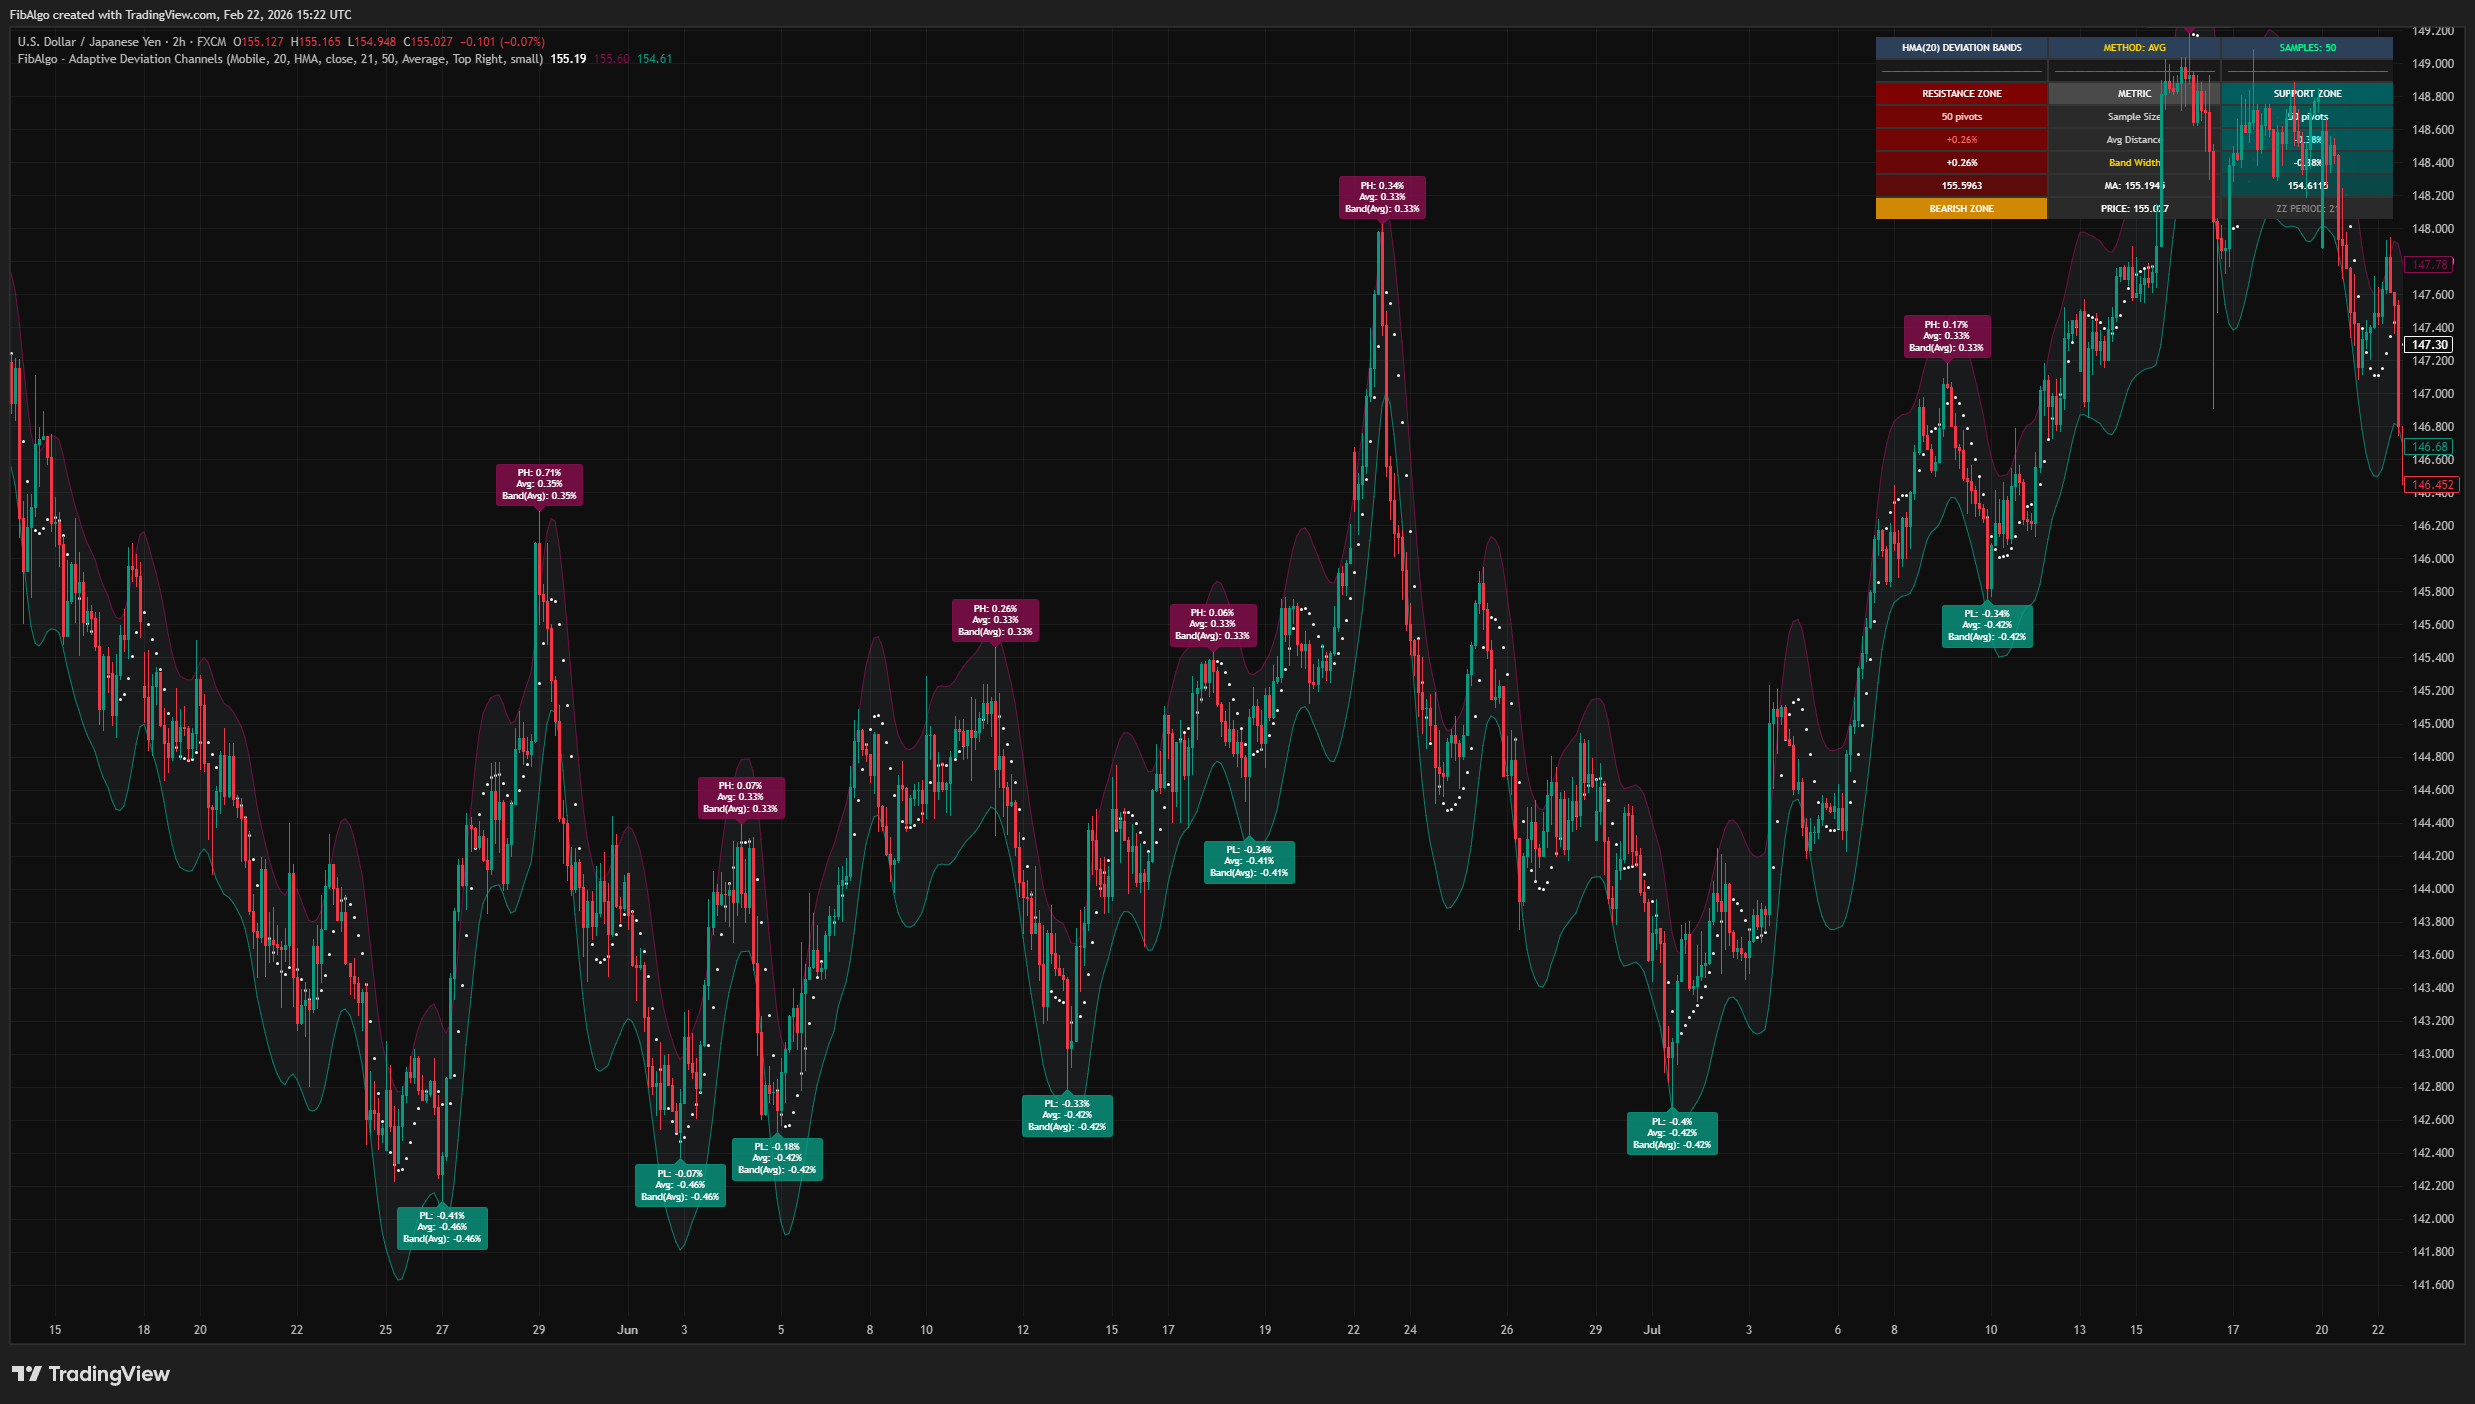
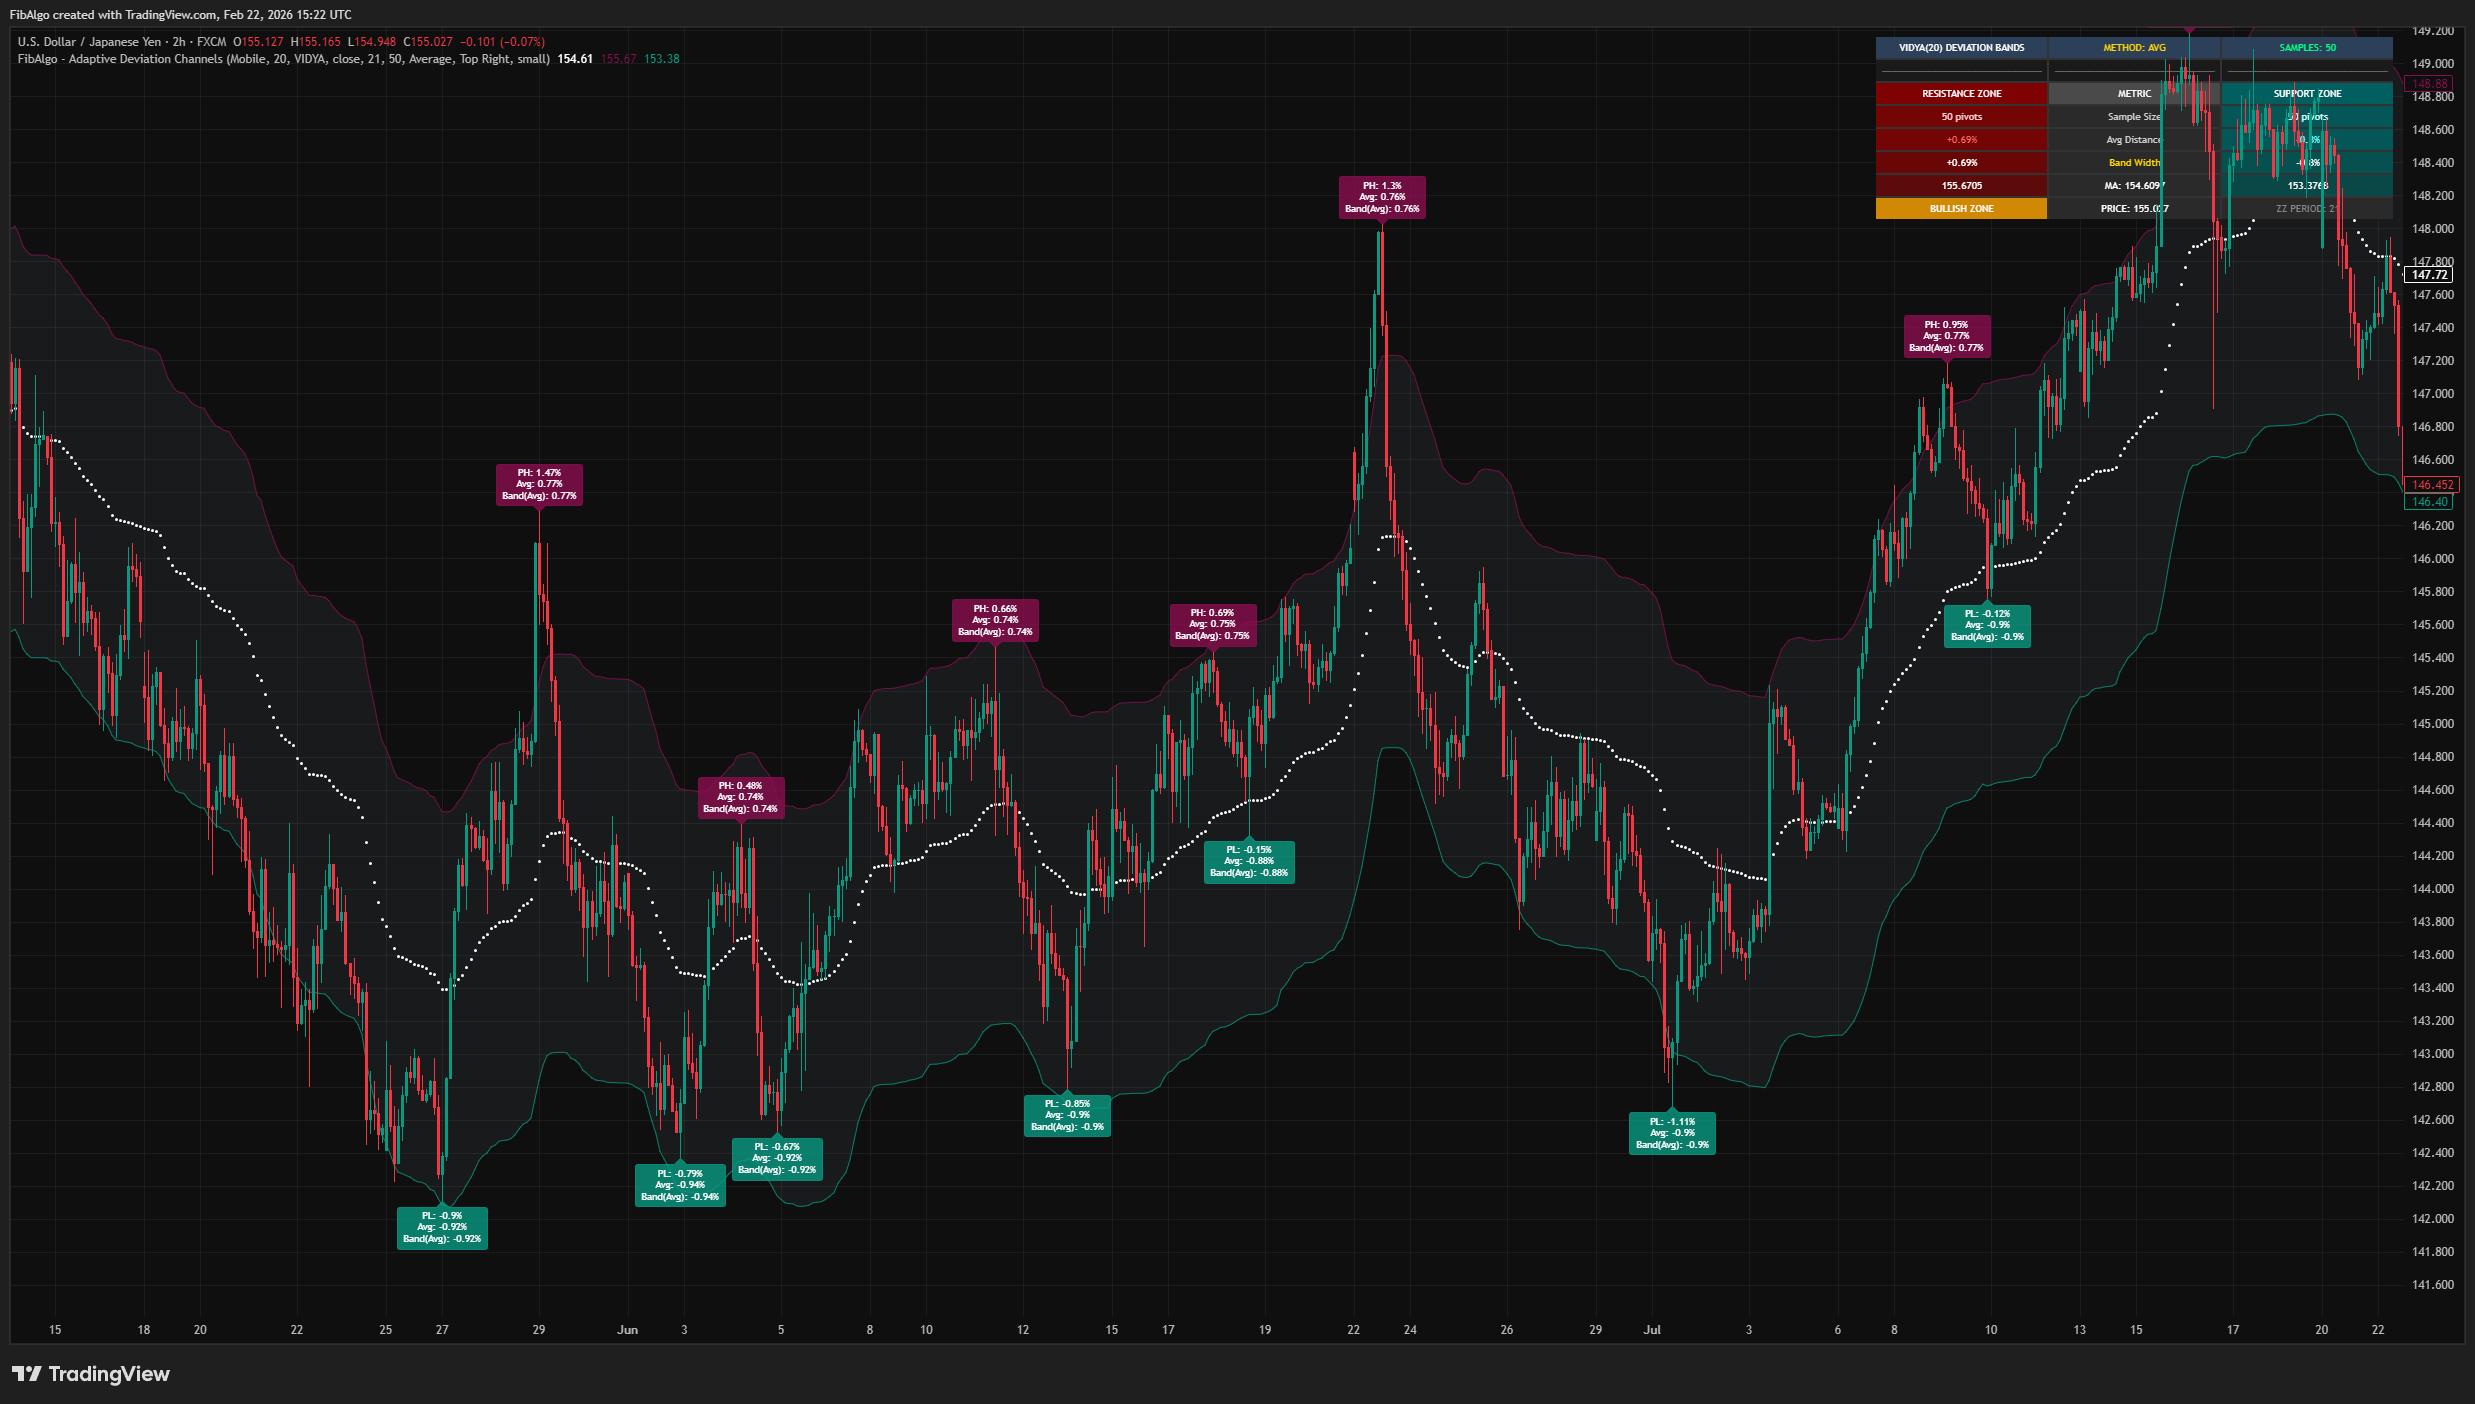
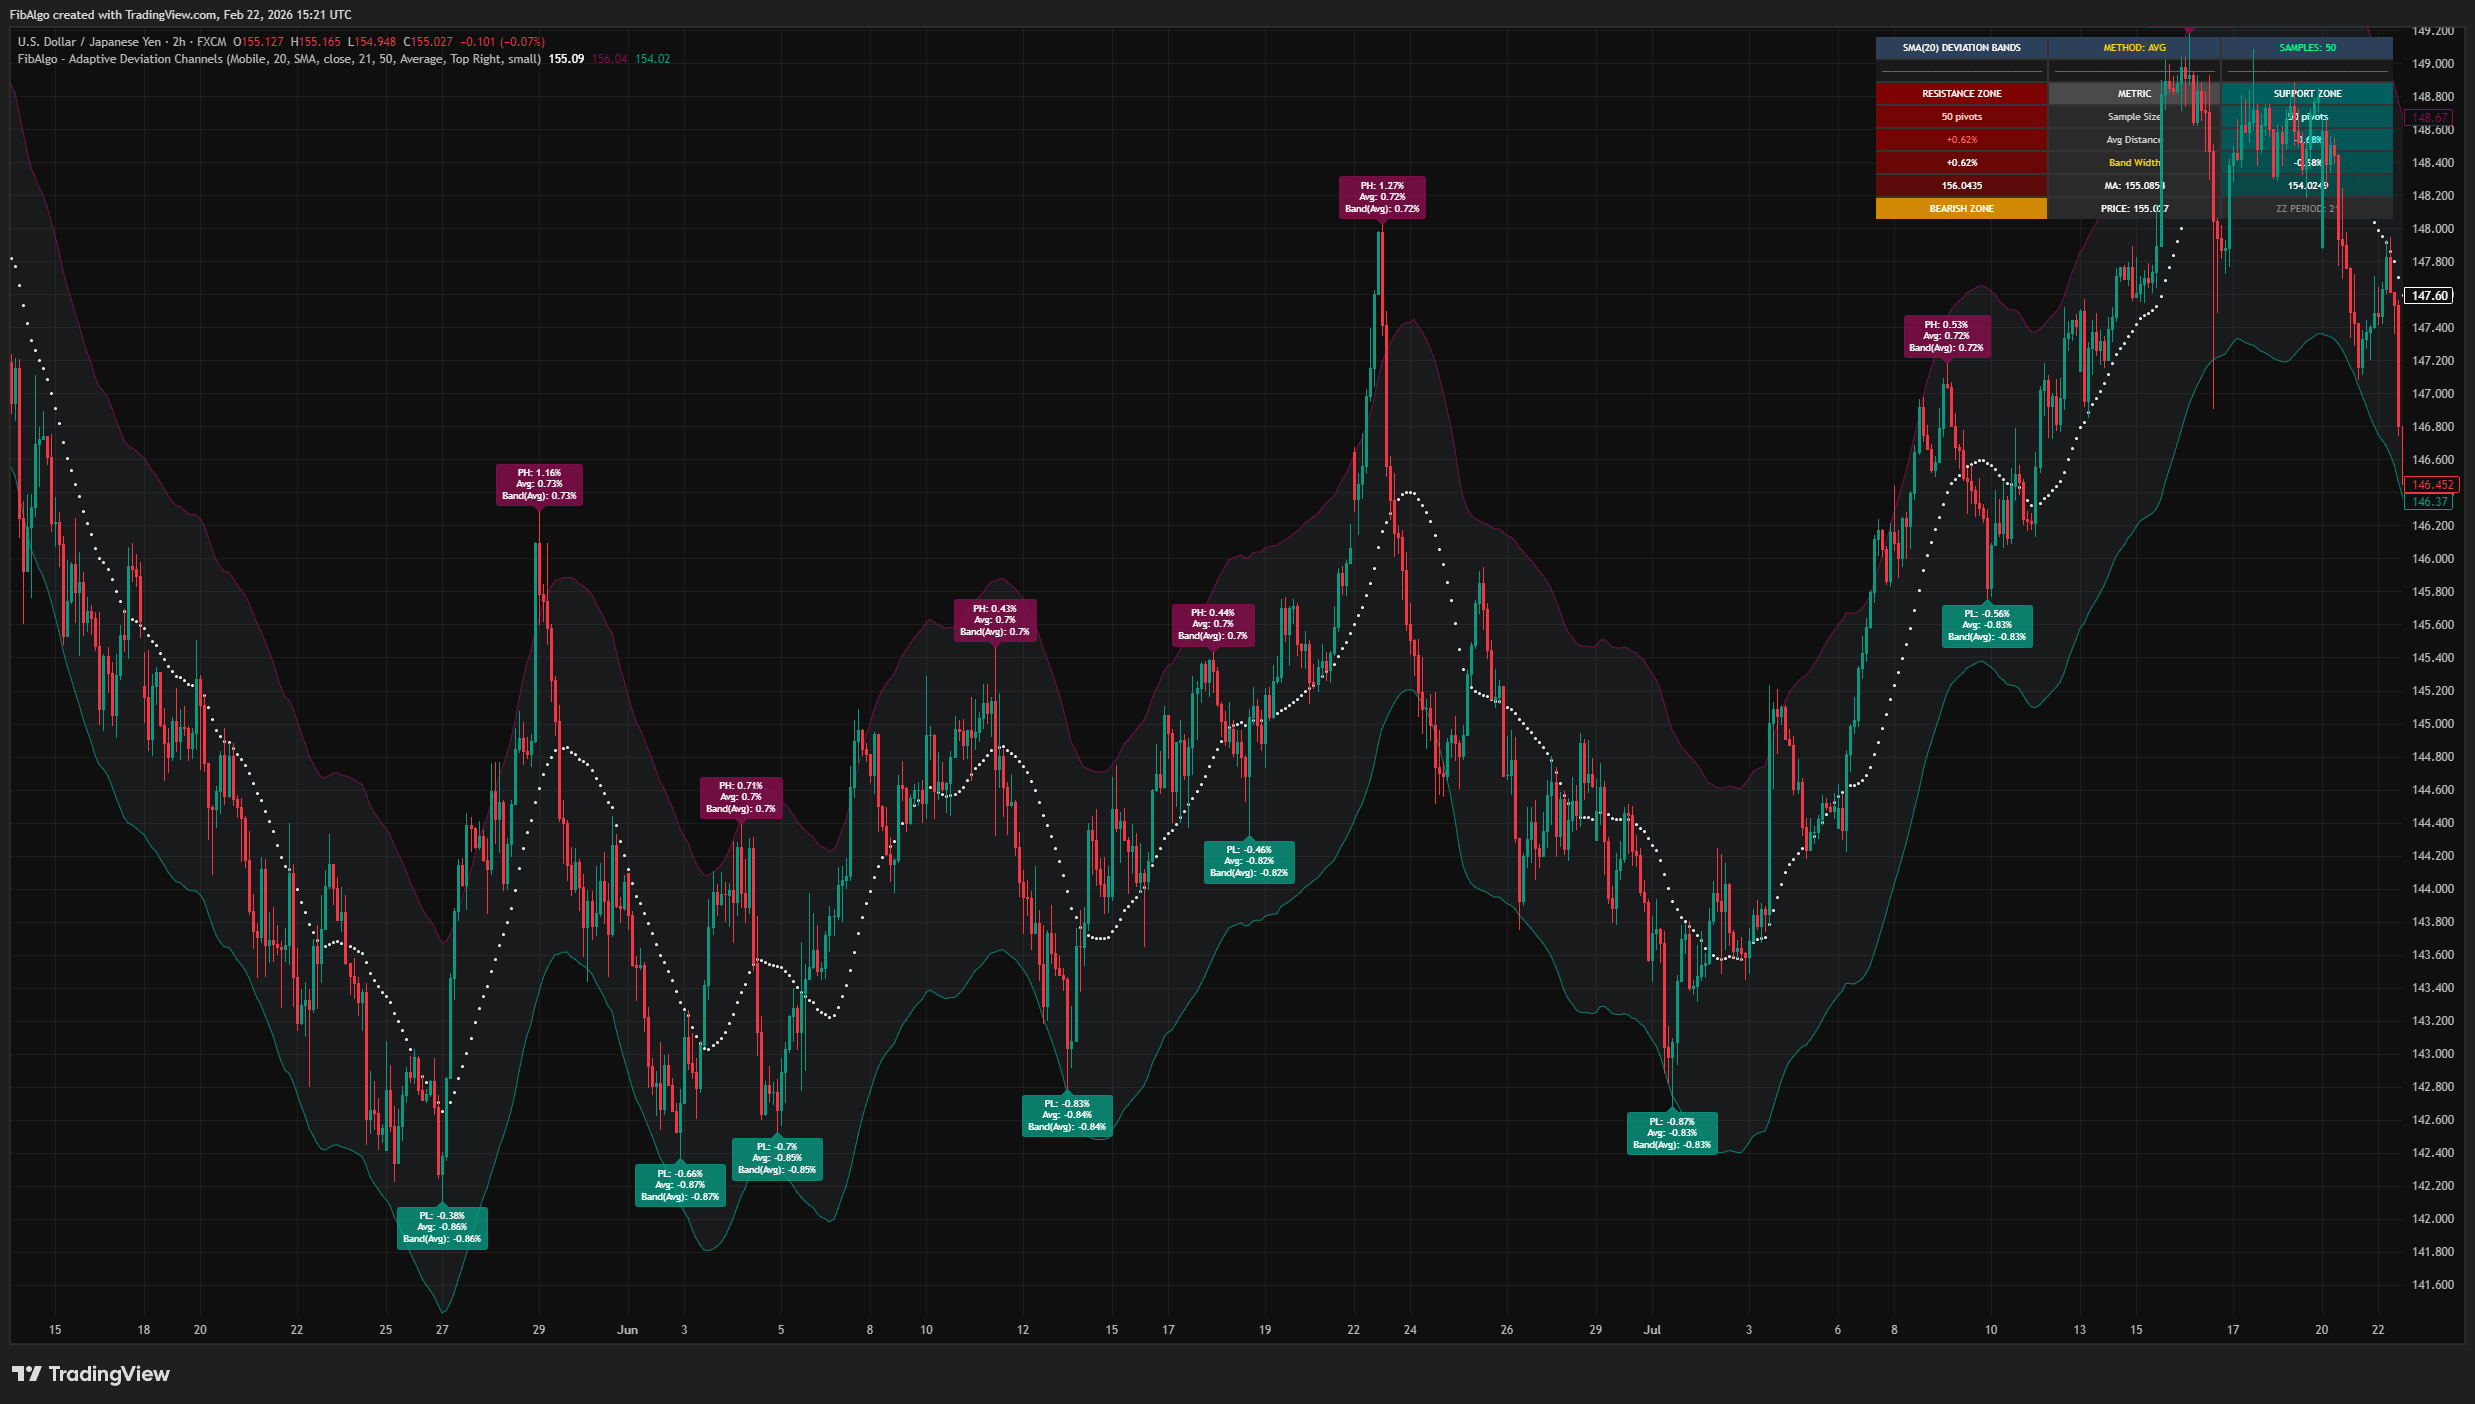
FibAlgo - Adaptive Deviation Channels is a statistical band indicator that creates dynamic support and resistance zones around a central moving average by analyzing the historical percentage deviations of detected pivot points. Rather than using fixed multipliers or standard deviations of price alone, it measures how far past pivot highs and pivot lows have deviated from the moving average, then projects those statistical boundaries forward in real time.
The indicator features configurable moving average types, a zigzag-based pivot detection engine, three band calculation methods (Average, Standard Deviation, Most Frequent), and an analysis dashboard.
Pivot-Based Deviation Measurement
The core idea is that market extremes tend to reach statistically consistent distances from a mean. The indicator uses a zigzag algorithm to identify significant pivot highs and pivot lows, then measures each pivot's percentage distance from the moving average at that moment. These measurements are stored in separate arrays for highs and lows, forming two independent statistical distributions.
Three Calculation Methods
The collected deviation data can be summarized using three different statistical methods:
- Average — Places bands at the mean percentage deviation. Shows the typical reversal distance from the MA.
- Standard Deviation — Uses the statistical standard deviation of the deviations. Highlights volatility-adjusted extremity zones.
- Most Frequent — Identifies the most commonly occurring deviation percentage using histogram binning. Marks the most repetitive exhaustion distance.
Asymmetric Bands
Unlike symmetric channel indicators, this indicator calculates upper and lower bands independently. The upper band is derived entirely from pivot high deviations, while the lower band uses pivot low deviations. This reflects the common market behavior where upside and downside volatility profiles differ.
Step 1 — Moving Average Calculation
A configurable moving average (SMA, EMA, WMA, TMA, VIDYA, WWMA, ZLEMA, TSF, HMA, or VWMA) is calculated as the central baseline. This serves as the reference point for all deviation measurements.
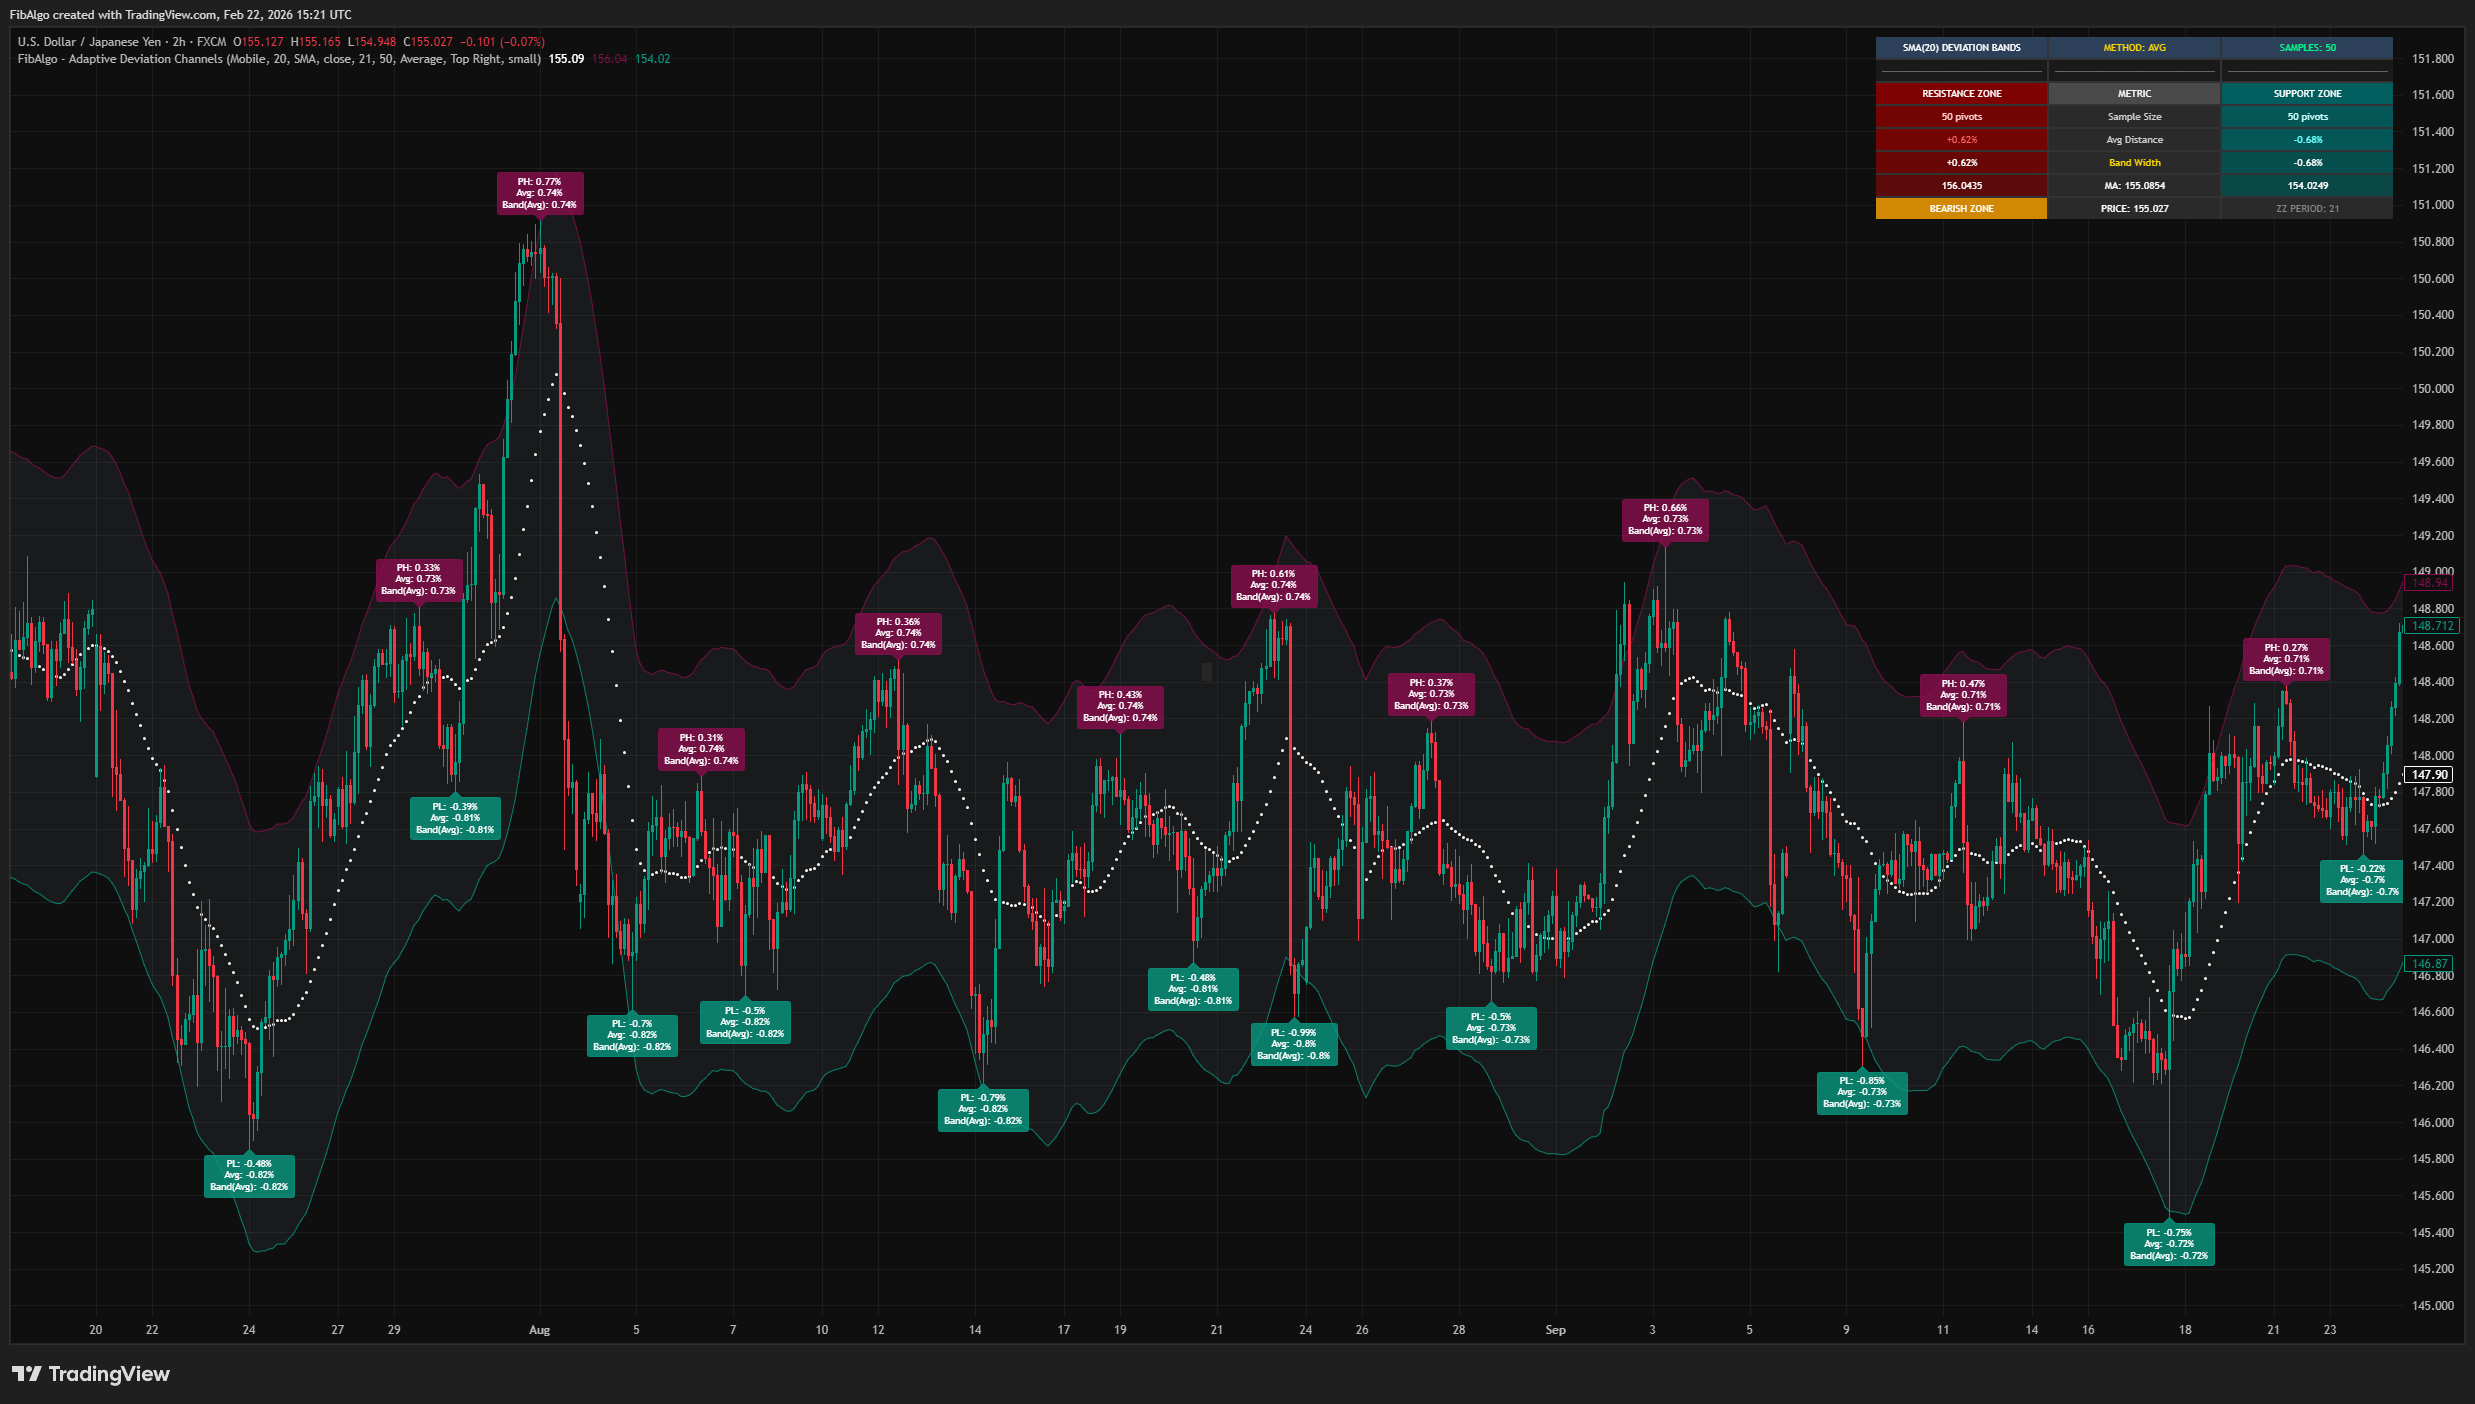
Step 2 — Pivot Detection
A zigzag algorithm with a configurable period identifies significant pivot highs and pivot lows in the price series. Each completed pivot is recorded with its price and bar index.
Step 3 — Deviation Collection
For each completed pivot, the indicator calculates the percentage distance between the pivot price and the moving average value at that pivot's bar. Pivot high deviations are stored separately from pivot low deviations, up to a configurable historical limit.
Step 4 — Band Calculation
The stored deviation percentages are processed using the selected method (Average, Standard Deviation, or Most Frequent) to produce a single representative value for each side. This percentage is applied to the current MA value to produce the upper and lower band prices.
Step 5 — Visualization
The moving average is plotted as the centerline, with upper (resistance) and lower (support) bands drawn from the calculated deviations. A filled zone between the bands provides visual context. An optional dashboard displays live statistics including sample sizes, average distances, band widths, and current price position relative to the bands.
Multiple Moving Average Types
- 10 moving average options: SMA, EMA, WMA, TMA, VIDYA, WWMA, ZLEMA, TSF, HMA, VWMA.
- Configurable period and price source.
Adaptive Deviation Bands
- Bands derived from actual pivot deviation statistics, not fixed multipliers.
- Three calculation methods: Average, Standard Deviation, Most Frequent.
- Asymmetric upper/lower bands calculated independently.
- Configurable historical pivot lookback (1–500).
Analysis Dashboard
- Live statistics: sample size, average distance, band width, MA price, band prices.
- Current price zone status indicator.
- Configurable position and text size.
Debug Mode
- Optional pivot labels showing individual deviation percentages.
- Per-pivot statistics including running averages and band values.
Alert System
- Upper Band Break Up — triggers when price crosses above the upper band.
- Upper Band Break Down — triggers when price returns below the upper band.
- Lower Band Break Down — triggers when price crosses below the lower band.
- Lower Band Break Up — triggers when price returns above the lower band.
- Each alert type can be toggled individually. Messages include ticker, timeframe, event type, and price.
Getting Started
Add the indicator to any chart. The default settings (SMA 20, PH/PL Period: 21, Historical Pivots: 50, Average method) provide a balanced starting point for most instruments on 4H to 1D timeframes.
Reading the Chart
- White dots (MA) = Central moving average baseline.
- Upper band (maroon) = Statistical resistance zone based on pivot high deviations.
- Lower band (teal) = Statistical support zone based on pivot low deviations.
- Filled zone = Area between the bands representing the normal deviation range.
- Dashboard = Live summary of sample sizes, distances, band widths, and price position.
Key Inputs
- MA Period: Controls the moving average smoothing length.
- MA Type: Select from 10 different moving average algorithms.
- PH/PL Period (2–200): Controls pivot detection sensitivity. Higher values detect major pivots, lower values detect minor swings.
- Historical Pivots (1–500): Number of past pivots used for deviation statistics.
- Band Calculation: Choose between Average, Standard Deviation, or Most Frequent.
- This indicator is a technical analysis tool, not a trading system. It does not generate buy/sell orders.
- Band accuracy depends on sufficient historical pivot data. With very few detected pivots, bands may not be statistically meaningful.
- The Most Frequent method uses histogram binning with 10 categories. Results may vary with different data distributions.
- Asymmetric bands reflect historical behavior. In rapidly changing market conditions, past deviation patterns may not persist.
- Volume-weighted moving average (VWMA) requires reliable volume data. On instruments with sparse volume, VWMA results may be less informative.
- Very low PH/PL Period values will detect many minor pivots and may produce narrow bands that reflect noise rather than significant levels.
The moving average implementations (VIDYA, WWMA, ZLEMA, TSF, HMA) follow standard technical analysis formulas. The pivot-based deviation measurement system, asymmetric band calculation from separate pivot high/low distributions, histogram-based most-frequent analysis, and the adaptive deviation channel framework are original contributions.