Overview
FibAlgo - Wyckoff Re-Accumulation & Re-Distribution automatically detects consolidation pauses within established trends and classifies them as continuation patterns (Re-Accumulation or Re-Distribution) or potential reversal warnings (Distribution or Accumulation). The indicator uses EMA-based trend detection, rolling price-range analysis for consolidation identification, and demand/supply volume profiling to differentiate between institutions pausing to add positions (stepping stones) versus genuine trend reversals. Wyckoff taught that trends rarely move in straight lines — markup phases produce Re-Accumulation trading ranges ("stepping stones") where the Composite Man acquires additional shares, while markdown phases produce Re-Distribution ranges where positions are extended. The volume behavior within these pauses is the key differentiator: in Re-Accumulation, volume diminishes on dips and increases on rallies; in Re-Distribution, the opposite occurs.
Key Concepts
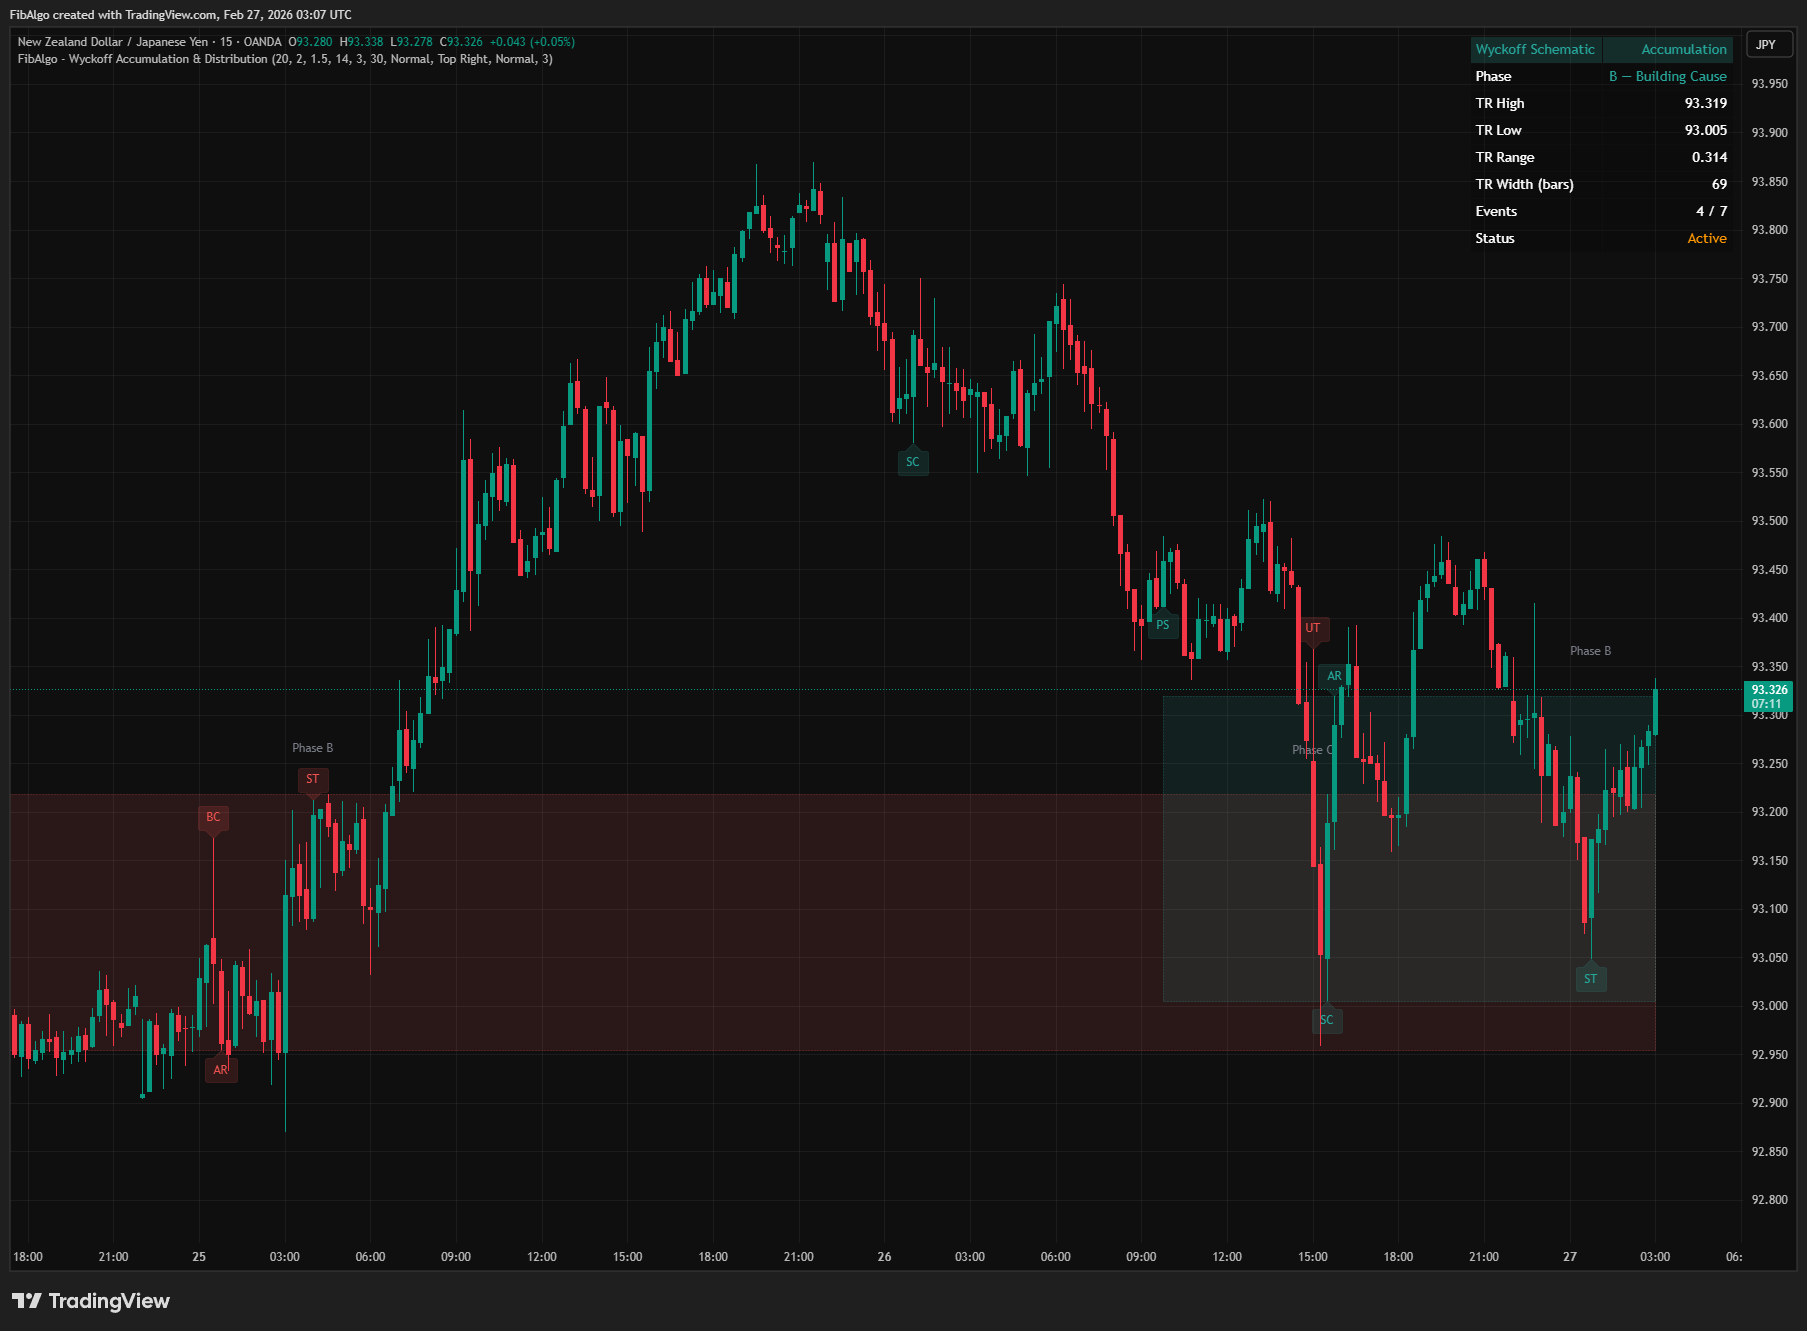
- Re-Accumulation (Stepping Stone) — A consolidation trading range that forms during a larger uptrend. The Composite Man takes profits and/or acquires additional shares before the next leg up. Volume diminishes on dips (supply absorbed) and increases on rallies (demand present). These pauses are "stepping stones" on the way to higher targets. Phase A may resemble distribution, but volume behavior reveals the true nature.
- Re-Distribution (Stepping Stone) — A consolidation trading range that forms during a larger downtrend. The Composite Man may add to short positions during the pause. Volume increases on declines (supply dominant) and diminishes on rallies (demand exhausted). These are "stepping stones" on the way to lower targets. Phase A may resemble accumulation, but feeble rallies and persistent supply reveal the continuation pattern.
- Demand/Supply Volume Ratio — The indicator classifies each bar within a consolidation zone as a demand bar (close > open, volume attributed to buying pressure) or supply bar (close < open, volume attributed to selling pressure). The ratio of total demand volume to supply volume reveals whether institutions are accumulating (ratio > 1.0) or distributing (ratio < 1.0) within the pause.
- Trend Context — The prior trend direction before consolidation is critical. An EMA crossover (fast above slow = uptrend, fast below slow = downtrend) establishes the context. A consolidation within an uptrend that breaks out upward with demand-dominant volume confirms Re-Accumulation. A consolidation within a downtrend that breaks out downward with supply-dominant volume confirms Re-Distribution.
- Breakout Classification — When price closes outside the consolidation range, the breakout direction combined with prior trend and volume profile produces one of four classifications: Re-Accumulation (uptrend + up breakout), Re-Distribution (downtrend + down breakout), Distribution Warning (uptrend + down breakout), or Accumulation Signal (downtrend + up breakout).
How It Works
1. Prior Trend Detection Two exponential moving averages (default EMA 20 and EMA 50) establish the trend context before each consolidation. The trend is assessed at the point where the consolidation begins:- Fast EMA above Slow EMA at consolidation start = prior uptrend context
- Fast EMA below Slow EMA at consolidation start = prior downtrend context
- The trend assessment uses the EMA values from the bar where the consolidation began, ensuring the classification reflects the actual trend state before the pause
- On each bar, the highest high and lowest low over the Min Consolidation Bars window (default 15) are calculated
- The range is expressed as a percentage of the mid-price: Range % = (Highest − Lowest) / Midpoint × 100
- When Range % first drops below the Max Range % threshold (default 6.0%), a consolidation zone is initiated
- The zone starts from the beginning of the detection window and tracks forward until breakout, timeout, or invalidation
- A cooldown period equal to Min Consolidation Bars prevents overlapping detections
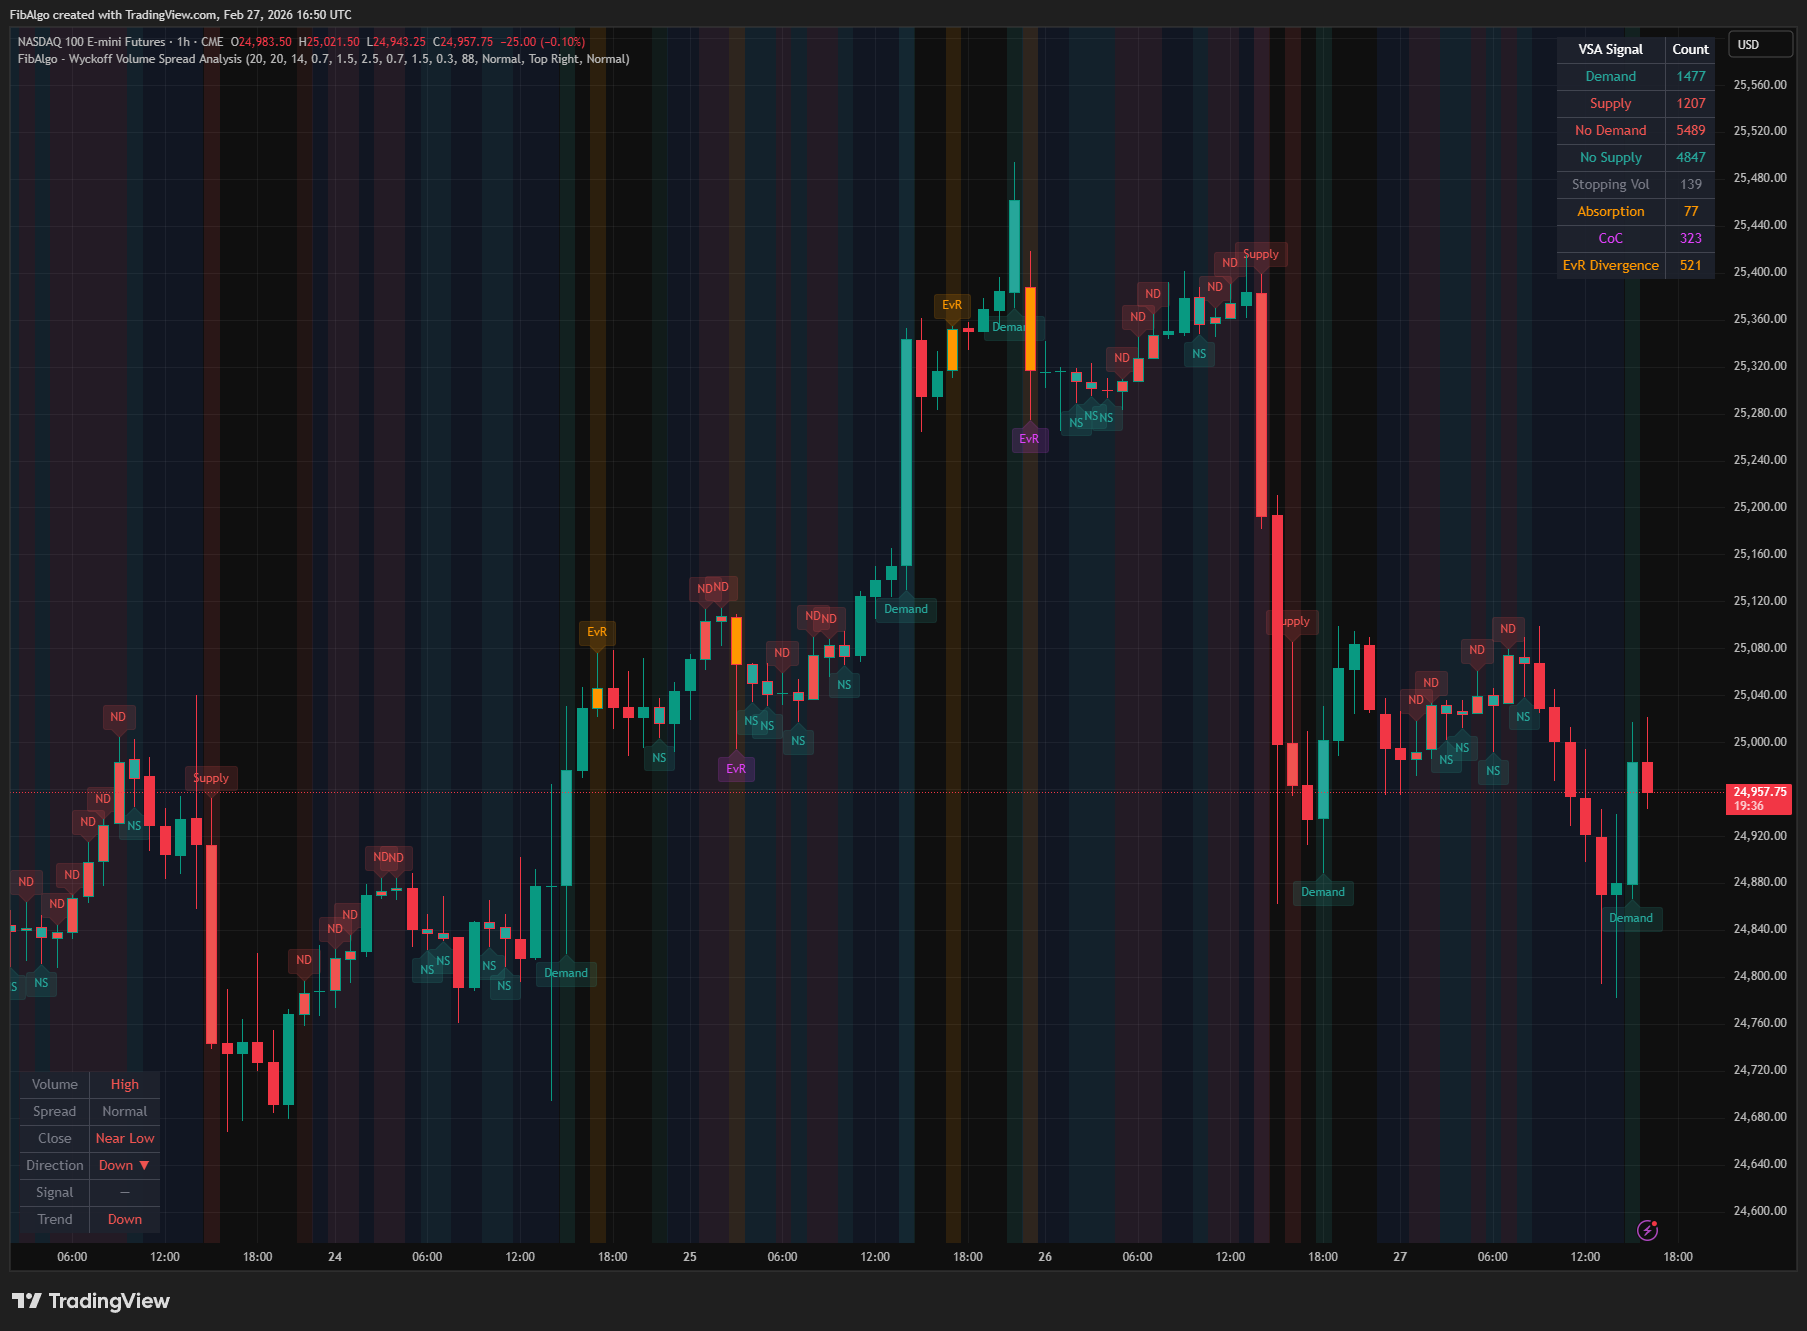
- Demand bars (close > open): volume is attributed to buying pressure
- Supply bars (close < open): volume is attributed to selling pressure
- Doji bars (close = open): excluded from the volume profile to avoid noise
- Volume D/S Ratio = Total Demand Volume / Total Supply Volume
- Ratio above 1.0 = Demand Dominant (buyers absorbing supply — bullish for continuation in uptrend)
- Ratio below 1.0 = Supply Dominant (sellers overwhelming demand — bearish for continuation in downtrend)
- The forming zone label and info table update in real-time as new bars arrive, showing the tentative classification
- Close above zone high = upward breakout
- Close below zone low = downward breakout
- Breakout volume strength is assessed by comparing the breakout bar's volume to the Volume MA × Breakout Volume Multiple (default 1.2×)
- Strong volume breakout = higher confidence confirmation; weak volume = lower confidence
- Final classification combines prior trend direction + breakout direction:
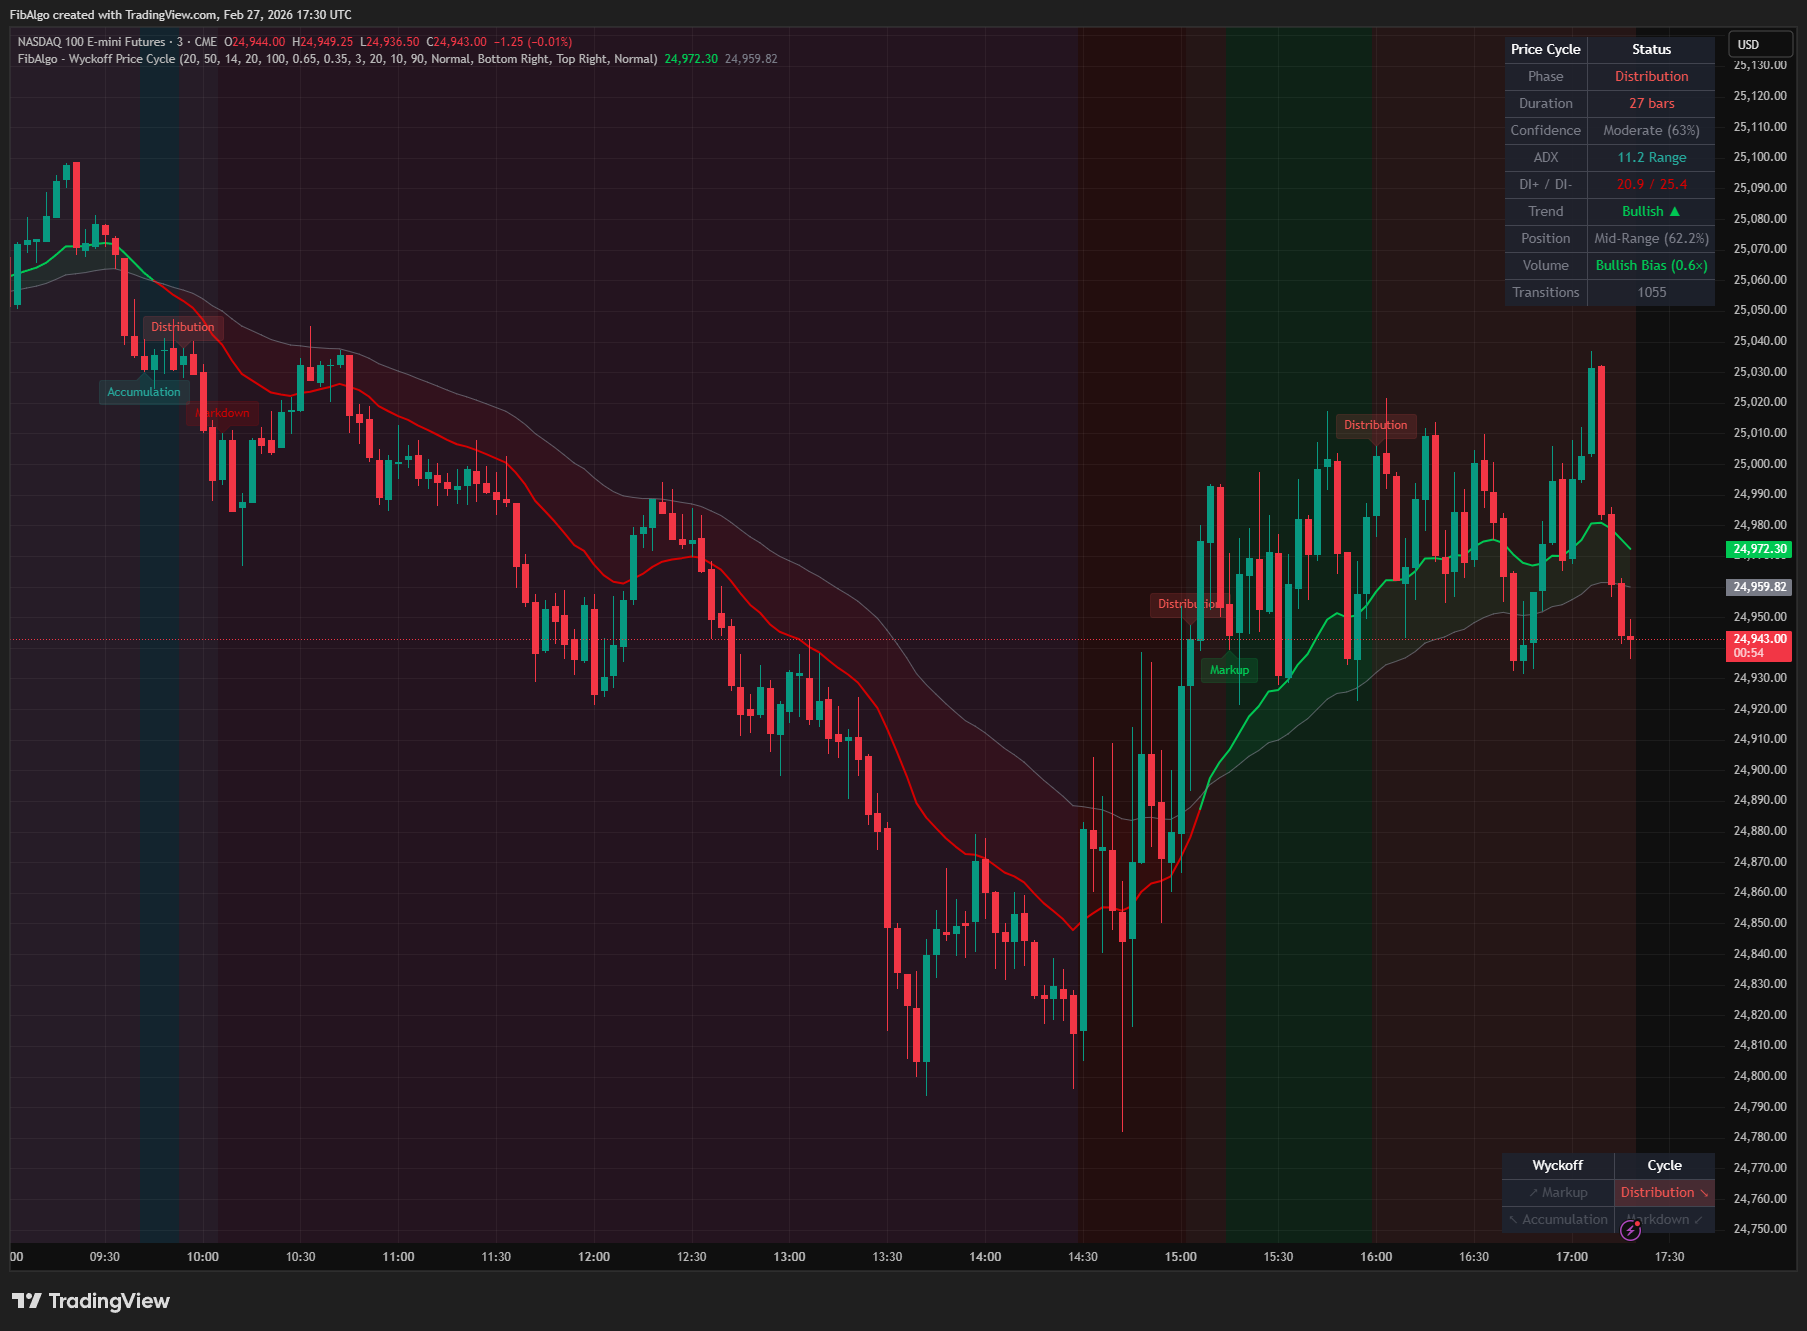
- Uptrend + Up breakout = Re-Accumulation (stepping stone confirmed)
- Downtrend + Down breakout = Re-Distribution (stepping stone confirmed)
- Uptrend + Down breakout = Distribution Warning (potential trend reversal)
- Downtrend + Up breakout = Accumulation Signal (potential trend reversal)
- Forming: zone is active, range and volume profile update each bar, tentative classification shown with "?" suffix
- Breakout: price closes outside the range — zone is completed and classified
- Timeout: if the consolidation exceeds Max Consolidation Bars (default 120), it is classified by volume profile alone without breakout confirmation
- Invalidation: if the range expands beyond 1.5× the Max Range % threshold, the zone is discarded as a false detection
- A cooldown period prevents immediate re-detection after a zone completes
Features
- Automatic Consolidation Detection — Uses rolling price-range analysis to detect when an established trend enters a tight consolidation zone, without requiring manual drawing or subjective analysis
- EMA-Based Trend Context — Dual EMA crossover (default 20/50) establishes whether the prior trend was up or down, providing the essential Wyckoff context for classifying the consolidation
- Demand/Supply Volume Profiling — Classifies volume within consolidation zones by comparing total demand-bar volume versus supply-bar volume, revealing whether institutions are accumulating or distributing during the pause
- Four-Way Zone Classification — Combines prior trend direction and breakout direction to classify zones as Re-Accumulation, Re-Distribution, Distribution Warning, or Accumulation Signal
- Real-Time Forming Zones — Active consolidations are drawn with dashed borders and shown with tentative classification ("Re-Acc ?", "Re-Dist ?") that updates as new volume data arrives, enabling traders to prepare before breakout
- Breakout Volume Strength — Each breakout is assessed for volume confirmation by comparing breakout bar volume against the average volume × a configurable multiplier, with "Strong Vol" or "Weak Vol" shown in tooltips
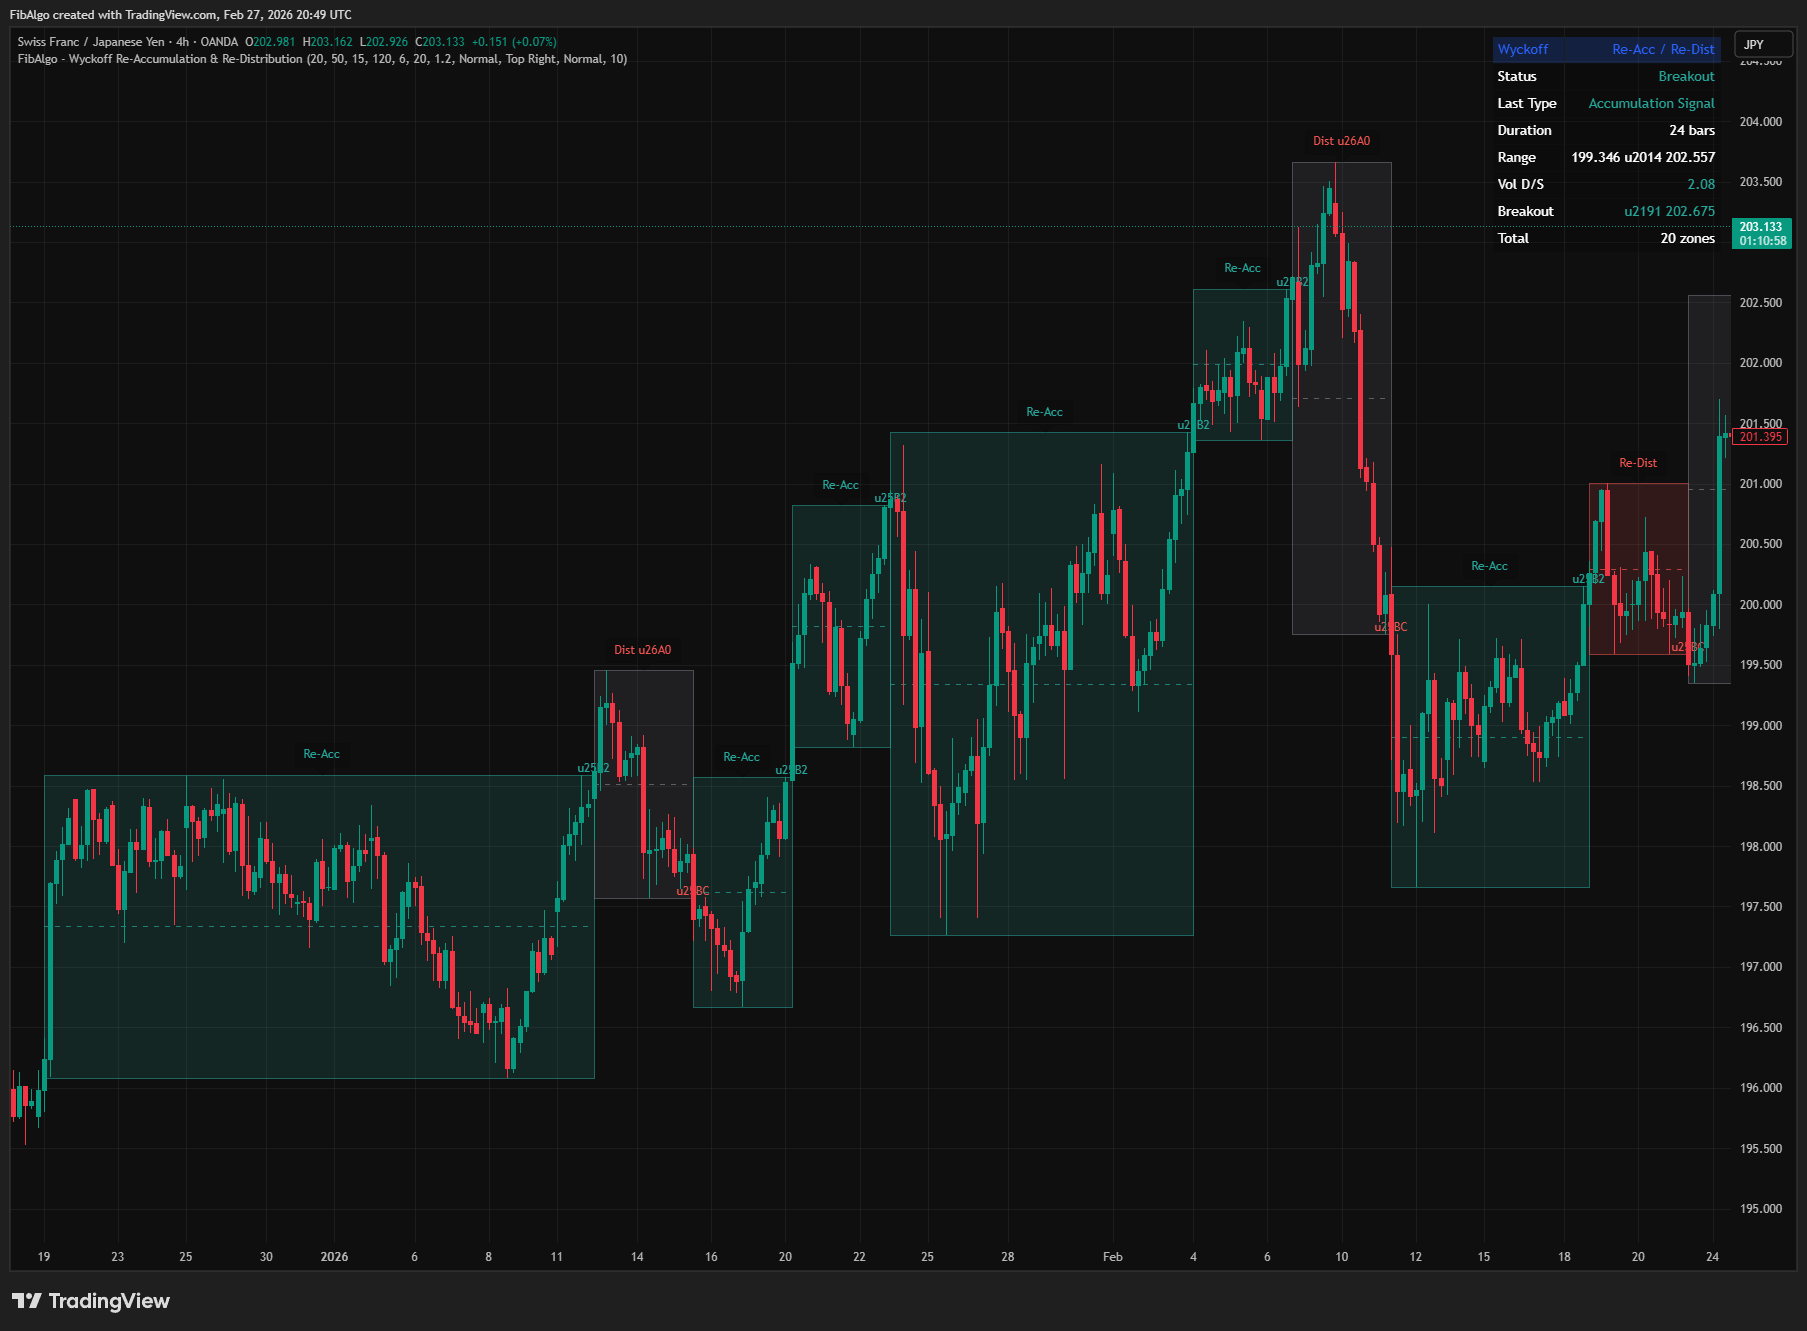
- Zone Boxes with Midline — Each consolidation zone is drawn as a colored box (green for Re-Acc, red for Re-Dist, gray for warnings/forming) with an optional dashed midline showing the range center
- Breakout Arrows — Optional triangle markers (▲ for upward, ▼ for downward) at the breakout bar provide instant visual identification of breakout direction
- Detailed Tooltips — Hovering over any zone label reveals comprehensive details including classification, prior trend, duration, exact range, volume D/S ratio, volume bias, breakout price, and breakout volume strength
- Range Expansion Invalidation — Zones that expand beyond 1.5× the Max Range % are automatically invalidated, preventing false consolidation detection in volatile conditions
- Max Zone Display Control — Configurable maximum number of displayed zones (default 5) keeps the chart clean while showing the most recent stepping stone patterns
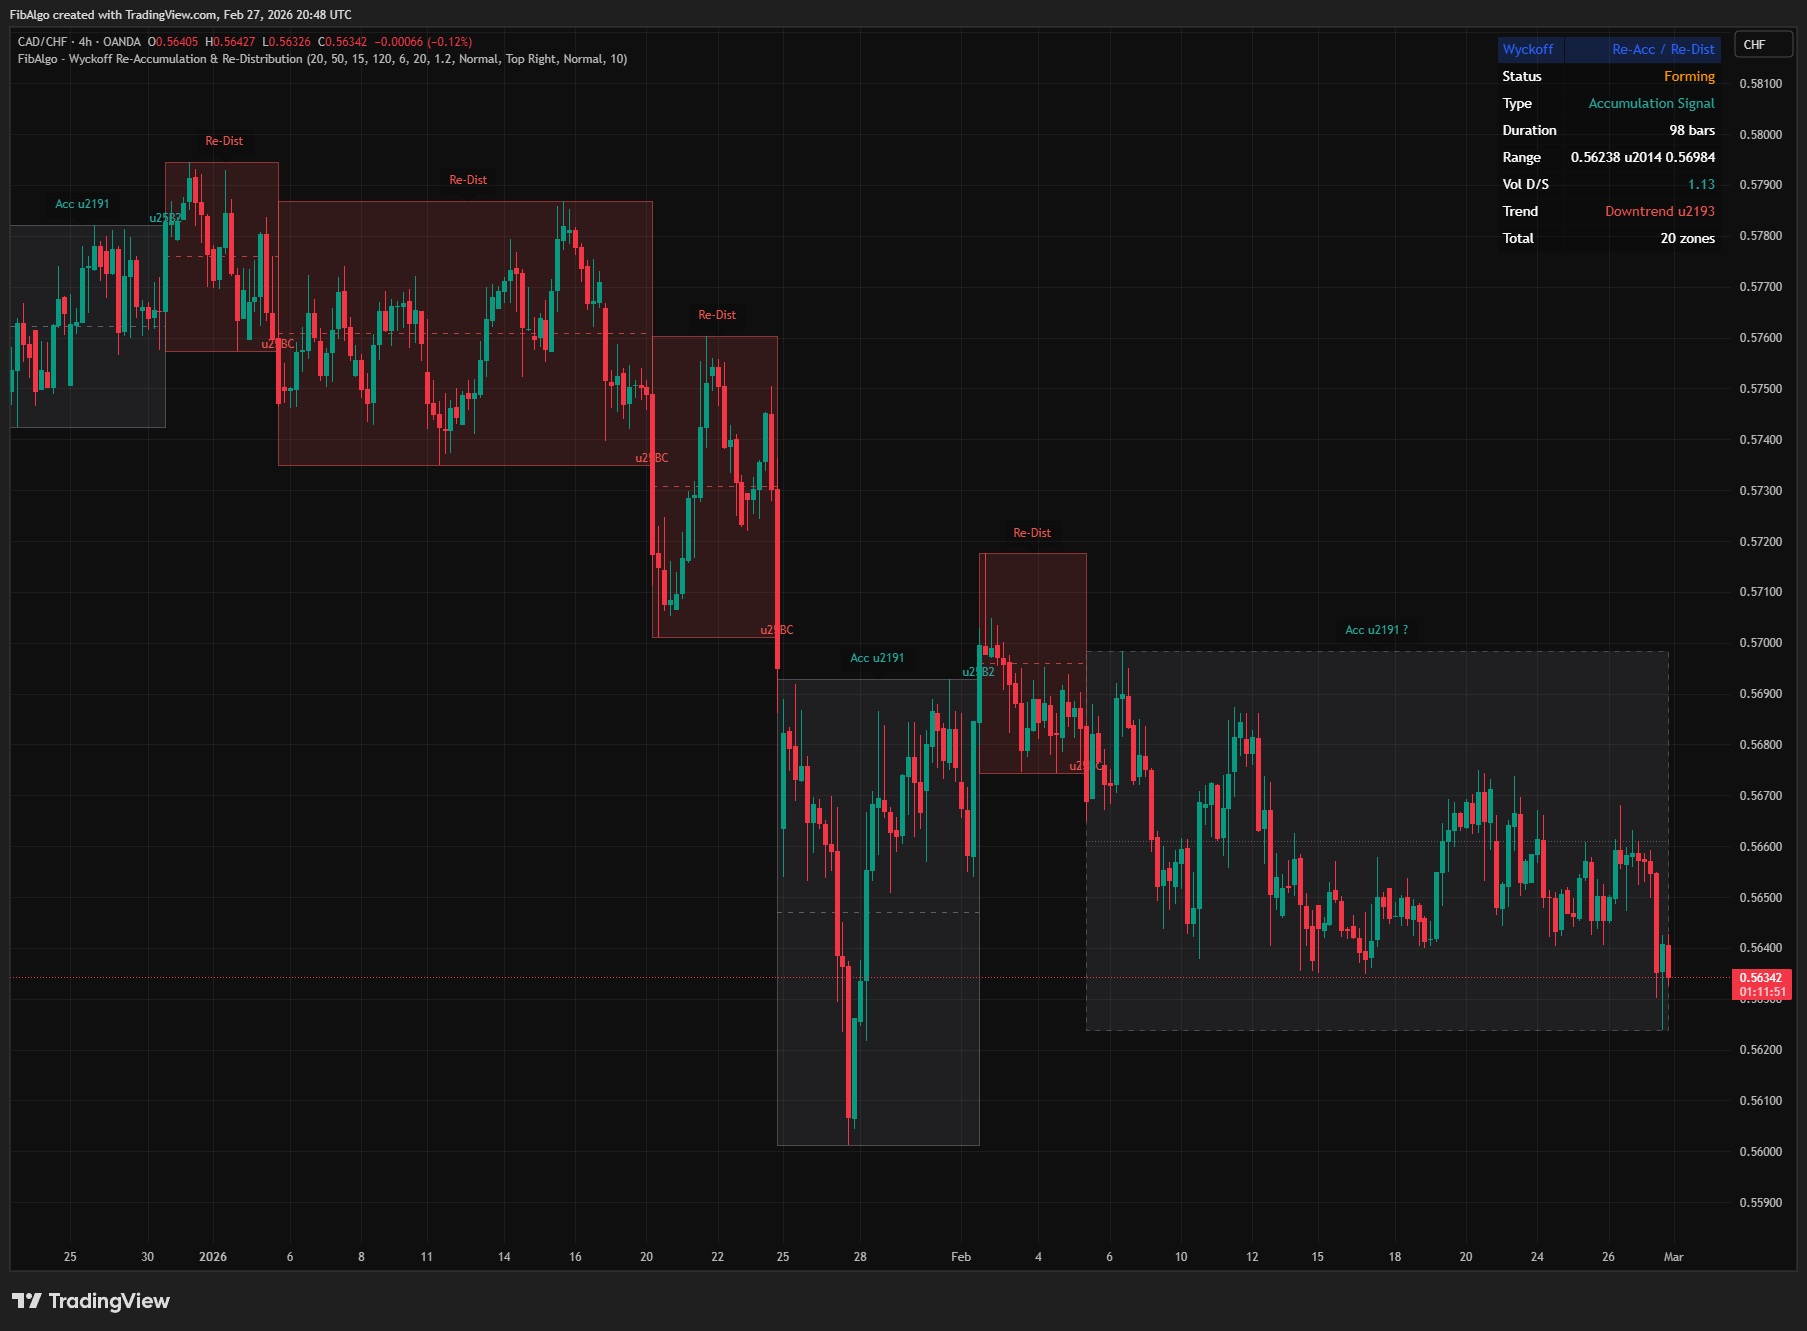
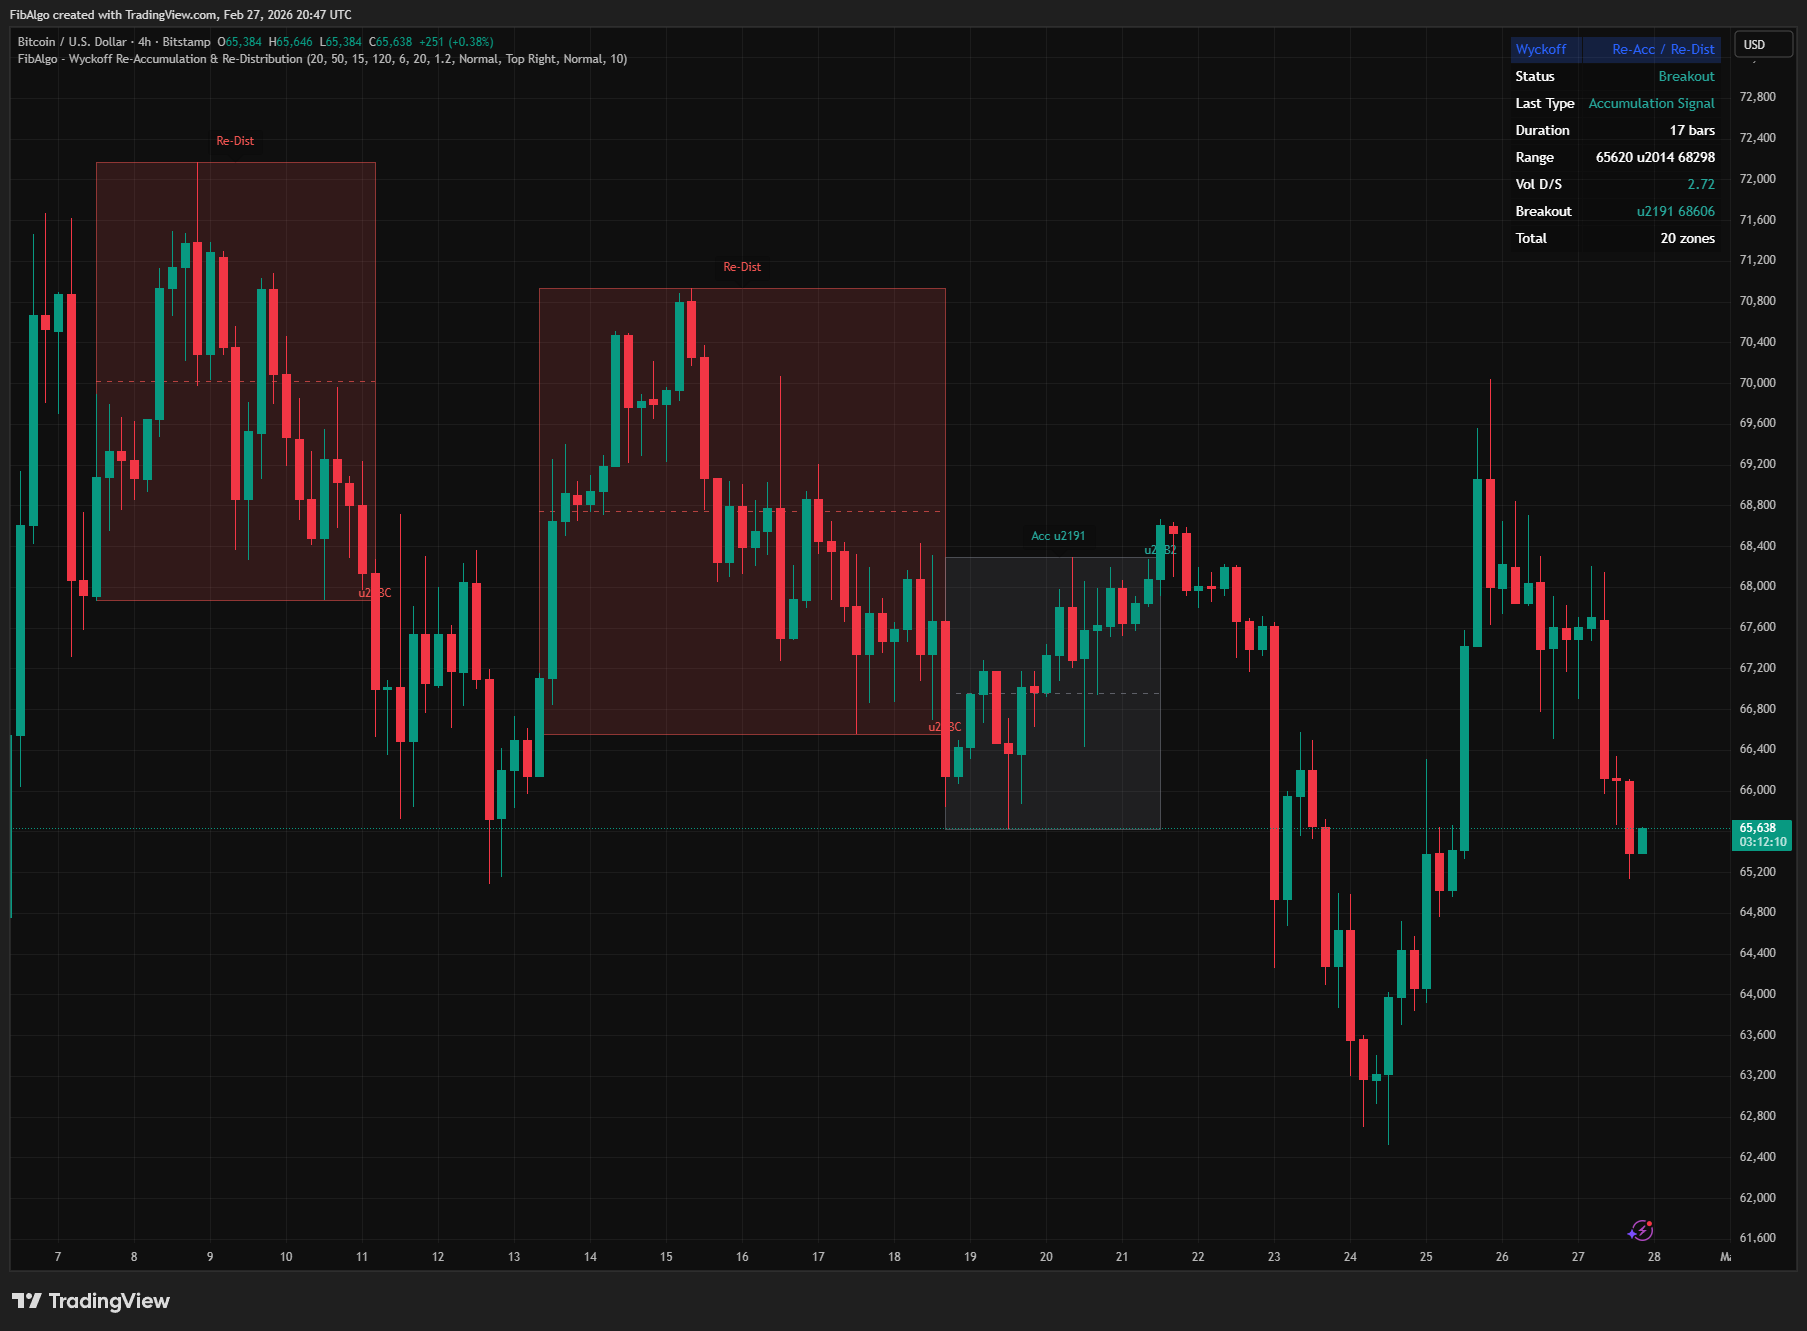
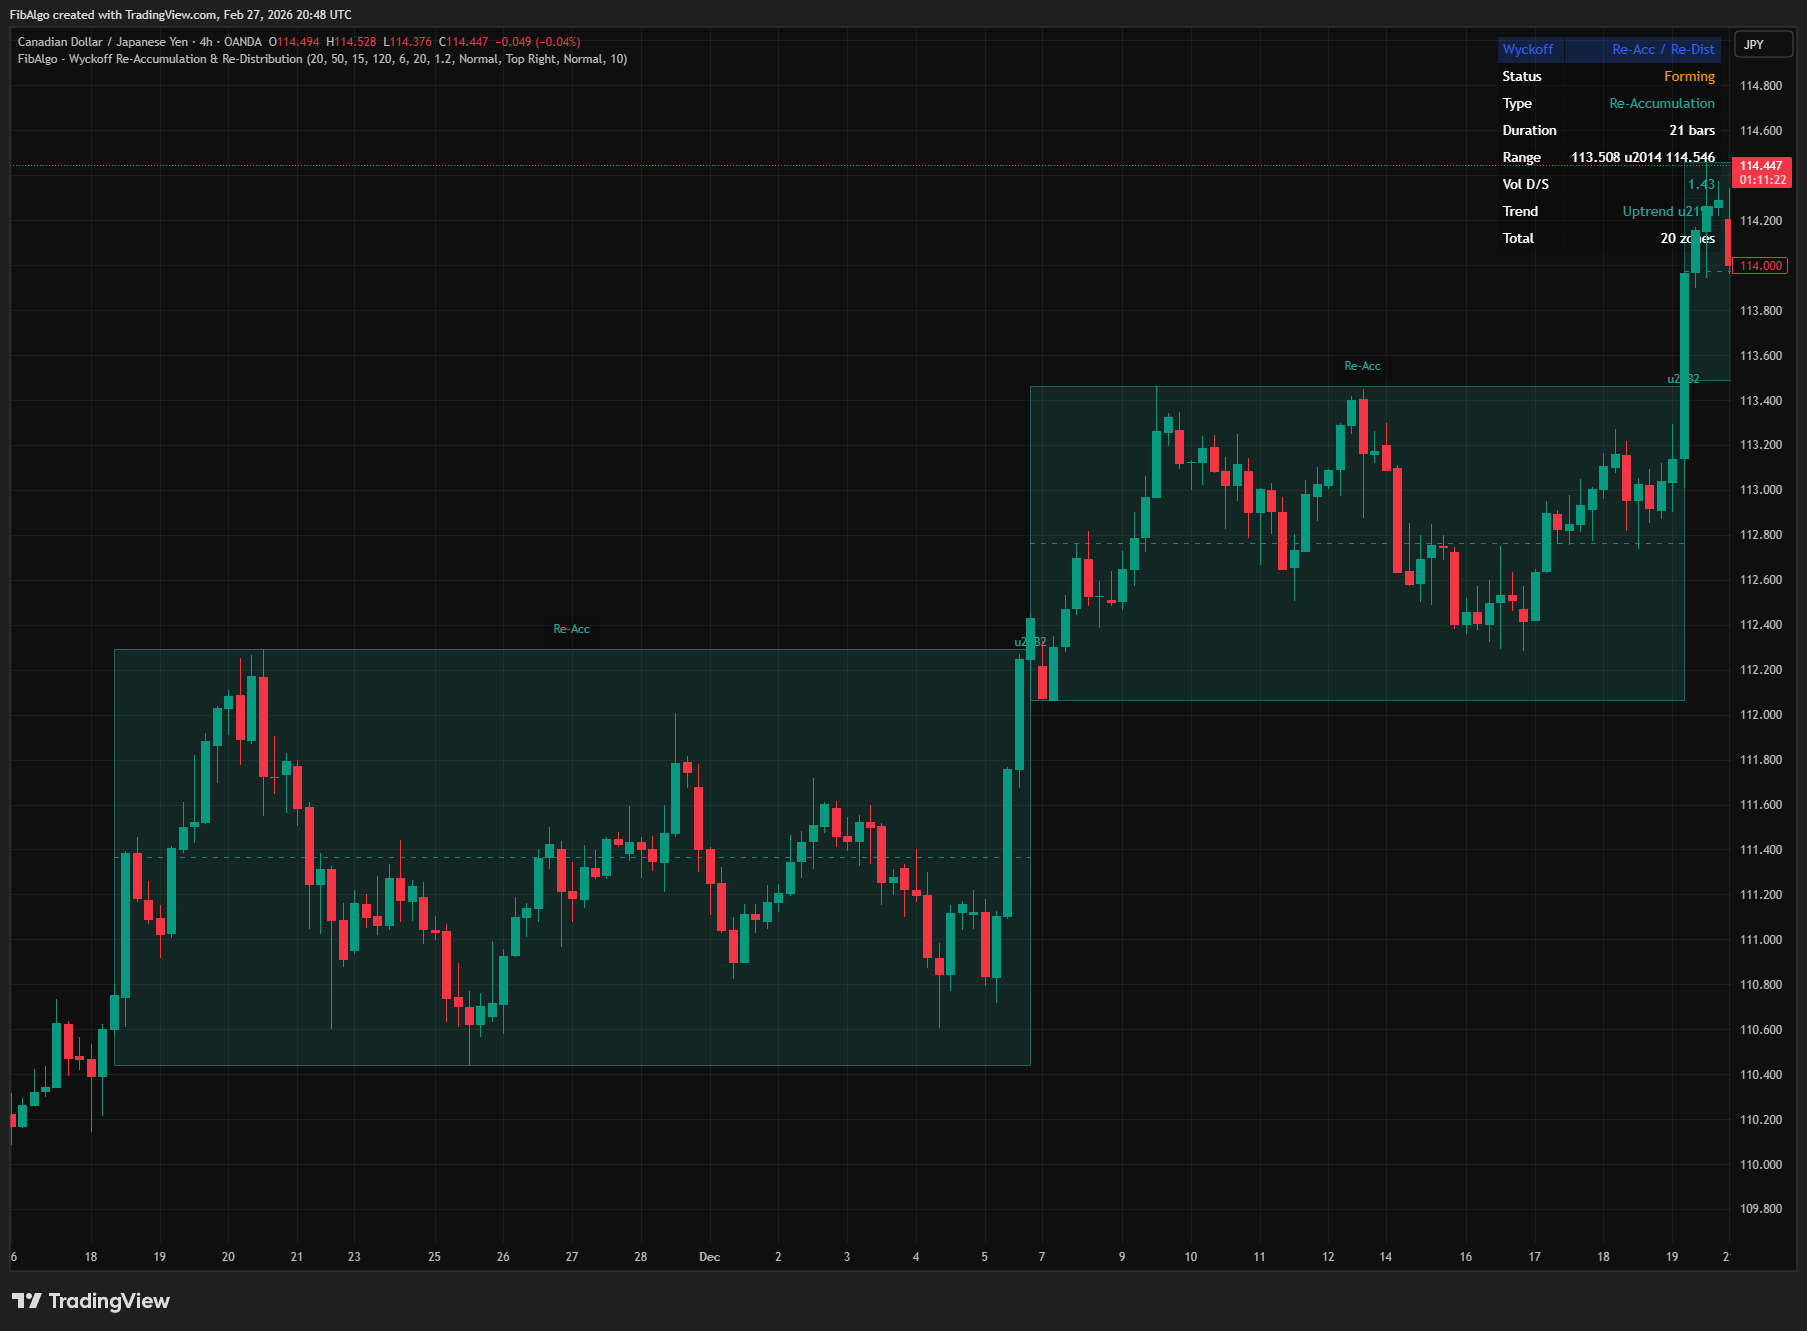
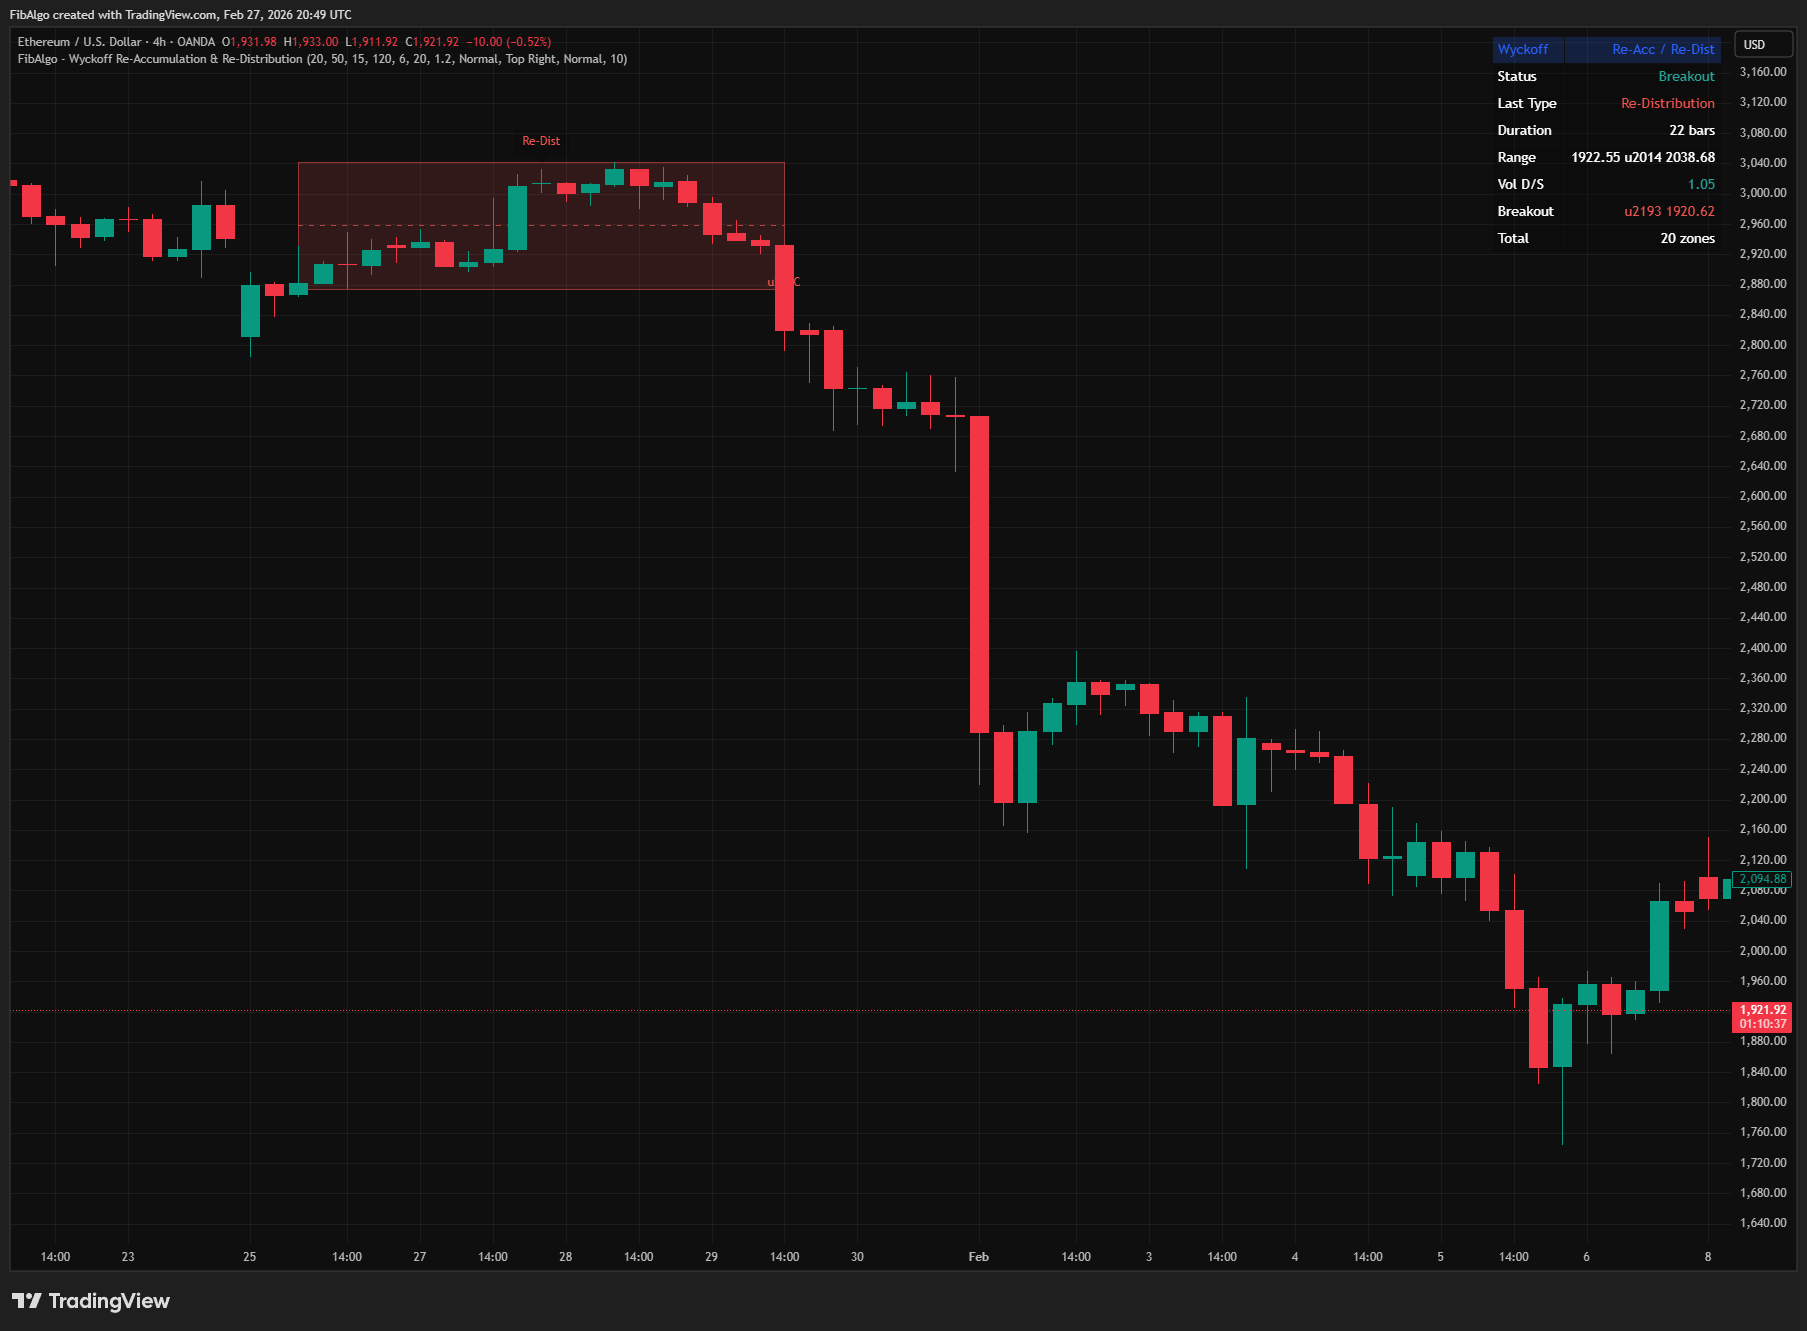
- Info Table (8 rows) — Real-time dashboard showing current status (Forming/Breakout/Timeout), zone type, duration, price range, volume D/S ratio, prior trend direction, and total zones detected
- Alert System — Three configurable alerts: Re-Accumulation identified, Re-Distribution identified, and generic Breakout from Stepping Stone, each including price level in the alert message
How to Use
- Add the indicator to your chart. It overlays colored boxes on consolidation zones detected within established trends.
- Look for green Re-Acc boxes during uptrends — these are Wyckoff "stepping stones" where the Composite Man is likely adding to positions before the next markup leg. The volume D/S ratio should be above 1.0 (demand dominant).
- Look for red Re-Dist boxes during downtrends — these are stepping stones where the Composite Man may be adding to short positions before the next markdown leg. The volume D/S ratio should be below 1.0 (supply dominant).
- Pay attention to forming zones (dashed borders with "?" suffix). If the volume profile matches the expected pattern for the trend, prepare for a breakout in the trend direction.
- When a Distribution Warning appears (gray box in an uptrend with down breakout), this signals a potential trend reversal — the consolidation was not Re-Accumulation but rather genuine Distribution. Consider reducing long exposure.
- When an Accumulation Signal appears (gray box in a downtrend with up breakout), this signals a potential trend reversal — the consolidation was not Re-Distribution but perhaps the start of genuine Accumulation.
- Check the Volume D/S ratio in the tooltip or info table. Values above 1.2 indicate strong demand dominance; below 0.8 indicate strong supply dominance. Values near 1.0 are neutral and less conclusive.
- Use the Breakout Volume Strength indicator in tooltips: "Strong Vol" breakouts have higher follow-through probability than "Weak Vol" breakouts according to Wyckoff methodology.
- Combine with Accumulation & Distribution (#1) for phase identification, SOS & SOW (#6) for demand/supply events within the range, and VSA (#3) for detailed bar-by-bar volume analysis.
- Adjust Max Range % for different instruments: tighter ranges (3-4%) for forex or large-cap stocks, wider ranges (8-12%) for crypto or small-cap stocks with higher volatility.
- Adjust Min Consolidation Bars based on timeframe: shorter (8-12) for intraday charts, longer (20-30) for weekly charts.
Limitations
- This indicator does not generate buy or sell signals. It identifies consolidation patterns within trends and classifies them based on Wyckoff methodology for educational and analytical purposes.
- Consolidation detection uses a rolling price-range method, which is a simplified approximation of Wyckoff's trading range identification. Real-world trading ranges may have complex internal structures (springs, upthrusts, secondary tests) that this indicator does not individually identify — use the Accumulation & Distribution indicator (#1) for detailed event detection.
- The volume D/S ratio uses a simple close-above-open / close-below-open classification. In markets with frequent doji bars, the volume profile may exclude a significant portion of the total volume.
- The EMA crossover for trend detection is a lagging indicator. In choppy or transitional markets, the trend classification may not accurately reflect the true market condition at consolidation start.
- Very tight Max Range % values (below 2%) may produce few or no detections on volatile instruments. Very wide values (above 15%) may classify trending moves as consolidations. Adjust based on instrument volatility.
- Timeout zones (exceeding Max Consolidation Bars) are classified by volume profile only without breakout confirmation, making them less reliable than breakout-confirmed zones.
- Past consolidation patterns do not guarantee future trend continuation. A Re-Accumulation classification can still fail if broader market conditions change.