Overview
FibAlgo - R:R Trading System is a volatility-adaptive support and resistance indicator with a fully automated Risk:Reward management engine. It builds dynamic S/R levels from volatility-buffered swing extremes, classifies each breakout by the prevailing volatility regime (Strong / Normal / Low), highlights pullback (retracement) entry zones, and automatically frames a complete R:R setup — entry, stop, and target — that it tracks to completion.
As setups resolve, a live performance panel tallies net R, win rate, and an estimated dollar result, turning raw price action into a structured, repeatable trade-management workflow. It does not place orders or guarantee outcomes; it is a visual framing and analysis tool.
Volatility-Adaptive Support and Resistance
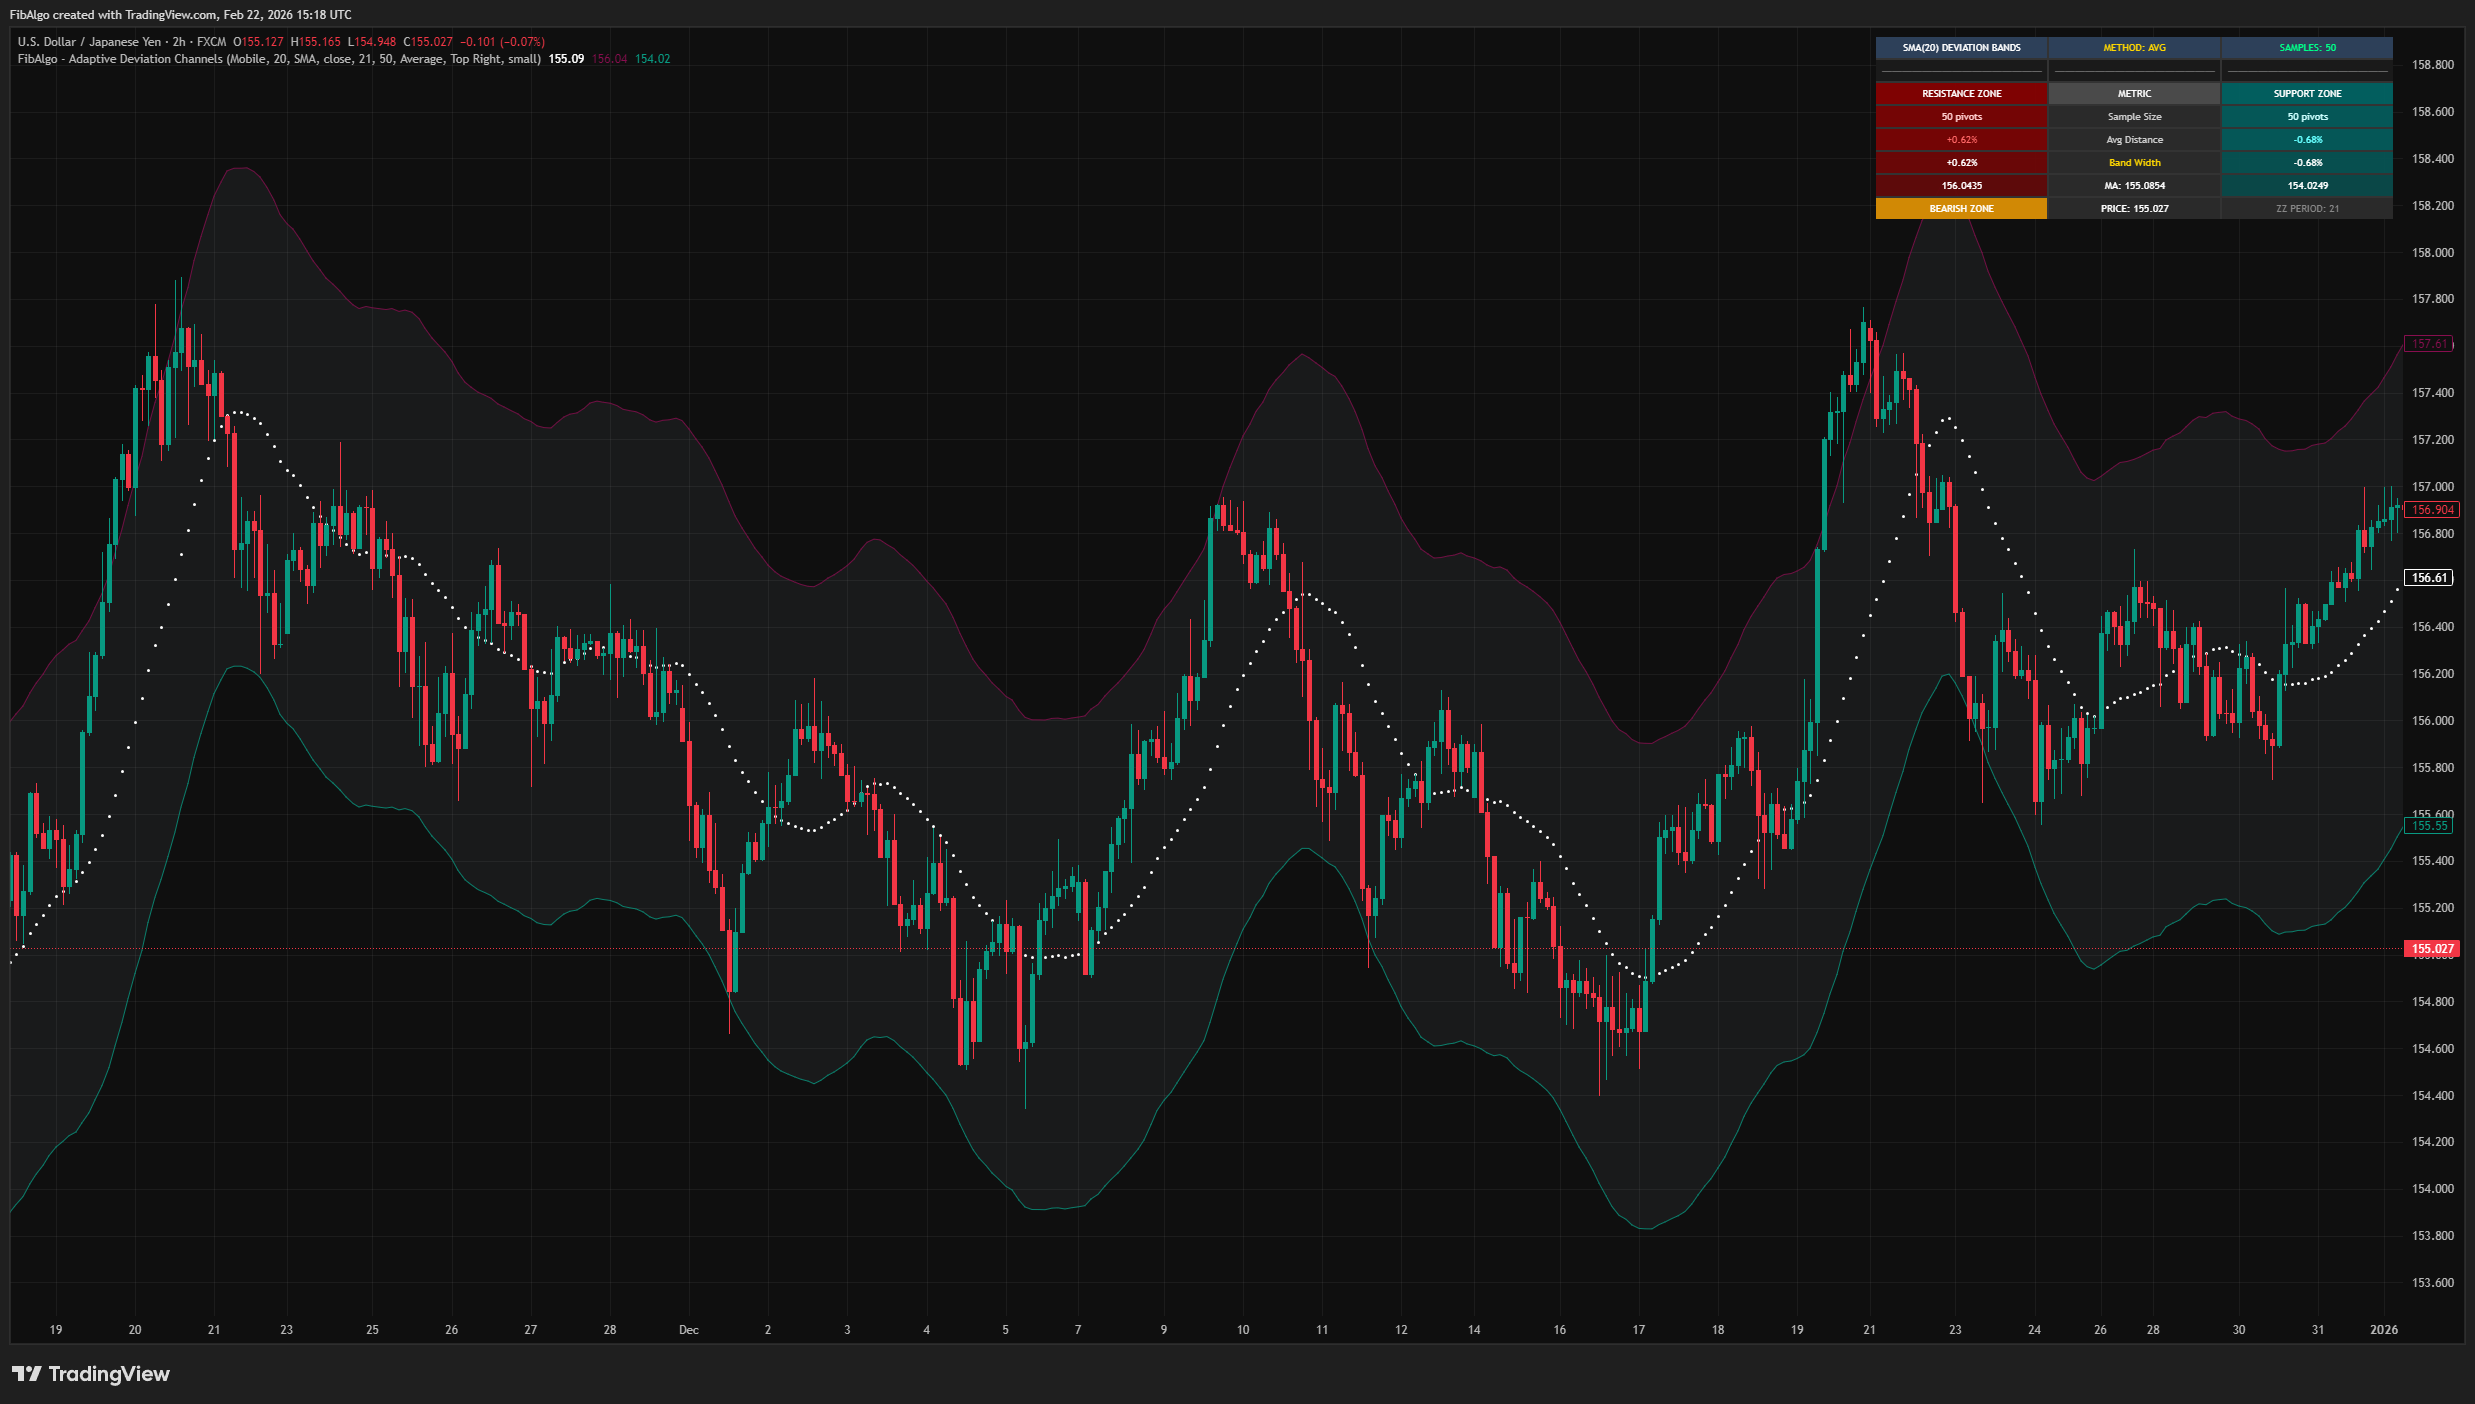
Price is segmented into "high periods" and "low periods" using Supertrend-derived volatility bands (based on the Supertrend concept by Olivier Seban). Within each period the indicator tracks the running extreme together with the volatility present at that extreme, then places the S/R level at the extreme plus (resistance) or minus (support) a volatility buffer. The buffer is derived from the standard deviation of close, scaled by a user sensitivity, so levels expand in volatile markets and contract in calm ones.
Breakout Strength Classification
When price closes beyond an S/R level, the current volatility is compared to a rolling 50-bar baseline and the breakout is sorted into one of three tiers:
- Strong Break — volatility exceeds 1.4x the baseline, signalling high conviction.
- Break (Normal) — volatility sits in the normal range.
- Low Break — volatility is below 0.7x the baseline, indicating weak momentum.
Retracement Entry Zones
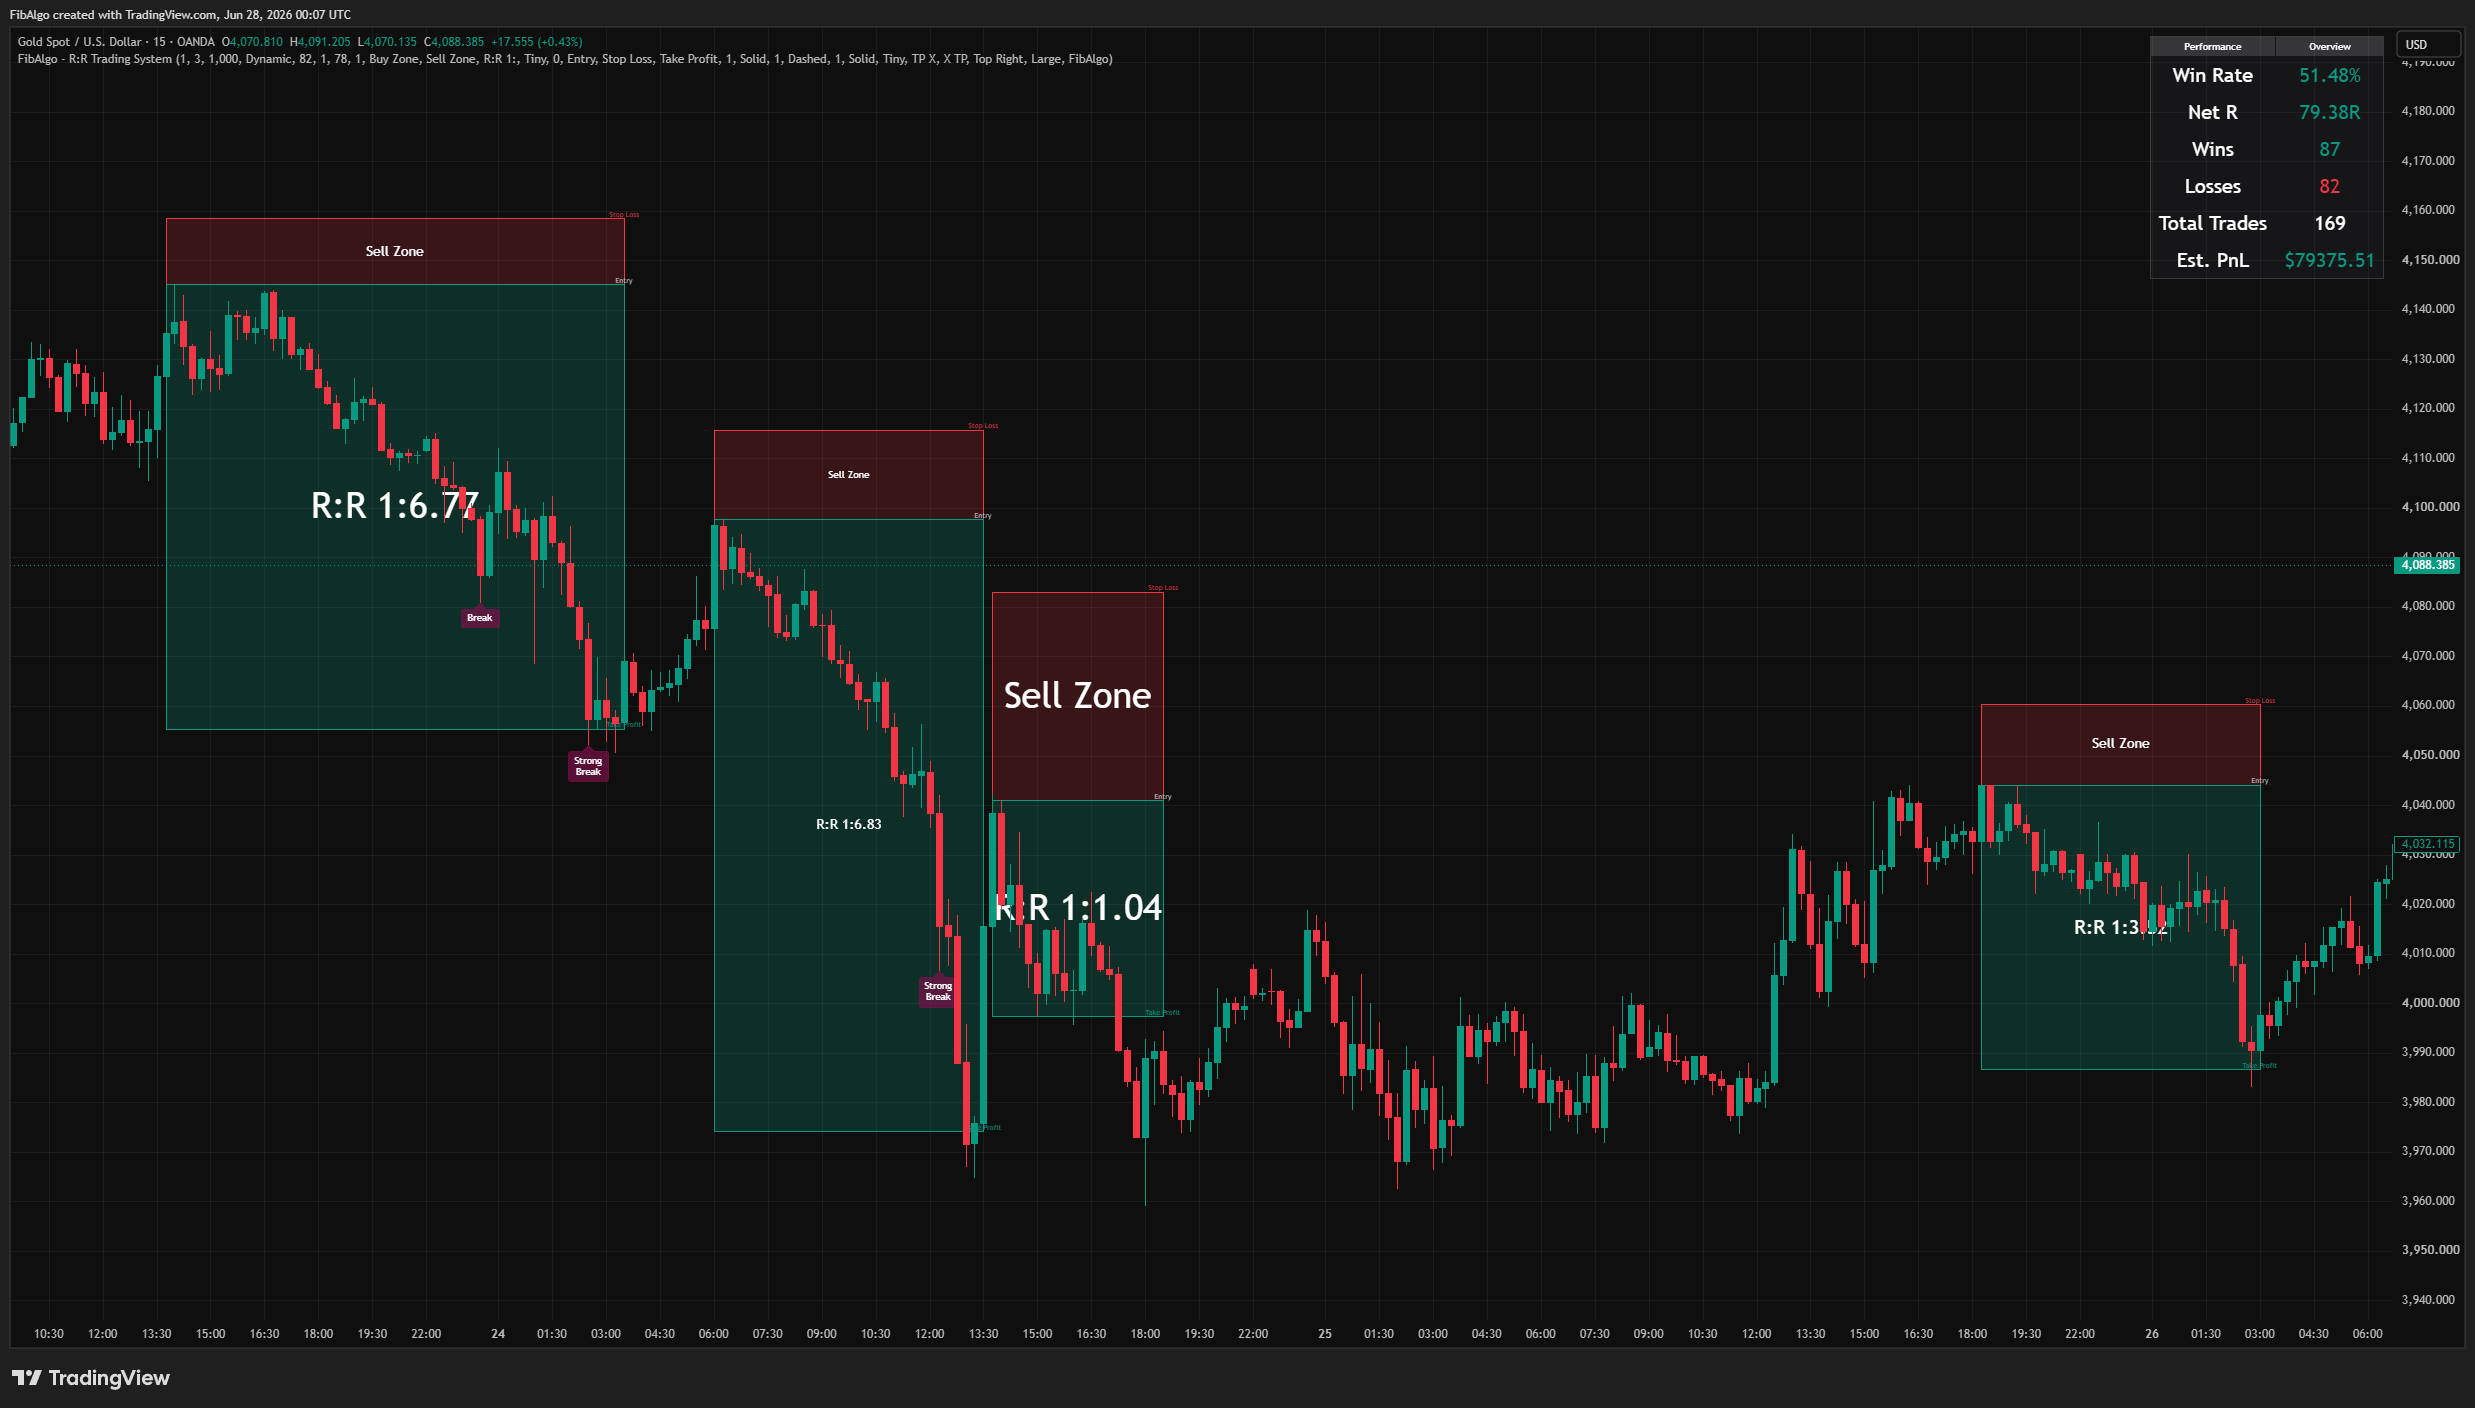
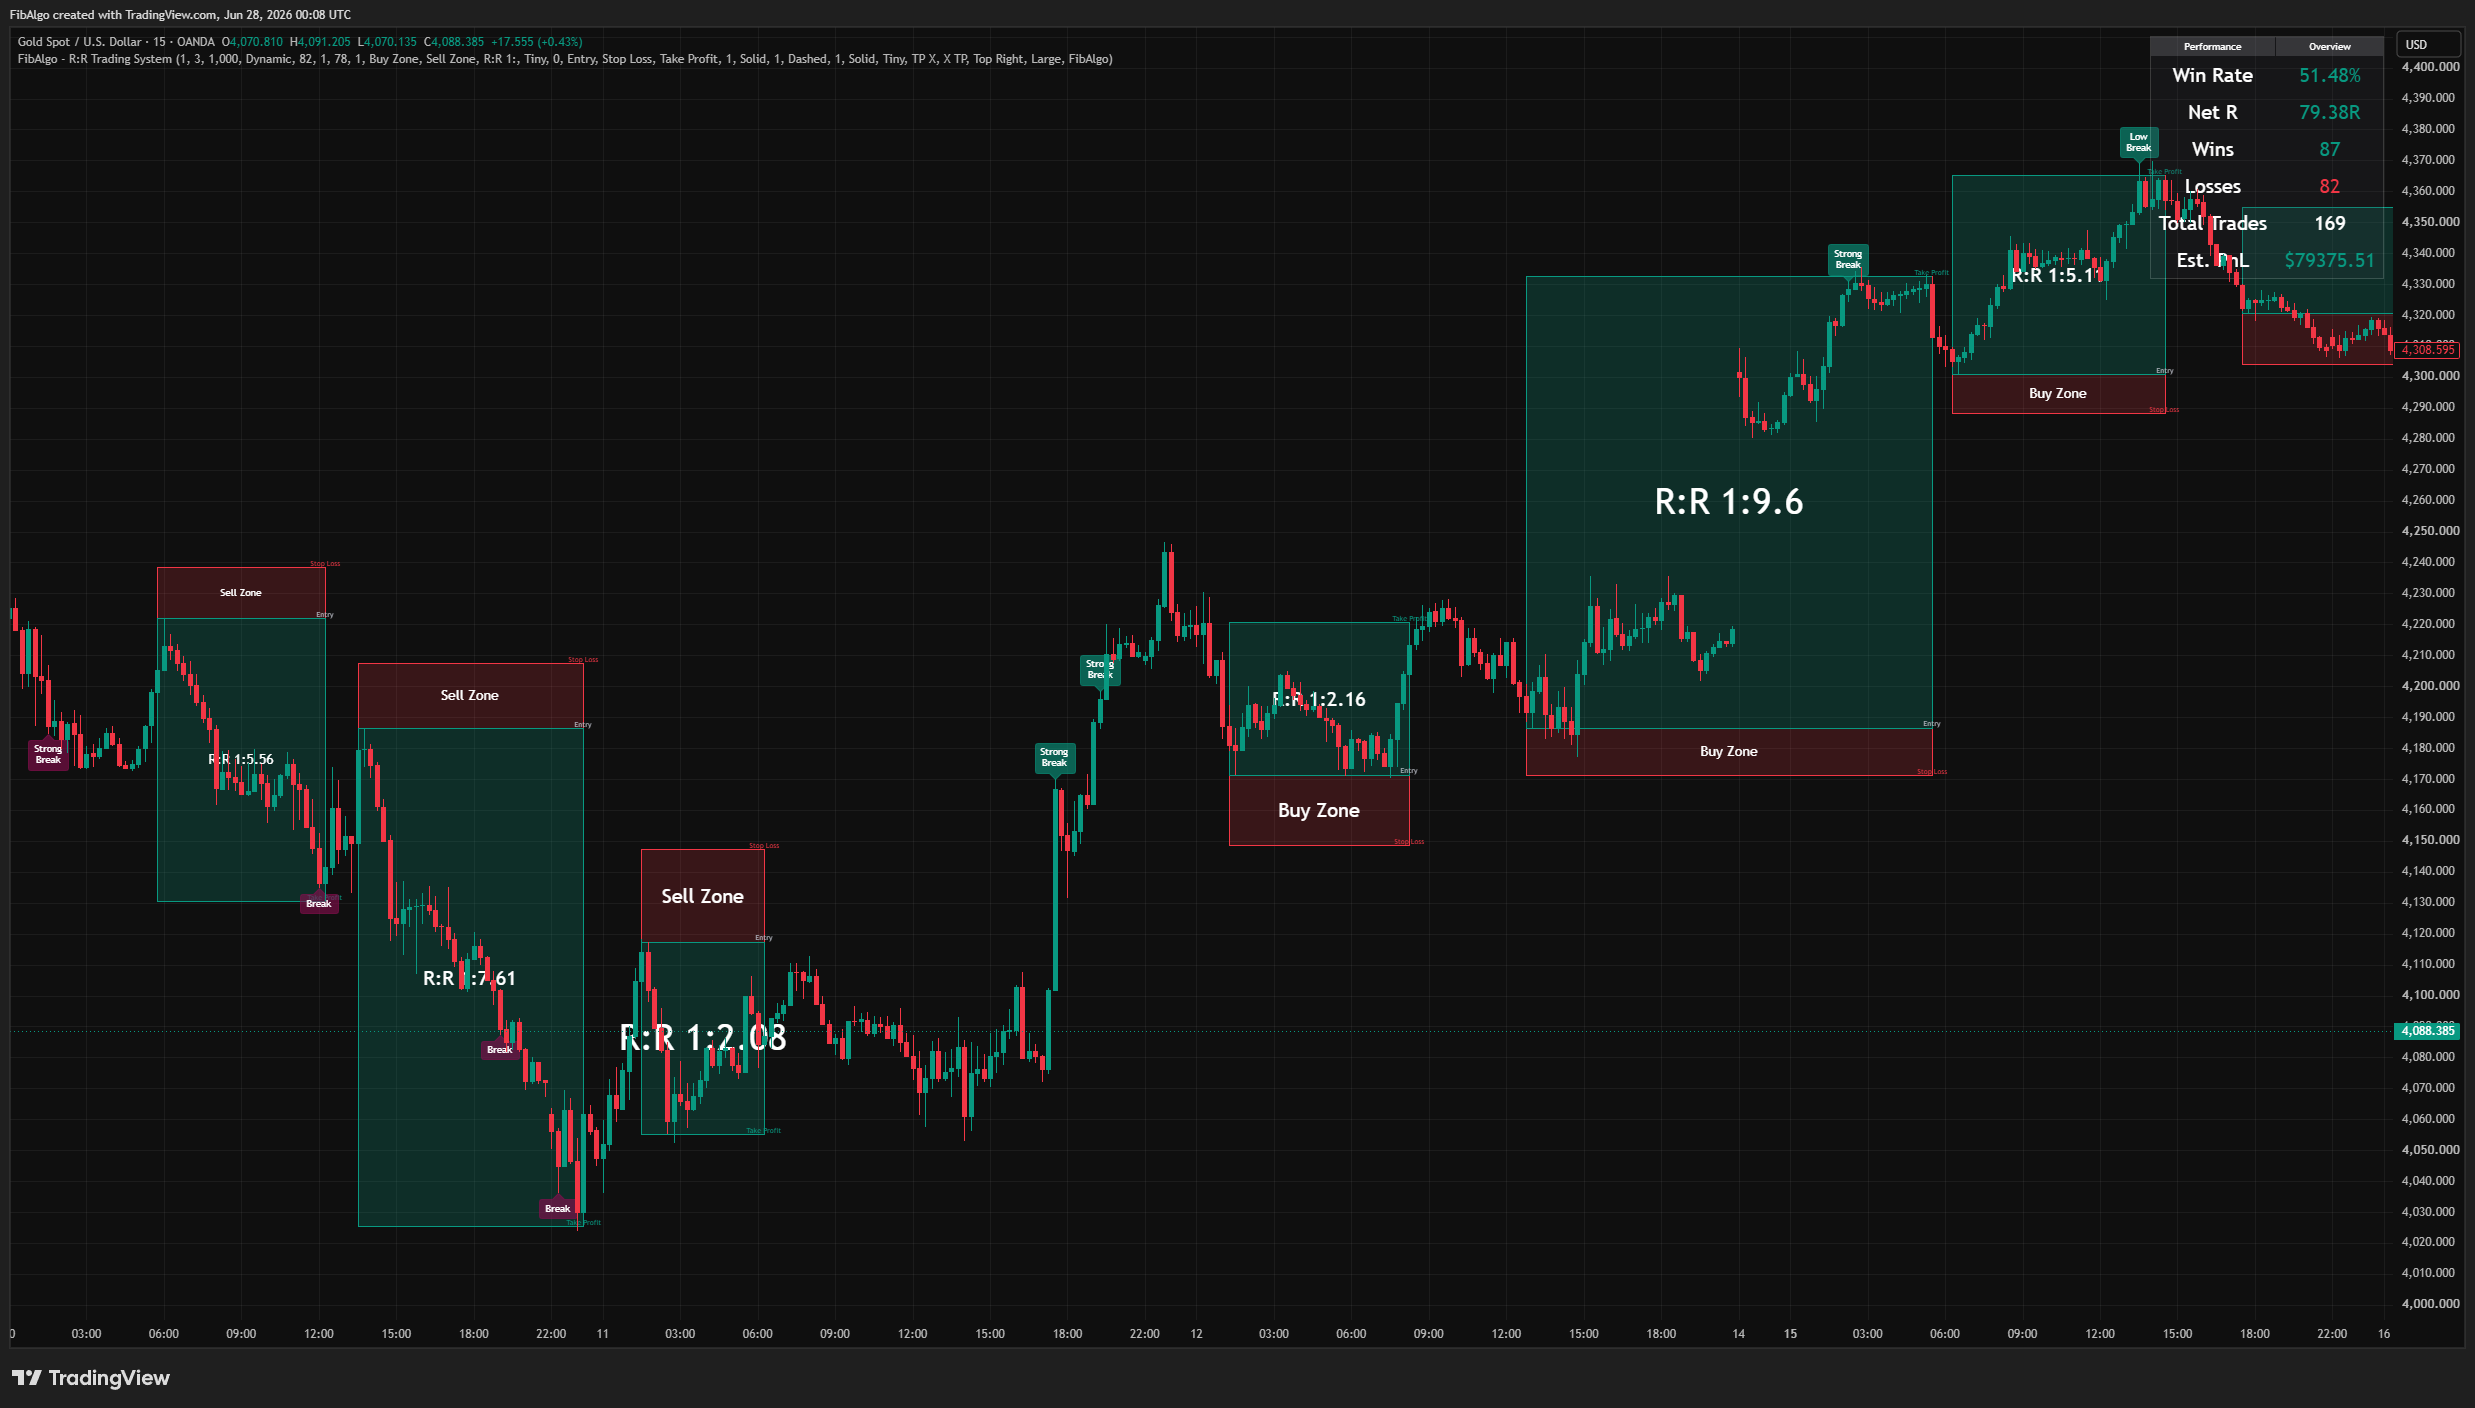
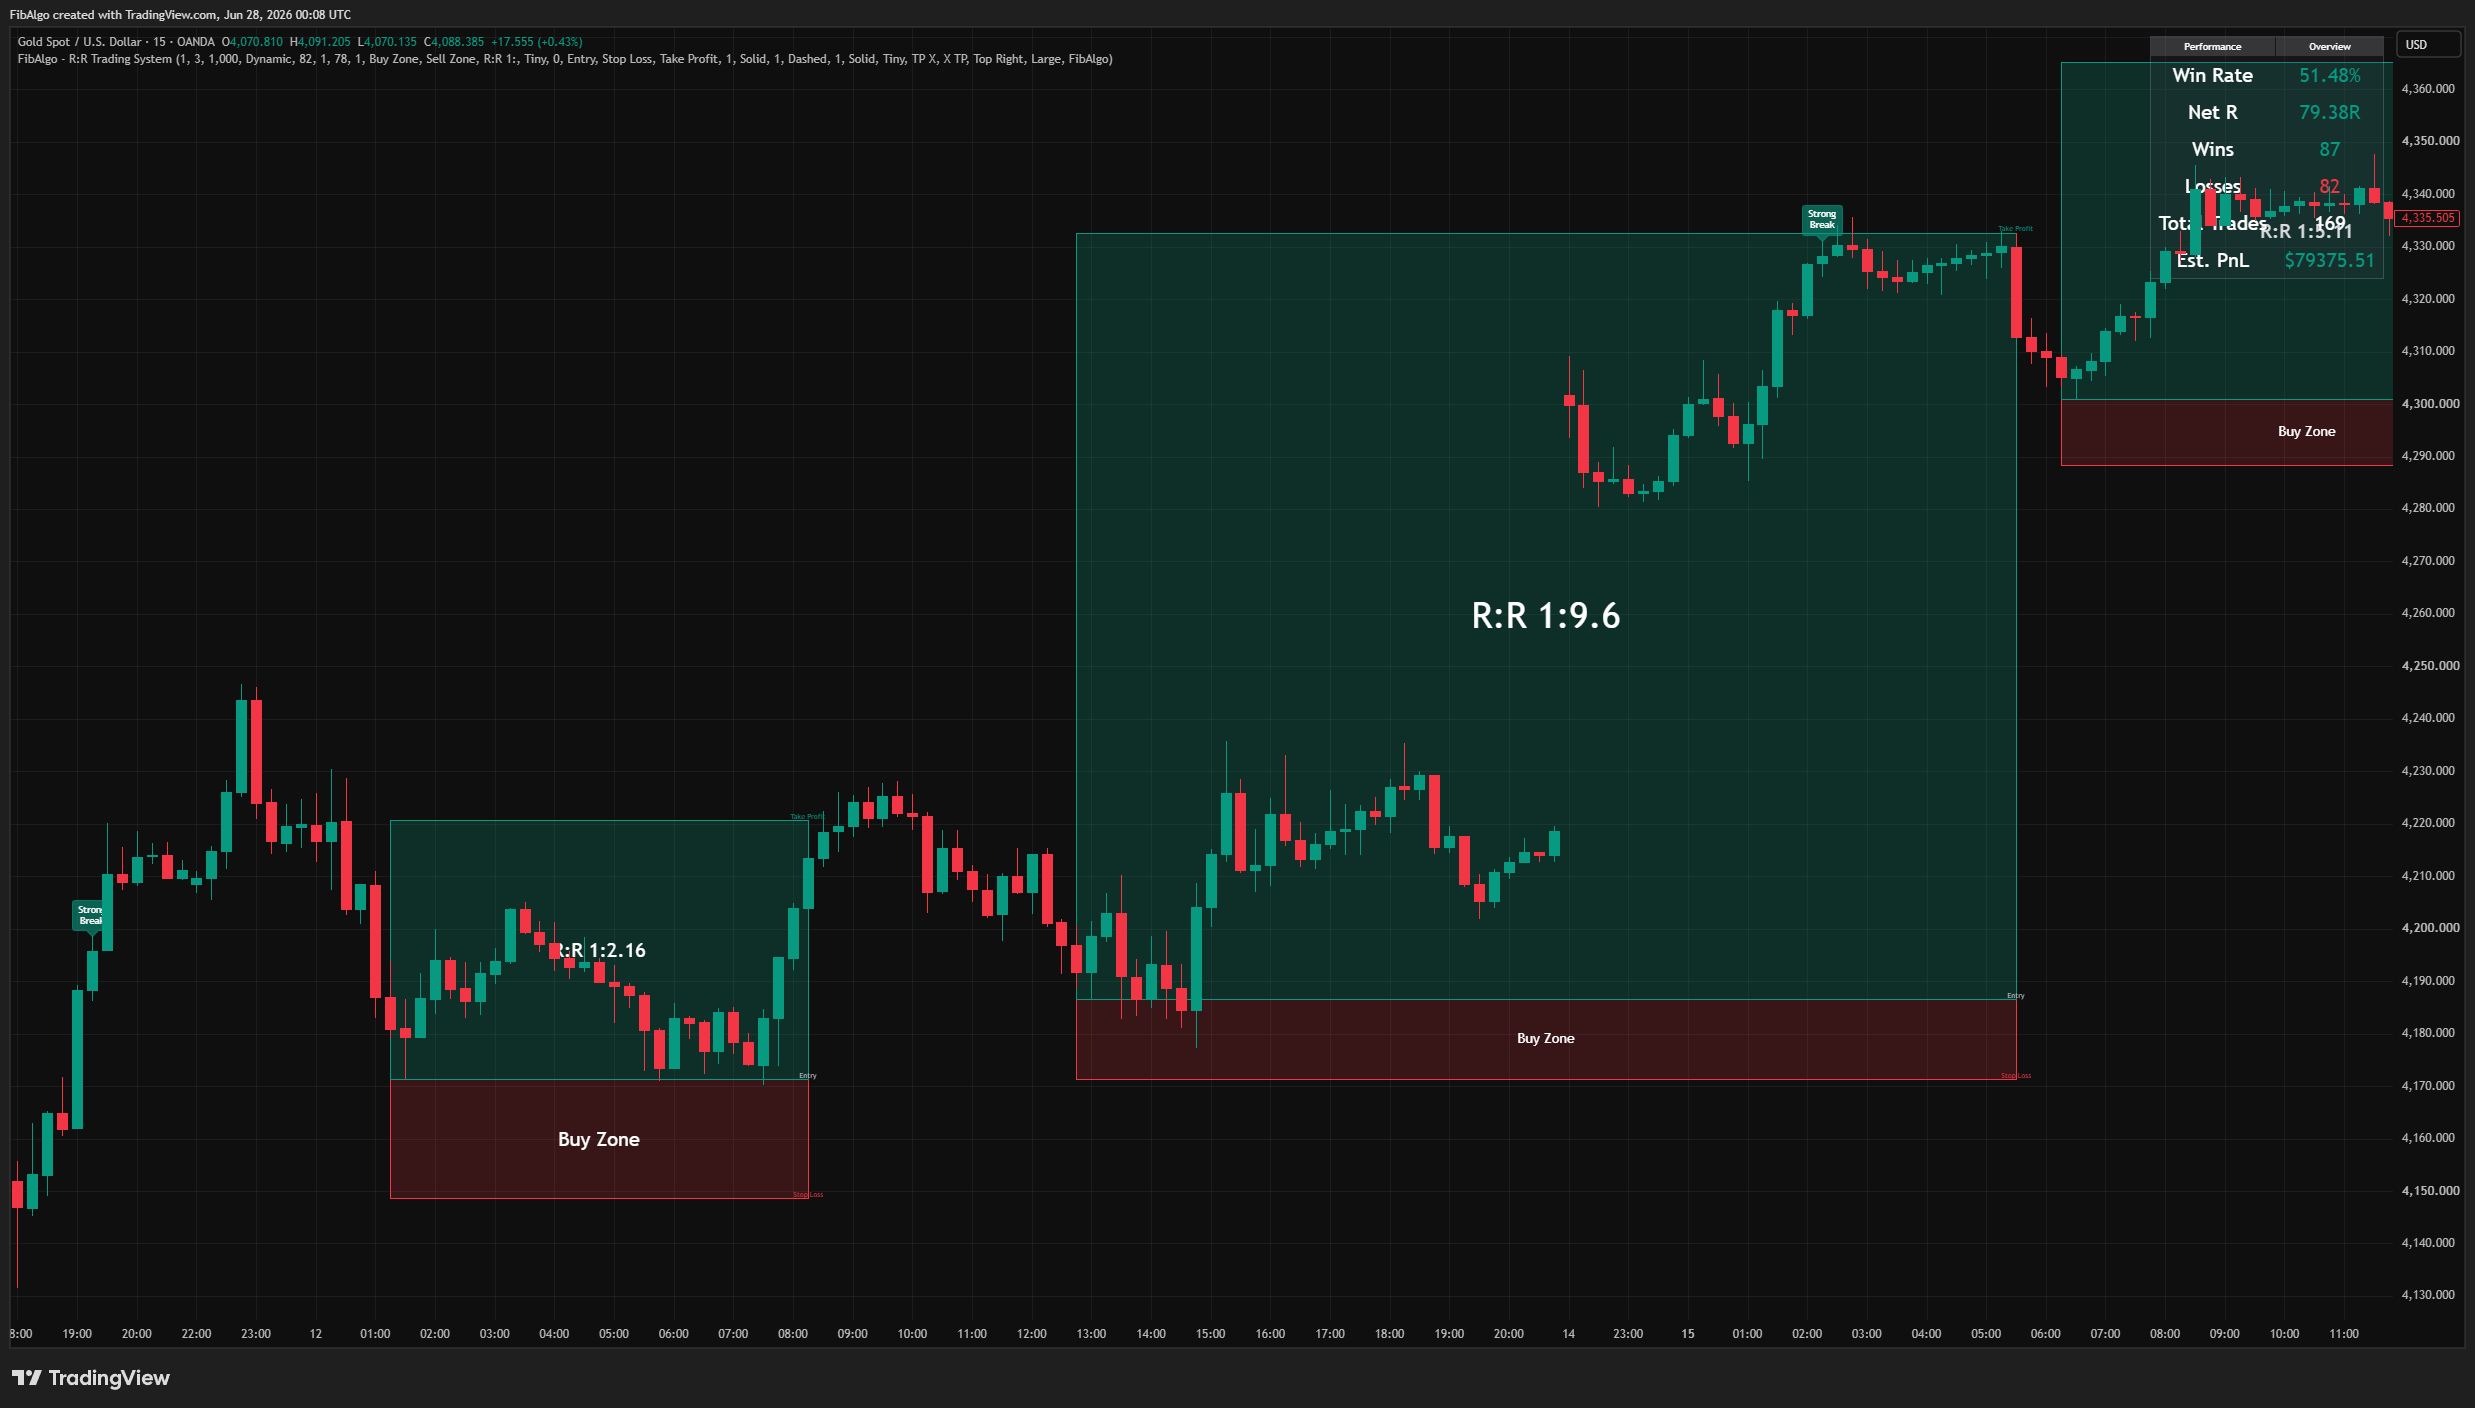
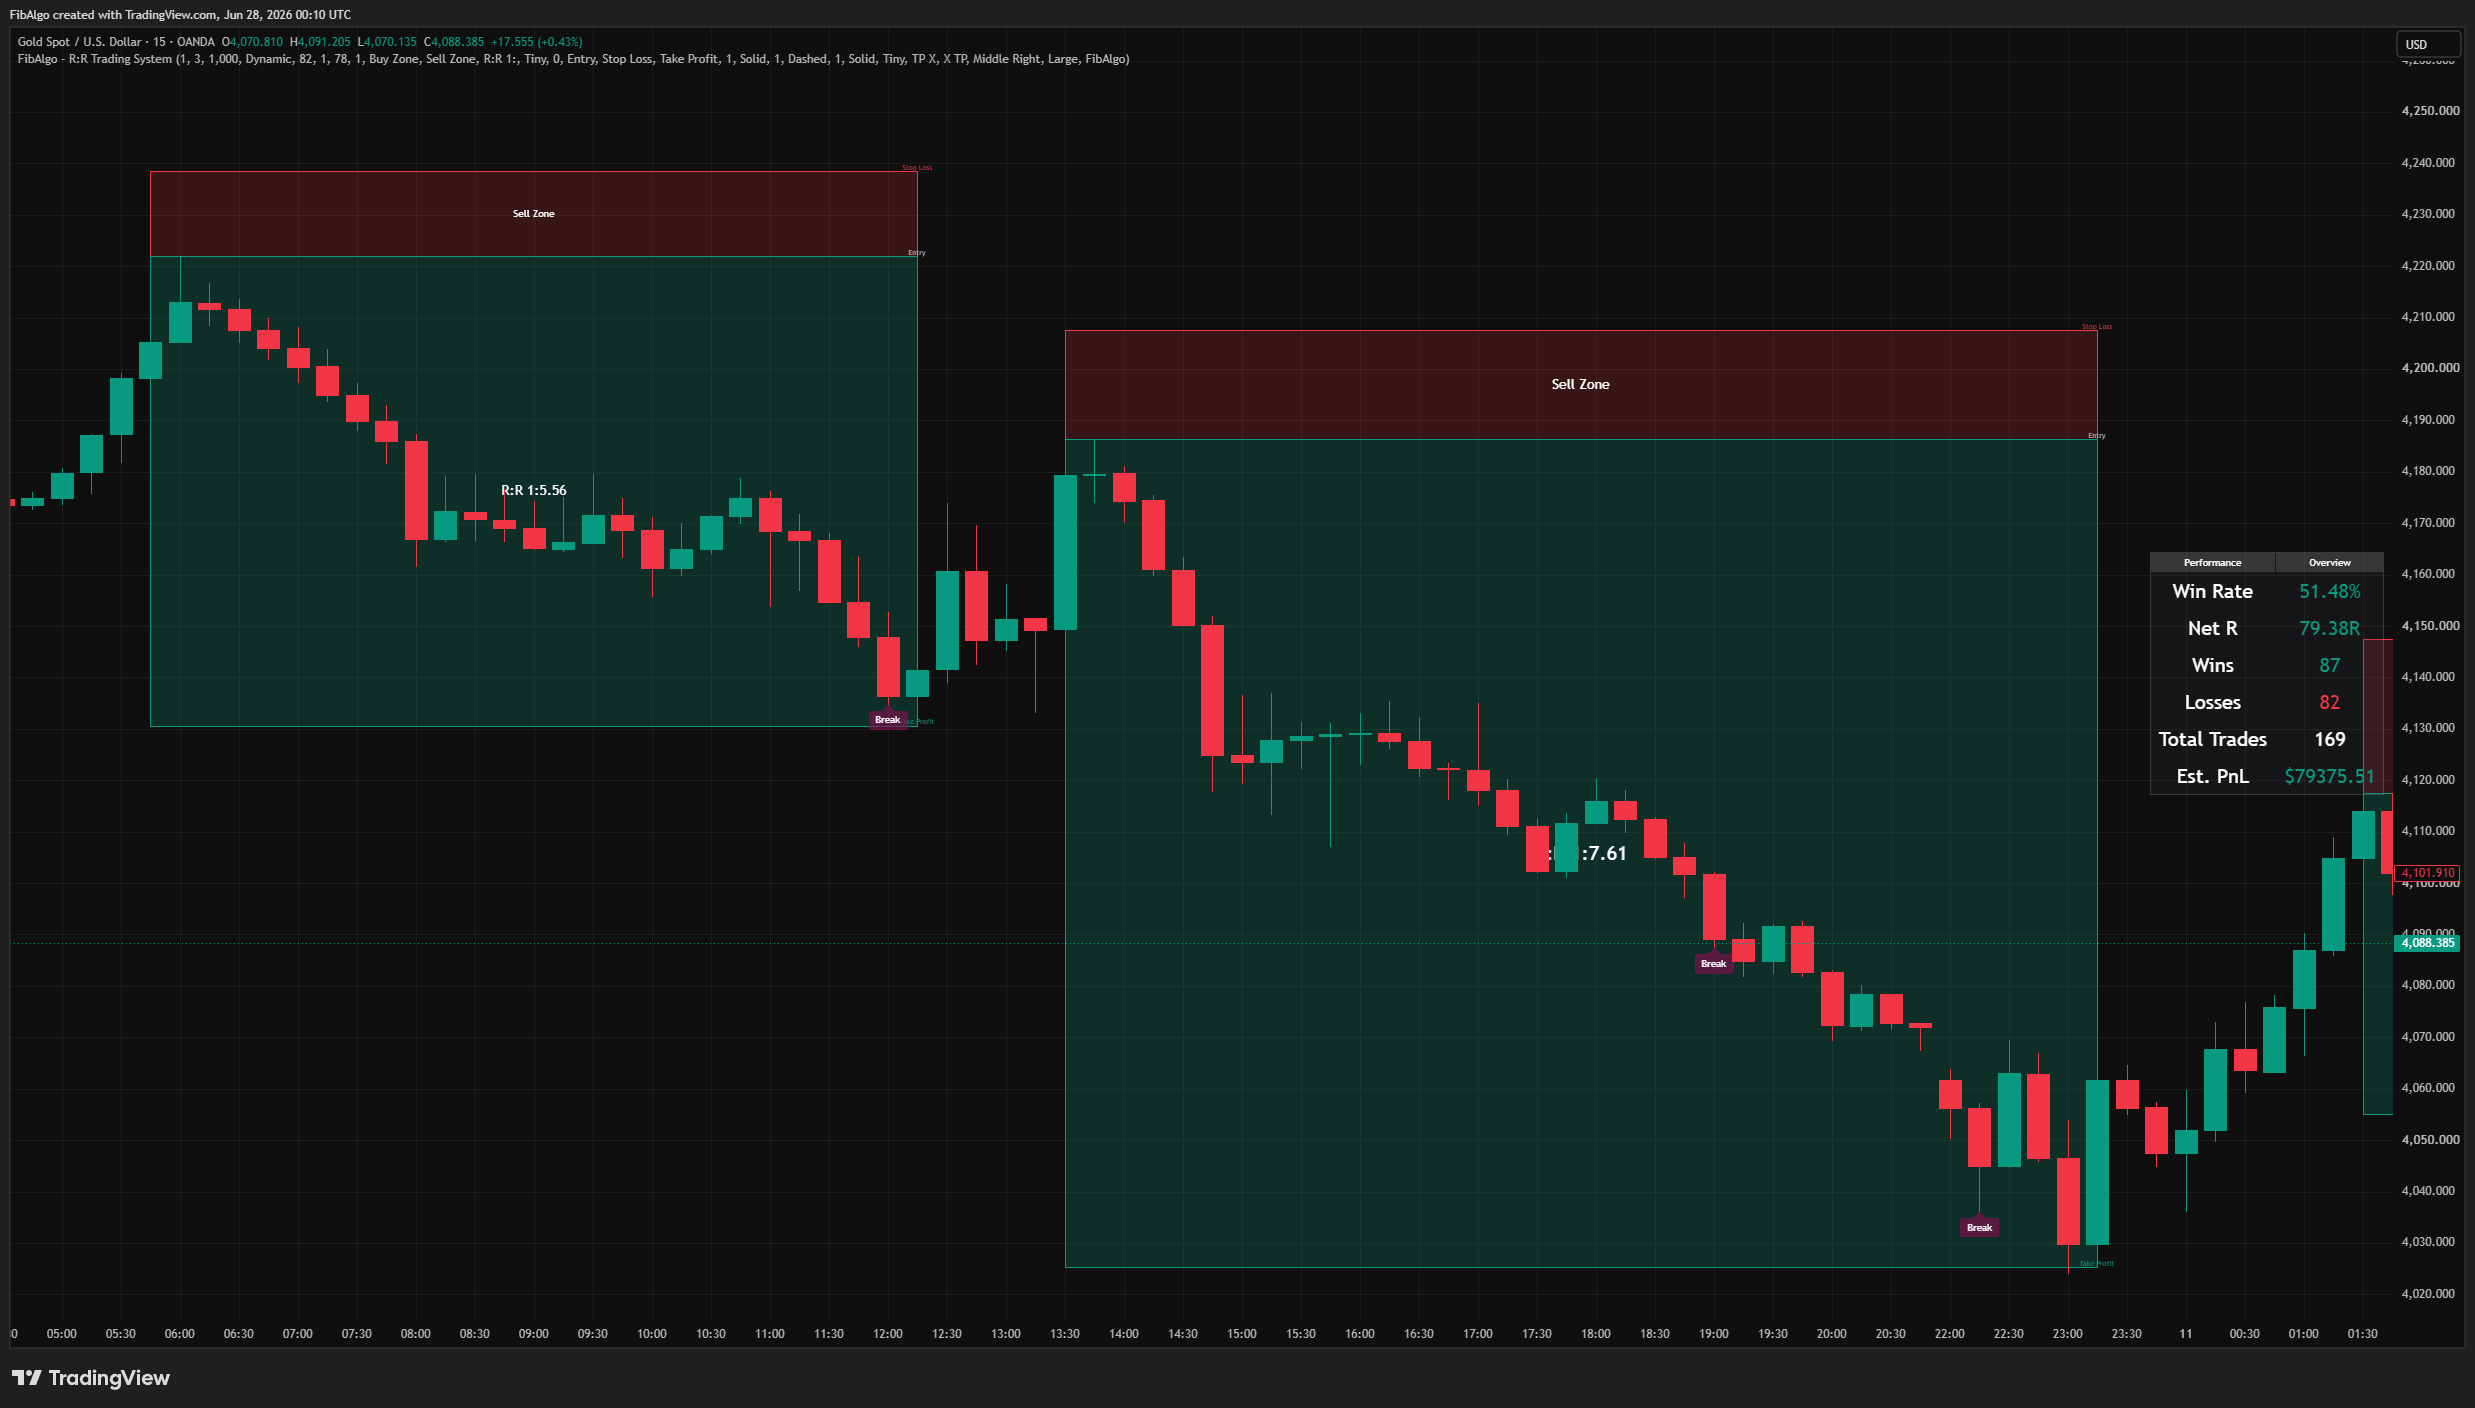
After a confirmed breakout, when the opposite volatility band reclaims the broken S/R line, a retracement zone (Buy Zone or Sell Zone) is shaded to mark the pullback area where a continuation entry can be framed. The zone adjusts dynamically as new candles develop, and its visibility and colors are fully configurable.
Automated Risk:Reward Engine
Each retracement zone seeds a complete R:R setup automatically:
- Entry is taken at the retracement extreme.
- Stop is placed beyond the S/R level with an ATR-based buffer.
- The initial target is set at 1R (a 1:1 risk-to-reward distance).
From there the setup is tracked live: take-profit progress is detected via successive R-multiples and RSI(70/30) crosses, the risk and reward boxes extend with price, and the setup freezes and records its final R when an opposite breakout invalidates it.
Performance Panel
A live table tallies the results of the indicator's own setups on the chart: win rate, net R, wins, losses, total trades, and an estimated dollar PnL based on a user-defined dollar value per 1R. This is a backward-looking visualization of the logic on historical bars, not a broker-accurate backtest.
Step 1 — Volatility Bands
Supertrend-style upper and lower bands are built from HL2 and ATR(10), scaled by the Trend Volatility Sensitivity input. In parallel, a volatility measure (standard deviation of close times the Volatility Buffer Sensitivity) and its rolling 50-bar baseline are computed, with a fallback for early bars.
Step 2 — Period Segmentation and S/R Placement
Crossovers of close versus the bands, combined with an intrabar pressure reading, open and close high periods and low periods. When a period ends, the running extreme plus the volatility buffer at that extreme defines a horizontal S/R level.
Step 3 — Breakout and Retracement
A close beyond an unused S/R level fires a breakout, tagged by volatility regime. If the opposite band then reclaims the broken level while the breakout direction is still in force, a Buy or Sell retracement zone is created and resized on each new bar.
Step 4 — R:R Construction, Tracking, and Performance
The zone seeds entry, stop, and a 1R target, drawn with risk and reward boxes plus Entry / Stop Loss / Take Profit lines and labels. Take-profit events advance the target; an opposite breakout freezes the setup, computes its final R (−1R if no TP was reached), and updates the performance table.
Visual Customization
- Breakout labels — show/hide, up and down colors, text color, size, and custom text per tier.
- Retracement zones — show/hide with independent Buy Zone, Sell Zone, and border colors.
- Risk and reward boxes — base colors, transparency, border color, and width.
- Entry / Stop / Target lines — color, width, style (solid / dashed / dotted), and optional custom-text labels.
- Performance table — nine positions, background and frame colors, and text size.
Smart Alert System
- Breakout alerts — up, down, strong up, strong down.
- Retracement zone alerts — buy/sell box started, and zone enter/exit.
- Take-profit alerts — buy and sell TP triggers.
- Runtime messages with price and RSI details, plus a configurable alert prefix. All alerts are individually toggleable.
Getting Started
Add the indicator to any chart. The default settings (Volatility Buffer Sensitivity: 1.0, Trend Volatility Sensitivity: 3.0) work well for most liquid instruments; intraday-to-swing timeframes (15m to 4H) give the cleanest period segmentation.
Reading the Chart
- Break / Strong Break / Low Break labels = a close beyond an S/R level, tagged by volatility regime.
- Shaded zone = the retracement (pullback) area after a breakout.
- Red box = risk (entry to stop). Teal box = reward (entry to target), labeled with the live R:R ratio.
- Entry / Stop Loss / Take Profit lines = the active setup's levels.
- Performance table = running win rate, net R, and estimated PnL.
Key Inputs
- Volatility Buffer Sensitivity (0.1 to 2.0): widens or tightens the S/R buffer.
- Trend Volatility Sensitivity (0.5 to 10.0): controls band distance and how readily periods flip.
- Dollar Value Per 1R: scales the estimated PnL figure in the performance table.
Limitations
- This indicator is a technical analysis and trade-framing tool. It does not generate buy/sell orders and does not place or manage real trades.
- Breakout signals, levels, boxes, and labels are evaluated on the developing bar and can update until that bar closes (intrabar). Alerts fire once per bar.
- The performance table is a backward-looking visualization of the indicator's own logic on historical bars — not a broker-accurate backtest. It excludes slippage, commissions, spread, and real fills.
- The estimated dollar PnL depends on the user-set dollar value per 1R and assumes constant risk per setup.
- Volatility classification needs sufficient history for its rolling baseline; very low sensitivity on noisy instruments can produce frequent period changes.
The volatility band segmentation is based on the Supertrend concept by Olivier Seban. The volatility-adjusted support/resistance levels, three-tier breakout classification, retracement entry zones, automated Risk:Reward construction and tracking, and the performance panel are original contributions.
Frequently Asked Questions
Unlock exclusive FibAlgo tools
Our best trading indicators plus AI-powered analysis for advanced trading.
Unlock now