Overview
FibAlgo - ICT Standard Deviation & Targets automatically detects significant swing ranges and projects standard deviation extension levels above and below them — the core ICT method for identifying high-probability price targets. The indicator maps up to six configurable SD multiples (default: 1.0, 1.5, 2.0, 2.5, 3.0, and an optional 4.0 max expansion), displays the reference range with its Consequent Encroachment midpoint, and visually tracks which levels have been reached. A real-time info table shows the nearest unreached target, current position relative to the range, and reached/total level counts.
Key Concepts
- Standard Deviation Projections — ICT uses standard deviation multiples of a price range to project potential expansion targets. These levels represent how far price may extend beyond a manipulation leg or significant swing.
- Manipulation Leg — The initial directional price move, often a liquidity sweep, that forms the reference range. The swing high to swing low of this leg defines the range from which SD levels are projected.
- Consequent Encroachment (CE) — The 50% midpoint of any range. Acts as a key equilibrium level where price may react during retracements.
- Key Reaction Zone (2.0–2.5 SD) — Price frequently retraces or reverses between the 2.0 and 2.5 SD levels. This zone aligns with ICT's emphasis on watching for institutional reactions at extended deviations.
- Max Expansion (4.0 SD) — ICT's ultimate target level. When price reaches 4.0 SD, traders should pause and re-evaluate market structure and PD arrays.
- Reached Level Tracking — When price touches a projected SD level, it is marked as "reached" with a visual style change (dashed line, faded color), helping traders quickly identify which targets have been hit and which remain active.
- PD Array Confluence — SD projections become most powerful when they align with other ICT concepts like Fair Value Gaps, Order Blocks, or liquidity levels, creating high-confluence trade setups.
How It Works
1. Range Detection The indicator uses pivot-based swing detection to identify significant price ranges. When confirmed swing highs and swing lows form a range that meets the minimum ATR size filter, it becomes the active reference range for SD projections. The Pivot Length parameter controls how many bars are required on each side for swing confirmation — higher values detect larger, more significant manipulation legs. 2. SD Level Projection Once a reference range is identified, standard deviation levels are projected in both directions (configurable to bullish only, bearish only, or both):- Bullish targets: Range High + (SD multiple x Range Size)
- Bearish targets: Range Low - (SD multiple x Range Size)
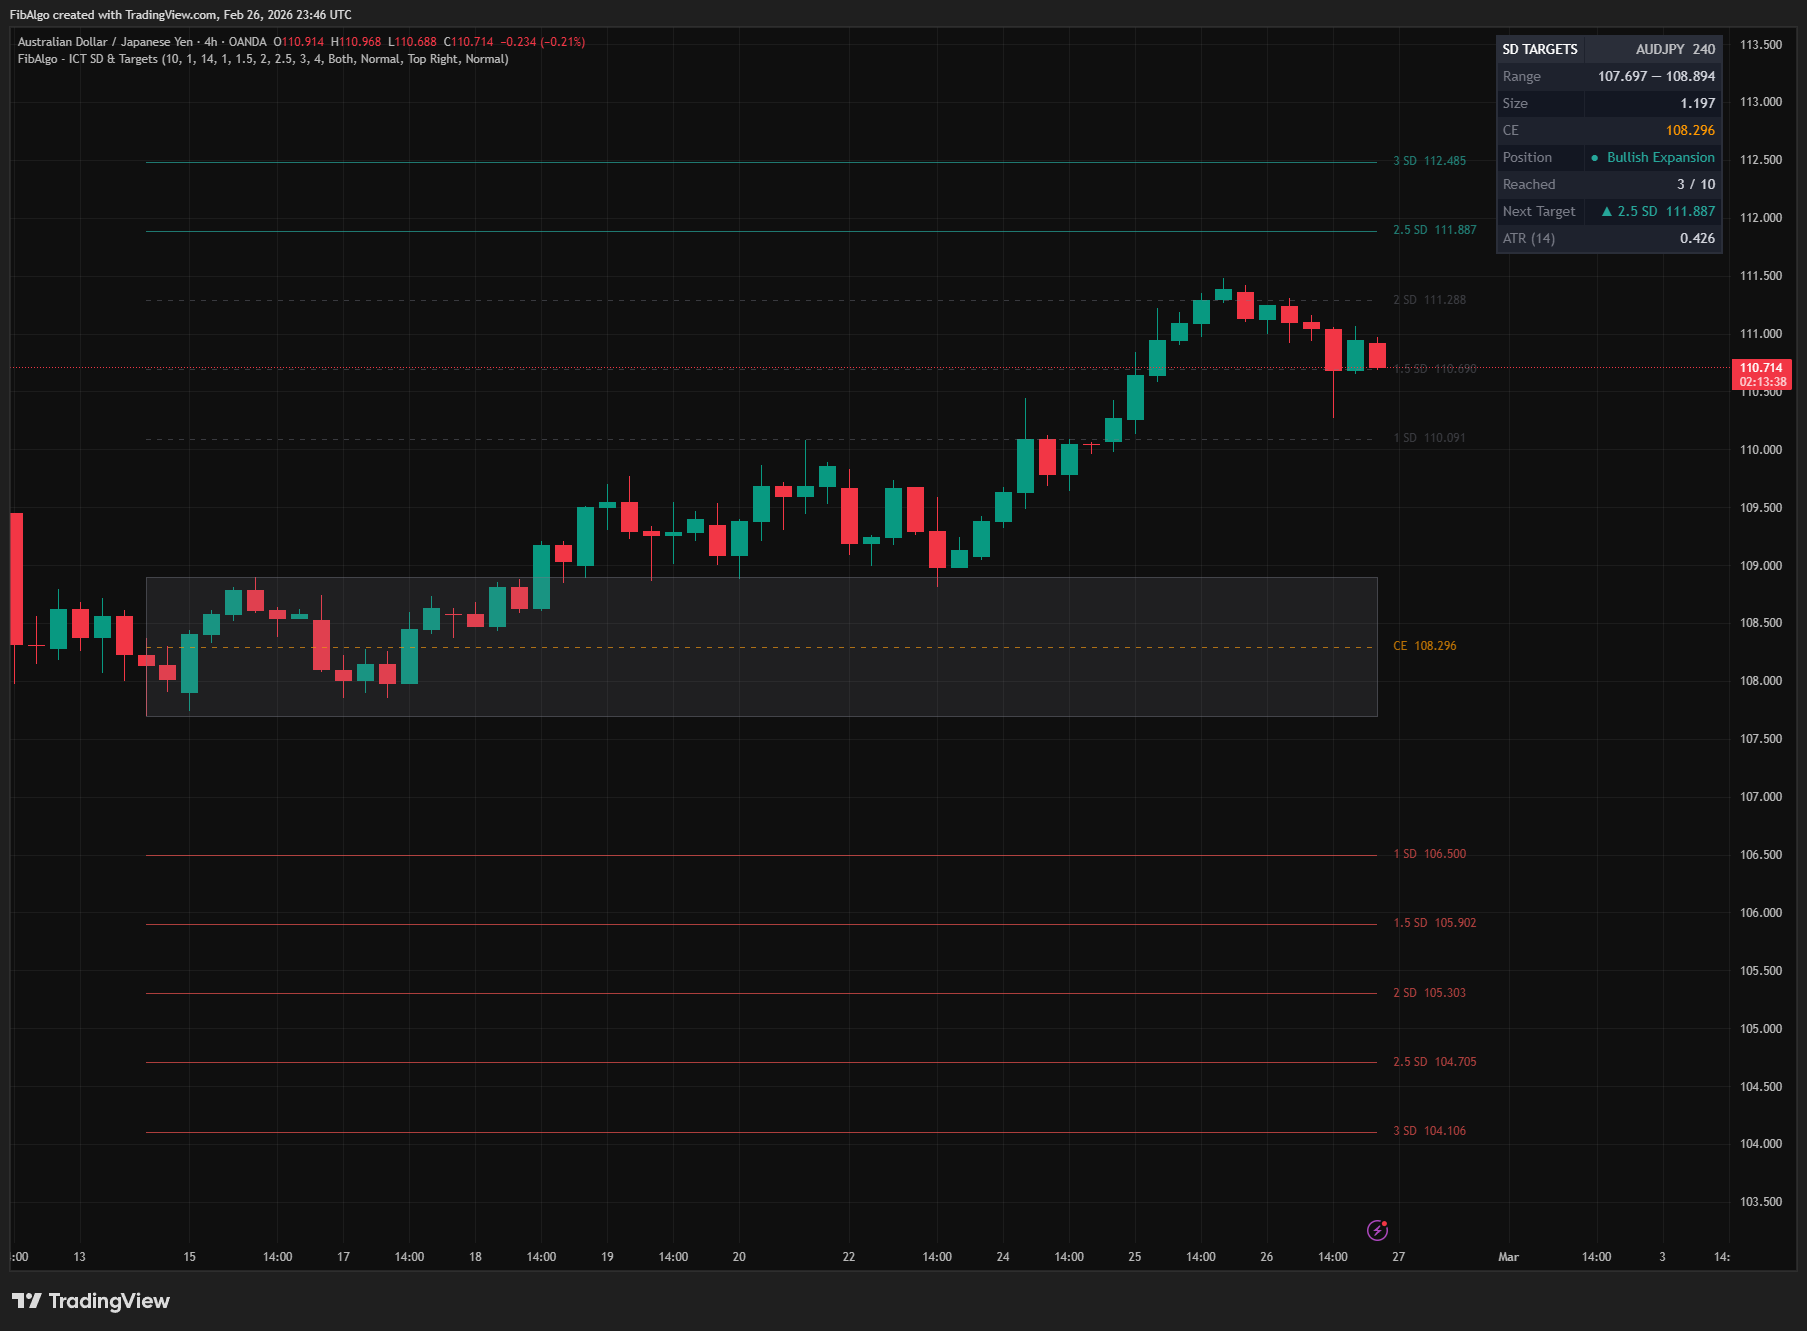
- Inside Range — Price is between range high and low (no expansion yet)
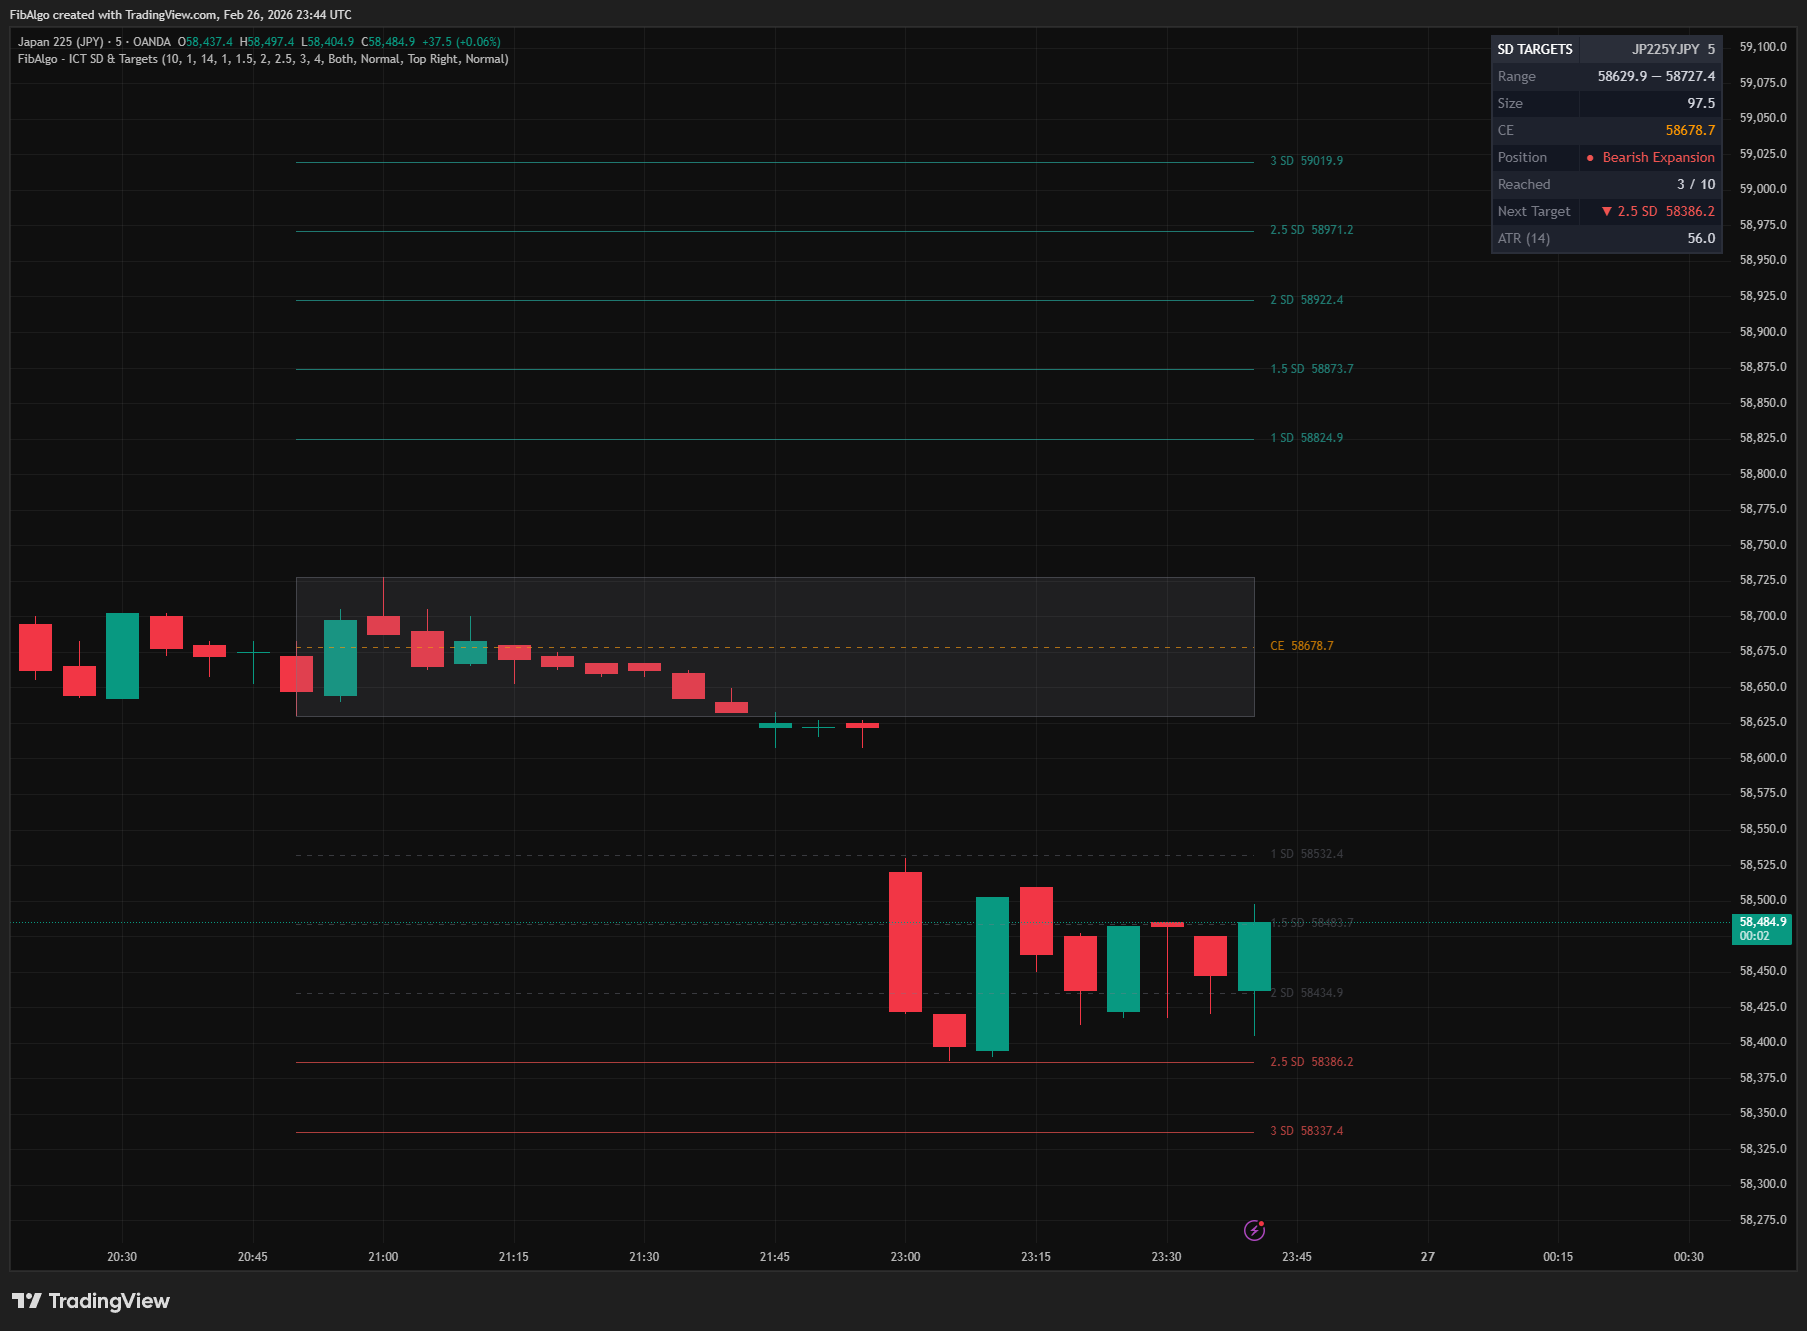
- Bullish Expansion — Price is above range high (targeting upper SD levels)
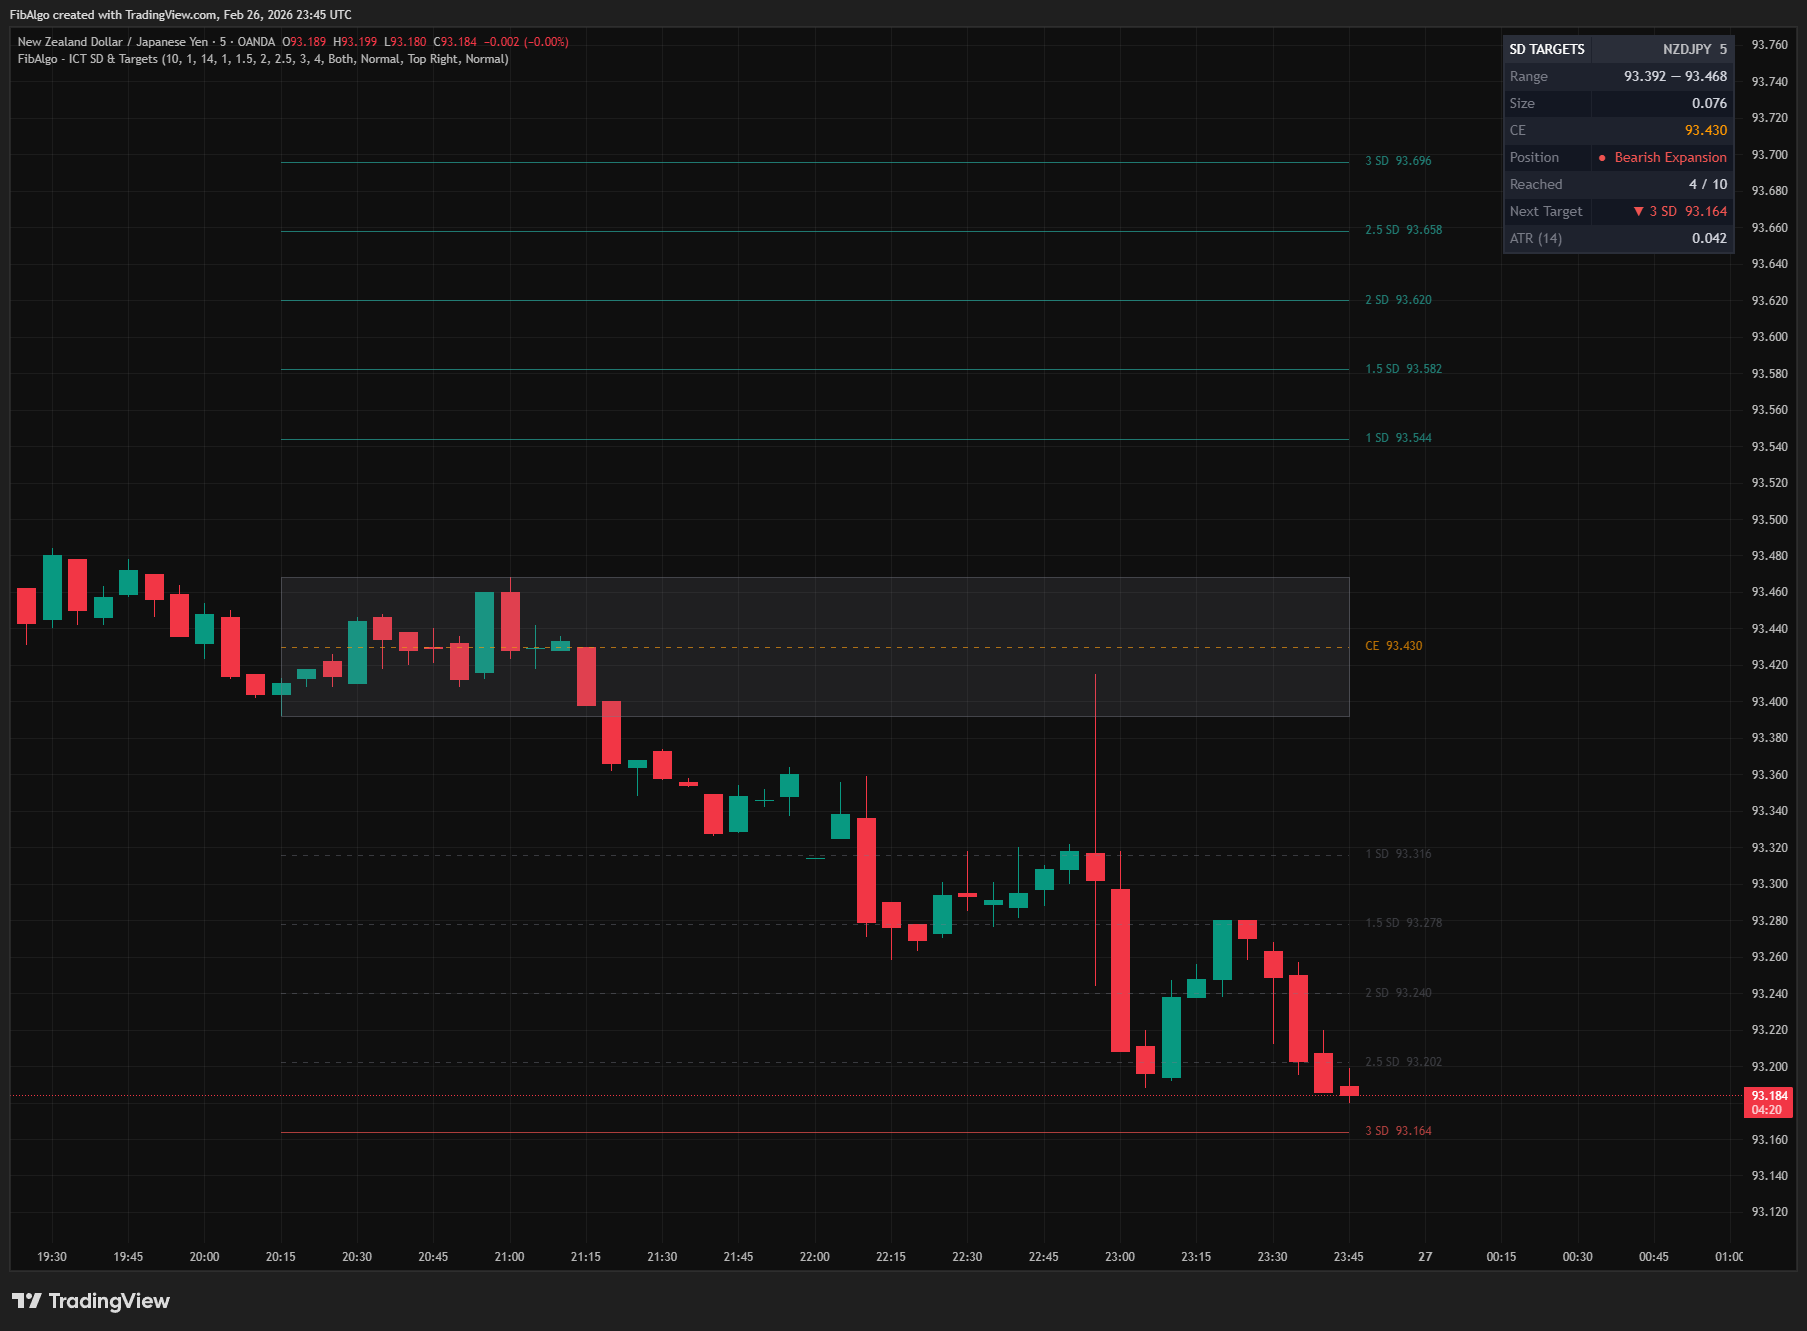
- Bearish Expansion — Price is below range low (targeting lower SD levels)
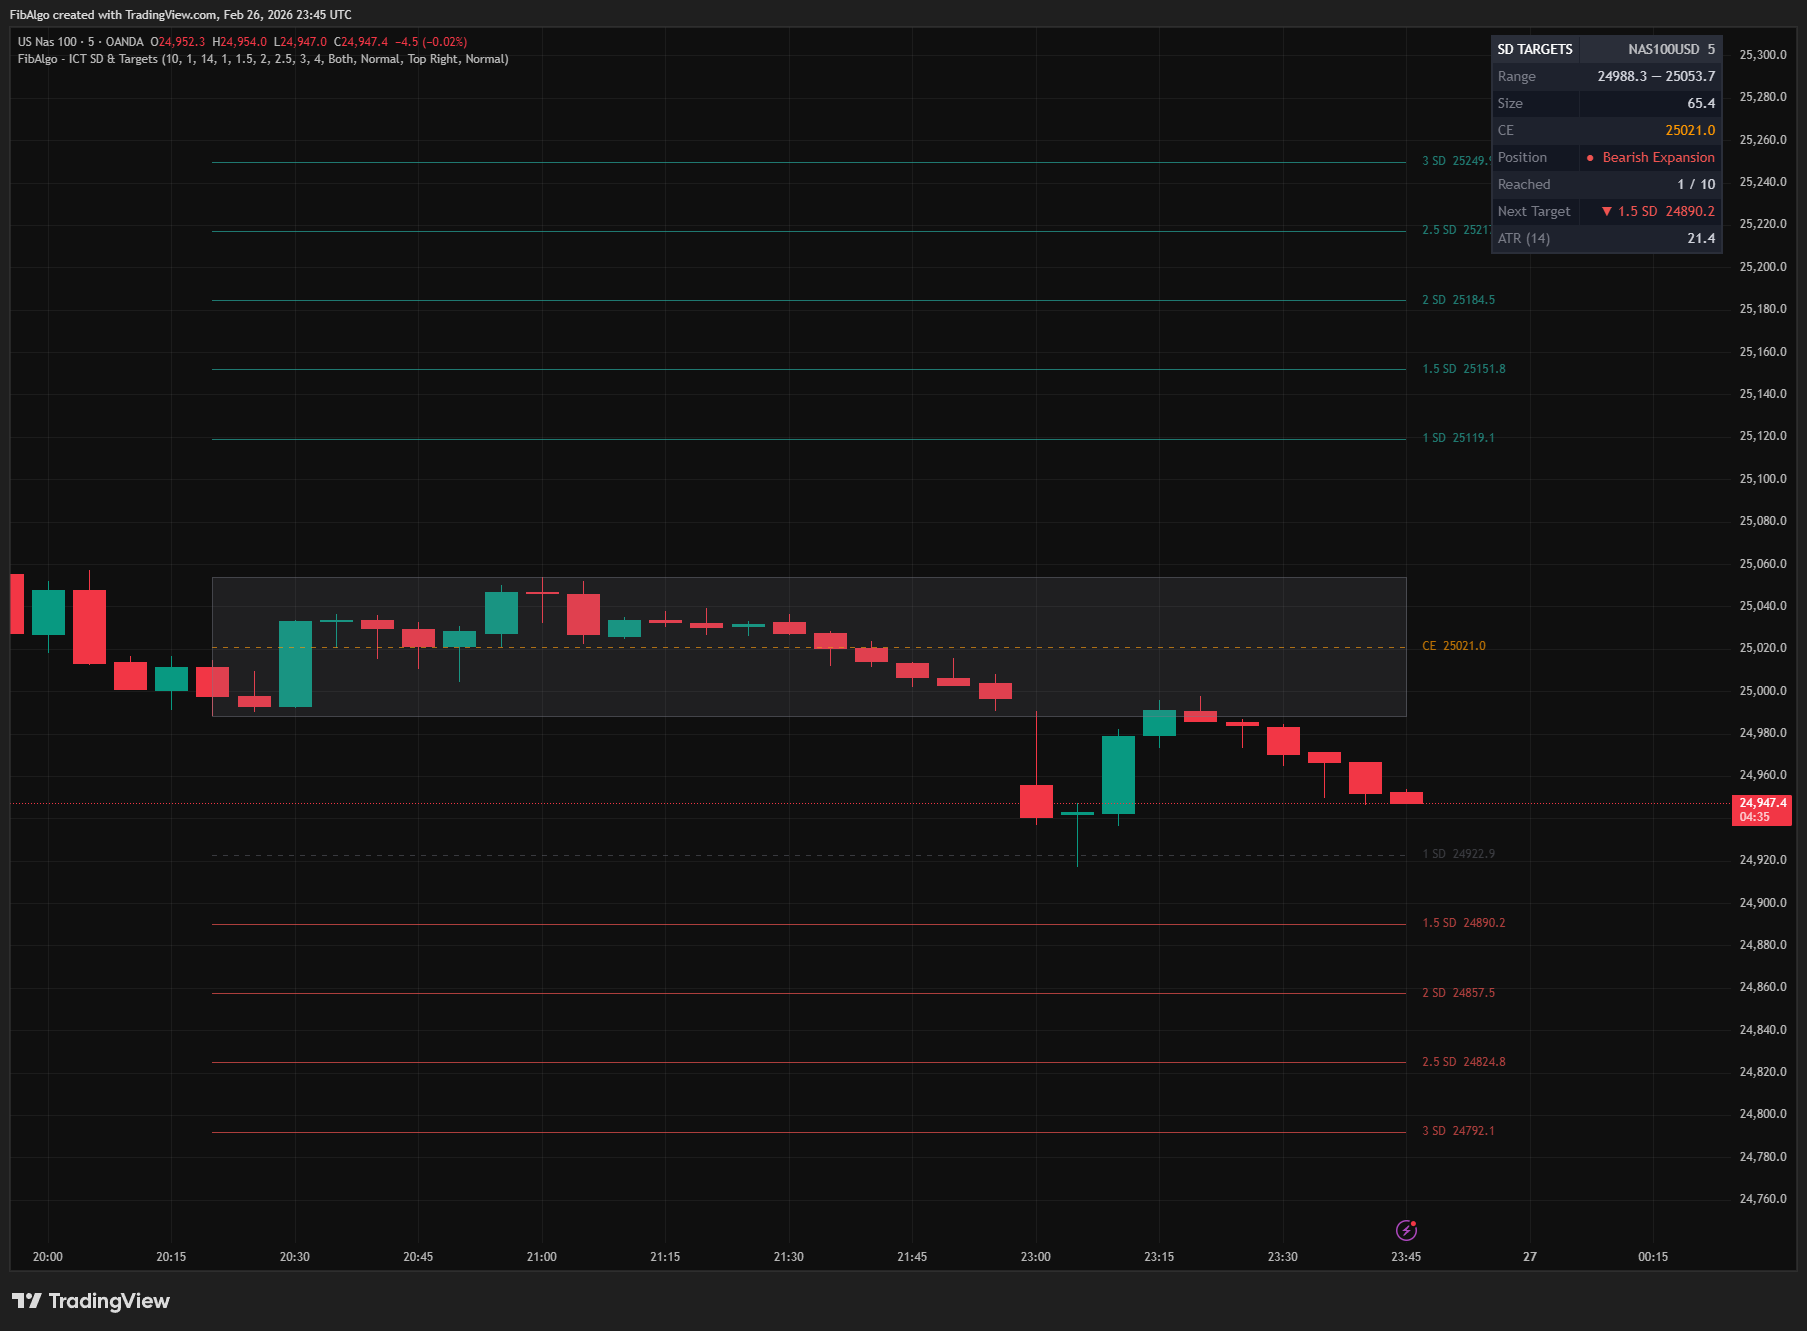
- Header with symbol and timeframe
- Range boundaries (High — Low)
- Range Size in price units
- CE (Consequent Encroachment) level
- Current Position (Inside / Bullish / Bearish Expansion)
- Reached counter (e.g., "3 / 10")
- Next Target — the closest unreached SD level with direction indicator
- ATR value for reference
Features
- Automatic Range Detection — Identifies significant swing ranges using configurable pivot-based detection with ATR size filtering.
- 6 Configurable SD Levels — Each level has its own toggle and value. Defaults: 1.0, 1.5, 2.0, 2.5, 3.0 (SD 6 at 4.0 off by default).
- Bidirectional Projections — Projects targets above range high (bullish) and below range low (bearish), with option to show only one direction.
- Reached Level Tracking — Automatically detects when price touches SD levels and updates visual style to dashed/faded.
- Reference Range Box — Displays the swing range as a shaded box for clear visual context.
- Consequent Encroachment Line — Dashed midpoint line at 50% of the range.
- Direction Filter — Choose Both, Bullish Only, or Bearish Only projections to reduce visual noise.
- Price Labels with Tooltips — Each SD line includes a label showing the multiplier and exact price, with detailed information in the tooltip.
- Real-Time Info Table — 8-row dashboard showing range details, position, reached counts, nearest target, and ATR.
- Next Target Display — The info table highlights the closest unreached SD level with a directional arrow indicator.
- Position Indicator — Shows whether price is inside the range, in bullish expansion, or in bearish expansion.
- 2 Alert Types — Alerts for new range detection and individual SD level reached, with price information.
- Full Customization — Independent colors for bullish projections, bearish projections, range box, and midpoint line.
- Bar-Index Clamping — Automatically prevents drawing errors when range boundaries exceed 5000 bars.
- Clean Drawing Management — Old drawings are properly deleted when a new range forms, maintaining chart performance.
How to Use
- Add the indicator to your chart. The most recent significant swing range appears as a shaded box with SD projection lines extending in both directions.
- Look for price reactions at the 2.0 and 2.5 SD zones — these are ICT's primary reaction areas where reversals or retracements frequently occur.
- Use the "Next Target" field in the info table to quickly identify the closest unreached level for take-profit placement.
- When the Position shows "Bullish Expansion," focus on upper (green) SD targets. For "Bearish Expansion," focus on lower (red) targets.
- Combine SD levels with other ICT tools — FVGs, Order Blocks, or liquidity levels at the same price as an SD projection create a high-confluence setup.
- If price reaches the 4.0 SD (max expansion) level, pause and re-evaluate the market using premium/discount analysis and PD arrays.
- Adjust the Pivot Length for your timeframe: lower values (5–8) for scalping/intraday, higher values (10–20) for swing trading.
- Use the Direction Filter to reduce chart clutter when you have a directional bias.
Limitations
- This indicator does not generate buy or sell signals. It provides visual projection levels for analysis and target-setting purposes only.
- SD projections assume the detected swing range is the primary manipulation leg. In choppy markets, ranges may form and invalidate quickly.
- Only one active range is displayed at a time. When a new significant range is detected, previous projections are replaced.
- Pivot-based detection has inherent lag equal to the Pivot Length setting (confirmed pivotLen bars after the swing).
- SD projections are most effective when combined with other ICT concepts (FVGs, OBs, liquidity levels) for confluence.
- Very high SD multiples (3.0+) on small ranges may produce targets that are unrealistically far from current price.
Tags
#Smart Money#Support & Resistance#Statistical