Overview
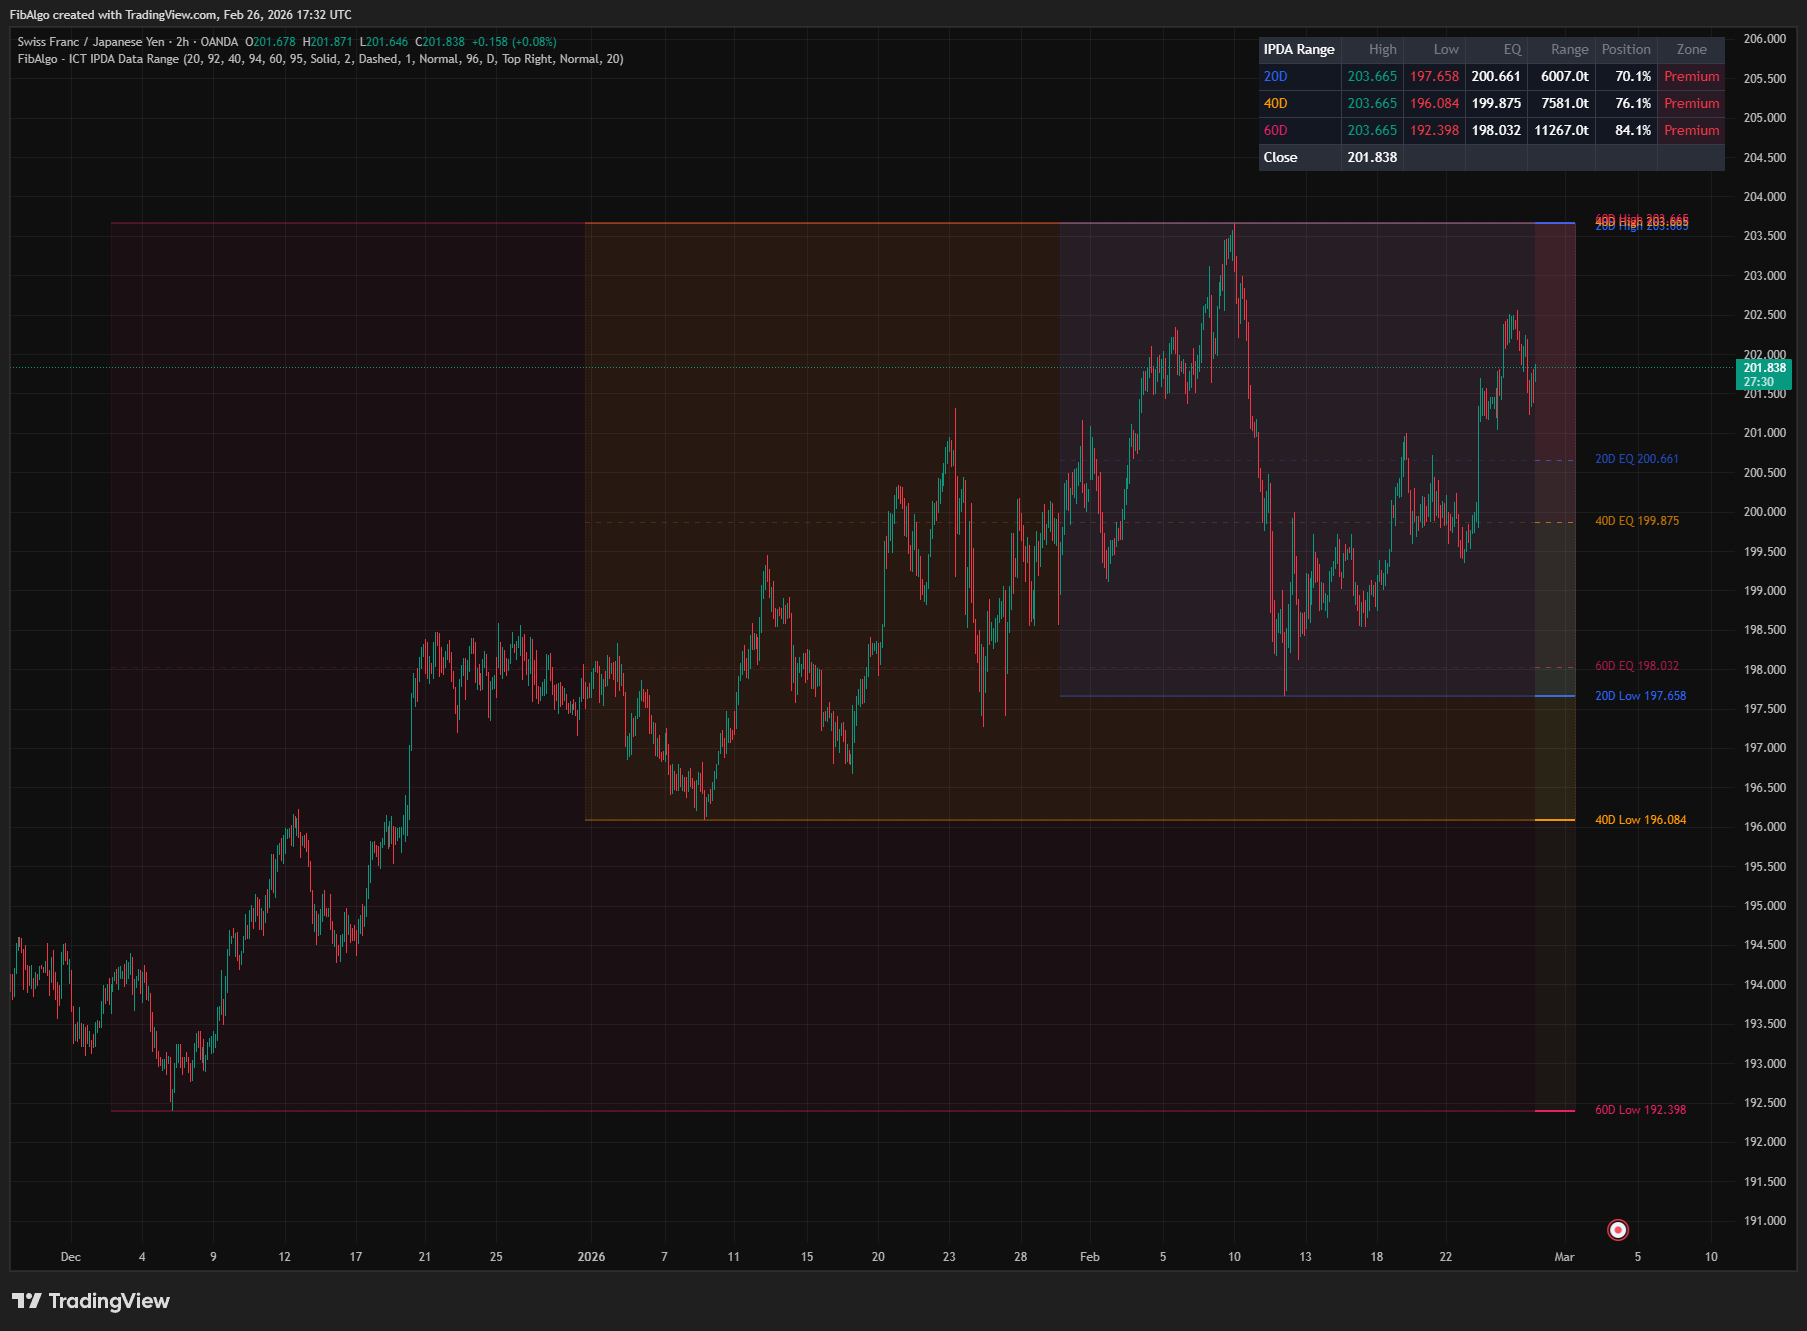
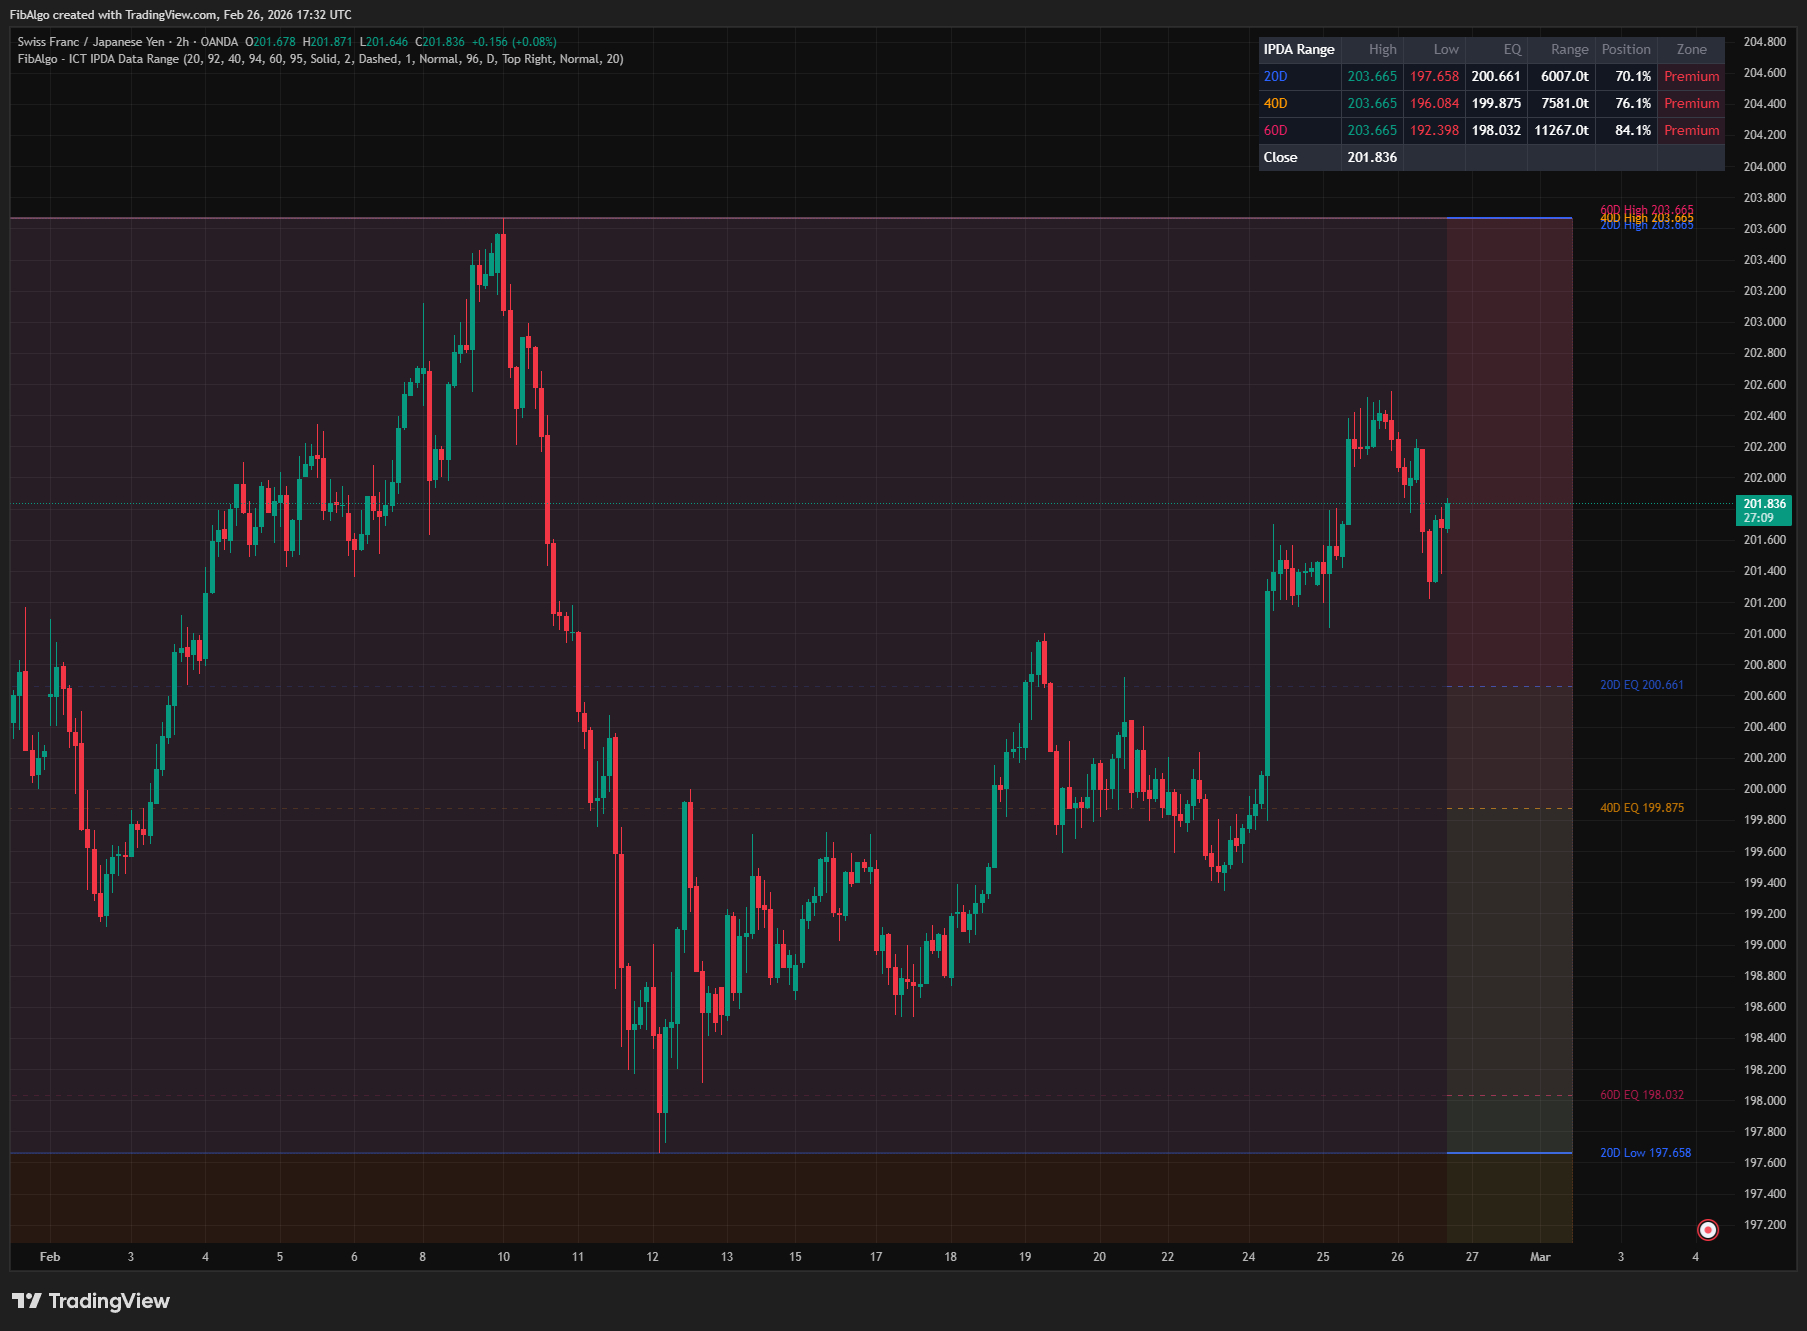
This indicator plots the ICT IPDA (Interbank Price Delivery Algorithm) Data Ranges — the 20, 40, and 60 trading day lookback periods that ICT identifies as the key reference windows used by the algorithm to target liquidity and imbalances. Each range displays the highest high, lowest low, and equilibrium (50% midpoint) as horizontal reference levels. Optional Premium/Discount zone shading helps identify whether price is trading in the upper or lower half of each range. A real-time summary table shows all three ranges with their high, low, equilibrium, total range size, current position percentage, and Premium/Discount/Equilibrium zone classification.
Key Concepts
- IPDA — Interbank Price Delivery Algorithm — ICT's core theory that price in financial markets is delivered algorithmically, not randomly. The algorithm systematically seeks three targets: (1) Liquidity pools (stop orders above highs / below lows), (2) Imbalances (Fair Value Gaps that need rebalancing), and (3) Institutional levels (Order Blocks). The algorithm references specific lookback periods to identify these targets.
- IPDA Data Range — The specific lookback periods (20, 40, and 60 trading days) that the algorithm references when identifying targets. Within each data range, the algorithm catalogs all available liquidity pools, FVGs, and order blocks as potential destinations for price delivery. The 20-day range provides immediate short-term targets, the 40-day range provides intermediate targets, and the 60-day range provides major long-term targets.
- Range High/Low as Draw on Liquidity — The highest high and lowest low within each IPDA data range represent the most significant liquidity pools. Buy-side liquidity accumulates above the range high (buy stops), and sell-side liquidity accumulates below the range low (sell stops). These levels act as the primary "draw on liquidity" — the destinations where price is being algorithmically delivered.
- Equilibrium (50%) — The midpoint between the range high and low. ICT considers price at equilibrium to be at "fair value" for that lookback period. Price above equilibrium is in the Premium zone (overvalued relative to the range), and price below is in the Discount zone (undervalued). Institutional traders buy in discount and sell in premium.
- Nested Ranges — The 20-day range nests inside the 40-day range, which nests inside the 60-day range. When all three range highs or lows converge near the same level, that price becomes a very high-probability target. Conversely, when ranges diverge significantly, each provides distinct targets at different scales.
How It Works
1. Daily Data Reference The indicator uses Daily timeframe data by default, regardless of the chart's current timeframe. This is the correct ICT methodology — IPDA Data Ranges reference trading DAYS, not intraday bars. When the "Use Daily Data" option is enabled, the indicator calls the Daily timeframe via request.security() to retrieve the high, low, and close for each trading day. On daily charts, data is used directly without any extra request.Users can override the reference timeframe if they want to explore IPDA concepts on weekly or other timeframes, but the default (Daily) matches ICT's standard teaching.
2. Range Calculation For each of the three lookback periods (default 20, 40, 60), the indicator calculates: — Highest High: the maximum high across the last N trading days — Lowest Low: the minimum low across the last N trading days — Equilibrium: the arithmetic midpoint (High + Low) / 2These values update every bar as the lookback window rolls forward. When an old extreme is dropped from the window and a new one enters, the range boundaries adjust automatically.
Each level is drawn as two segments: a soft (transparent) line extending left through the lookback box area, and a full-opacity line extending right from the current bar. This provides historical context at a glance without cluttering the chart — the faded left portion shows where the level sat relative to past price action, while the solid right portion projects the level forward as a clear reference.
Lines extend to the right by a configurable number of bars (default 20) beyond the current bar.
6. Summary Table A real-time table displays all enabled ranges with seven columns: Range name (color-coded), High, Low, Equilibrium, Range size (in ticks), Position (%), and Zone (Premium/Discount/Equilibrium). The Zone column uses color-coded backgrounds — red for Premium, green for Discount, gray for Equilibrium. A final row shows the current close price for reference. 7. Alert System Three alert conditions are available: — Range High Break: fires when price closes above any IPDA range high, signaling expansion beyond the lookback period's boundary — Range Low Break: fires when price closes below any IPDA range low — Equilibrium Cross: fires when price crosses any range's equilibrium level, signaling a shift between premium and discount territory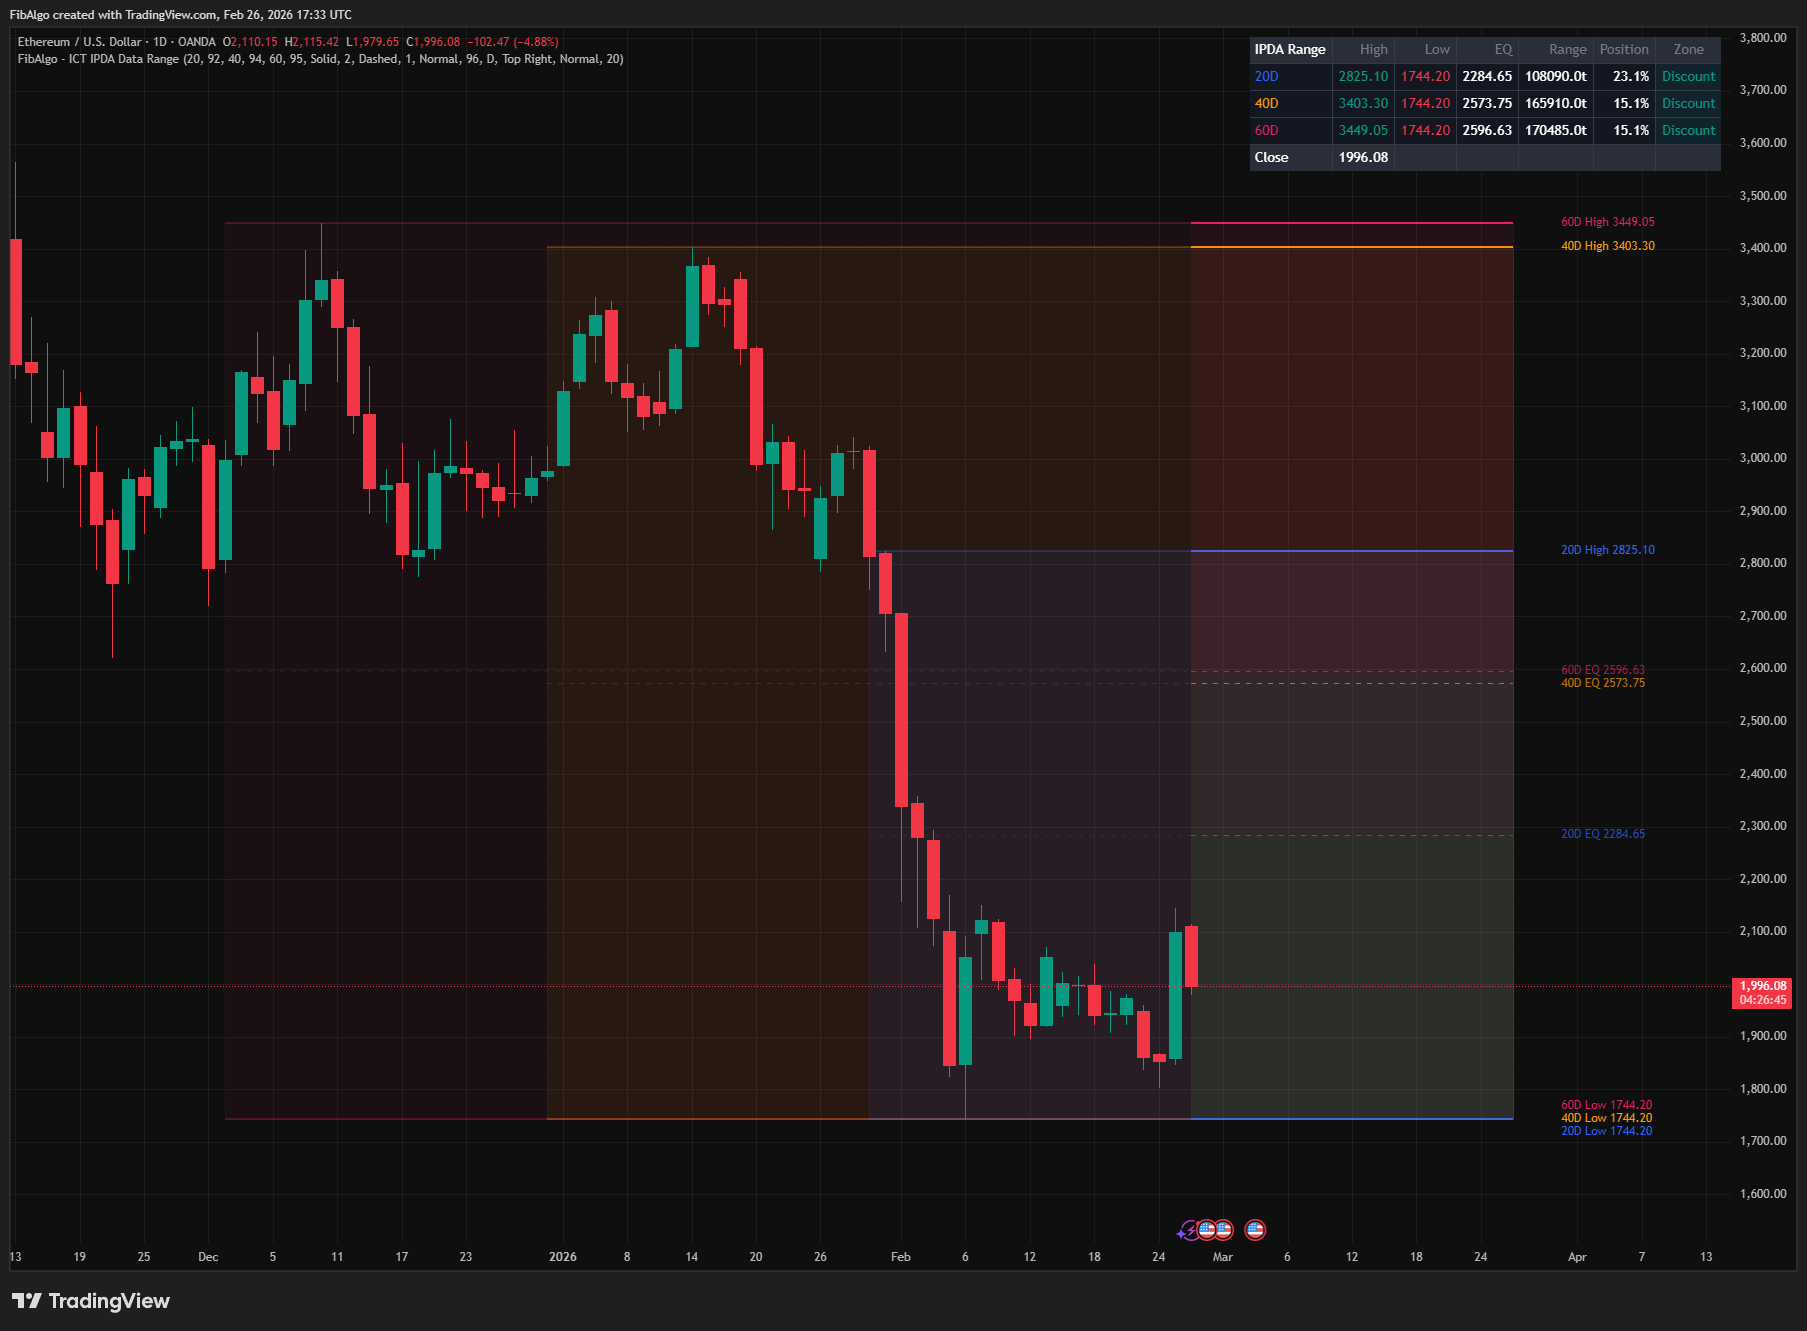
Features
- 3 IPDA Data Ranges — Default 20, 40, and 60 trading day lookback periods matching ICT's published IPDA methodology. Each range is independently configurable from 5 to 120 days. All three can be enabled/disabled individually.
- Automatic Daily Reference — Uses request.security() to always reference Daily timeframe data, even on intraday charts. This ensures IPDA ranges reflect actual trading day boundaries regardless of chart timeframe. Reference timeframe is configurable for advanced use cases.
- Rolling Range Calculation — Highest high and lowest low update dynamically as the lookback window rolls forward. Range boundaries automatically adjust when old extremes fall off the window or new extremes are established.
- Equilibrium (50%) Lines — Dashed midpoint line for each range showing the fair value level. Price above EQ = Premium, below EQ = Discount. Each range's EQ is independently toggleable.
- Premium/Discount Zone Shading — Optional red/green tint on the upper/lower halves of each range. Instantly identifies whether price is in the expensive or cheap part of the IPDA range. In ICT methodology, institutions are described as buying in discount and selling in premium.
- Nested Range Visualization — Ranges are drawn in order (60D background, 40D middle, 20D foreground) so that nested range structure is clearly visible. When all ranges share convergent boundaries, the visual overlap highlights high-probability levels.
- Soft Historical Lines — Each level line extends left through the lookback box with reduced opacity, showing how the level relates to past price action without visual clutter. The solid portion projects right from the current bar as a clear forward reference.
- Range Background Boxes — Semi-transparent colored boxes spanning the full lookback period, showing the historical range visually on the chart. Each box's opacity is independently adjustable.
- Position Percentage — Real-time calculation of price's position within each range (0% = Low, 50% = EQ, 100% = High). Displayed in the summary table for instant quantitative assessment.
- Zone Classification — Each range is classified as Premium (>52%), Discount (<48%), or Equilibrium (48–52%). Color-coded in the summary table with background highlighting.
- Summary Table — 7-column real-time table: Range name, High, Low, EQ, Range (ticks), Position (%), Zone. Color-coded throughout. Current close price displayed in a footer row. Table position and text size configurable.
- 3 Alert Conditions — Range High Break, Range Low Break, and Equilibrium Cross. Each alert fires independently for each enabled range and includes the exact price level, range period, symbol, and timeframe.
- Full Visual Customization — Independent color, opacity, and toggle per range. H/L and EQ line styles (Solid/Dashed/Dotted) and widths are configurable. Label size (Tiny/Small/Normal). Right extension distance adjustable.
- Multi-Timeframe Ready — Works on any chart timeframe. Intraday charts show daily-referenced IPDA ranges projected onto the intraday price action. Daily charts use data directly. Higher timeframe reference is configurable.
How to Use
- Identify IPDA Targets: The range high and low of each period represent the algorithm's primary targets. If price is in discount and the 20D high has not been swept, the 20D high is the nearest upside target. If price is in premium and the 20D low has not been swept, the 20D low is the nearest downside target.
- Determine Bias from Zone: Check the summary table's Zone column. If price is in Discount across all three ranges, bullish bias is strongest. If in Premium across all three, bearish bias is strongest. Mixed zones (e.g., 20D Premium + 60D Discount) suggest short-term overextension within a longer-term bullish context.
- Look for Convergence: When multiple range highs or lows cluster near the same price level, that level becomes a high-probability target. For example, if the 20D high is very close to the 40D high, buy-side liquidity is concentrated there — the algorithm is likely to drive price to that zone.
- Use EQ as Fair Value: The equilibrium line represents fair value for each lookback period. Price consistently trading above EQ confirms bullish intent; below EQ confirms bearish intent. Crosses of the EQ line signal potential shifts in directional bias.
- Combine with ICT Framework: IPDA Data Ranges identify WHERE the algorithm is likely targeting (the macro framework). Combine with Market Structure (direction), Order Blocks (entry levels), Fair Value Gaps (retracement targets), Liquidity Levels (specific sweep targets), Killzones (session timing), and Premium/Discount (zone positioning) for a complete analytical framework.
- Daily Chart for Swing Trading: On daily charts, the IPDA ranges provide the macro swing trading framework. Identify which range boundary the algorithm is targeting, determine whether price is in premium or discount, then drill down to intraday charts for precise entries at order blocks or FVGs within the target zone.
Limitations
- IPDA Data Ranges reference trading days. On weekends and holidays, no new data is generated — the ranges remain unchanged. The lookback counts calendar trading bars, which correspond to trading days on daily charts.
- When used on intraday charts with "Use Daily Data" enabled, the range values update once per daily bar close via request.security(). Intraday price movements beyond the current daily range high/low will not update the IPDA range boundaries until the current daily bar closes.
- The indicator calculates rolling highest-high and lowest-low using ta.highest() and ta.lowest(). On instruments with limited historical data, shorter histories may produce unreliable ranges — ensure your chart has at least 60+ trading days of data.
- Premium/Discount zone shading uses semi-transparent boxes. On charts with multiple overlays, these may reduce visibility. Adjust the P/D Zone Opacity or disable the feature if needed.
- Range boundaries are purely mechanical (highest high / lowest low over N bars). They do not incorporate order flow, volume, or other ICT concepts like FVGs or order blocks within the range. Use other ICT indicators (FVG, Order Blocks, Liquidity Levels) to identify specific targets within the IPDA range.
- IPDA is a theoretical framework from ICT methodology. The "algorithm" referenced is a conceptual model — it does not correspond to a specific known algorithm. Ranges identify statistically significant lookback periods for price extremes, which may or may not align with actual institutional targeting.
- This indicator displays reference levels for swing analysis — it does not generate buy/sell signals. Use it alongside ICT Market Structure, Order Blocks, Fair Value Gaps, Liquidity Levels, and Killzones for a complete trading framework.