Overview
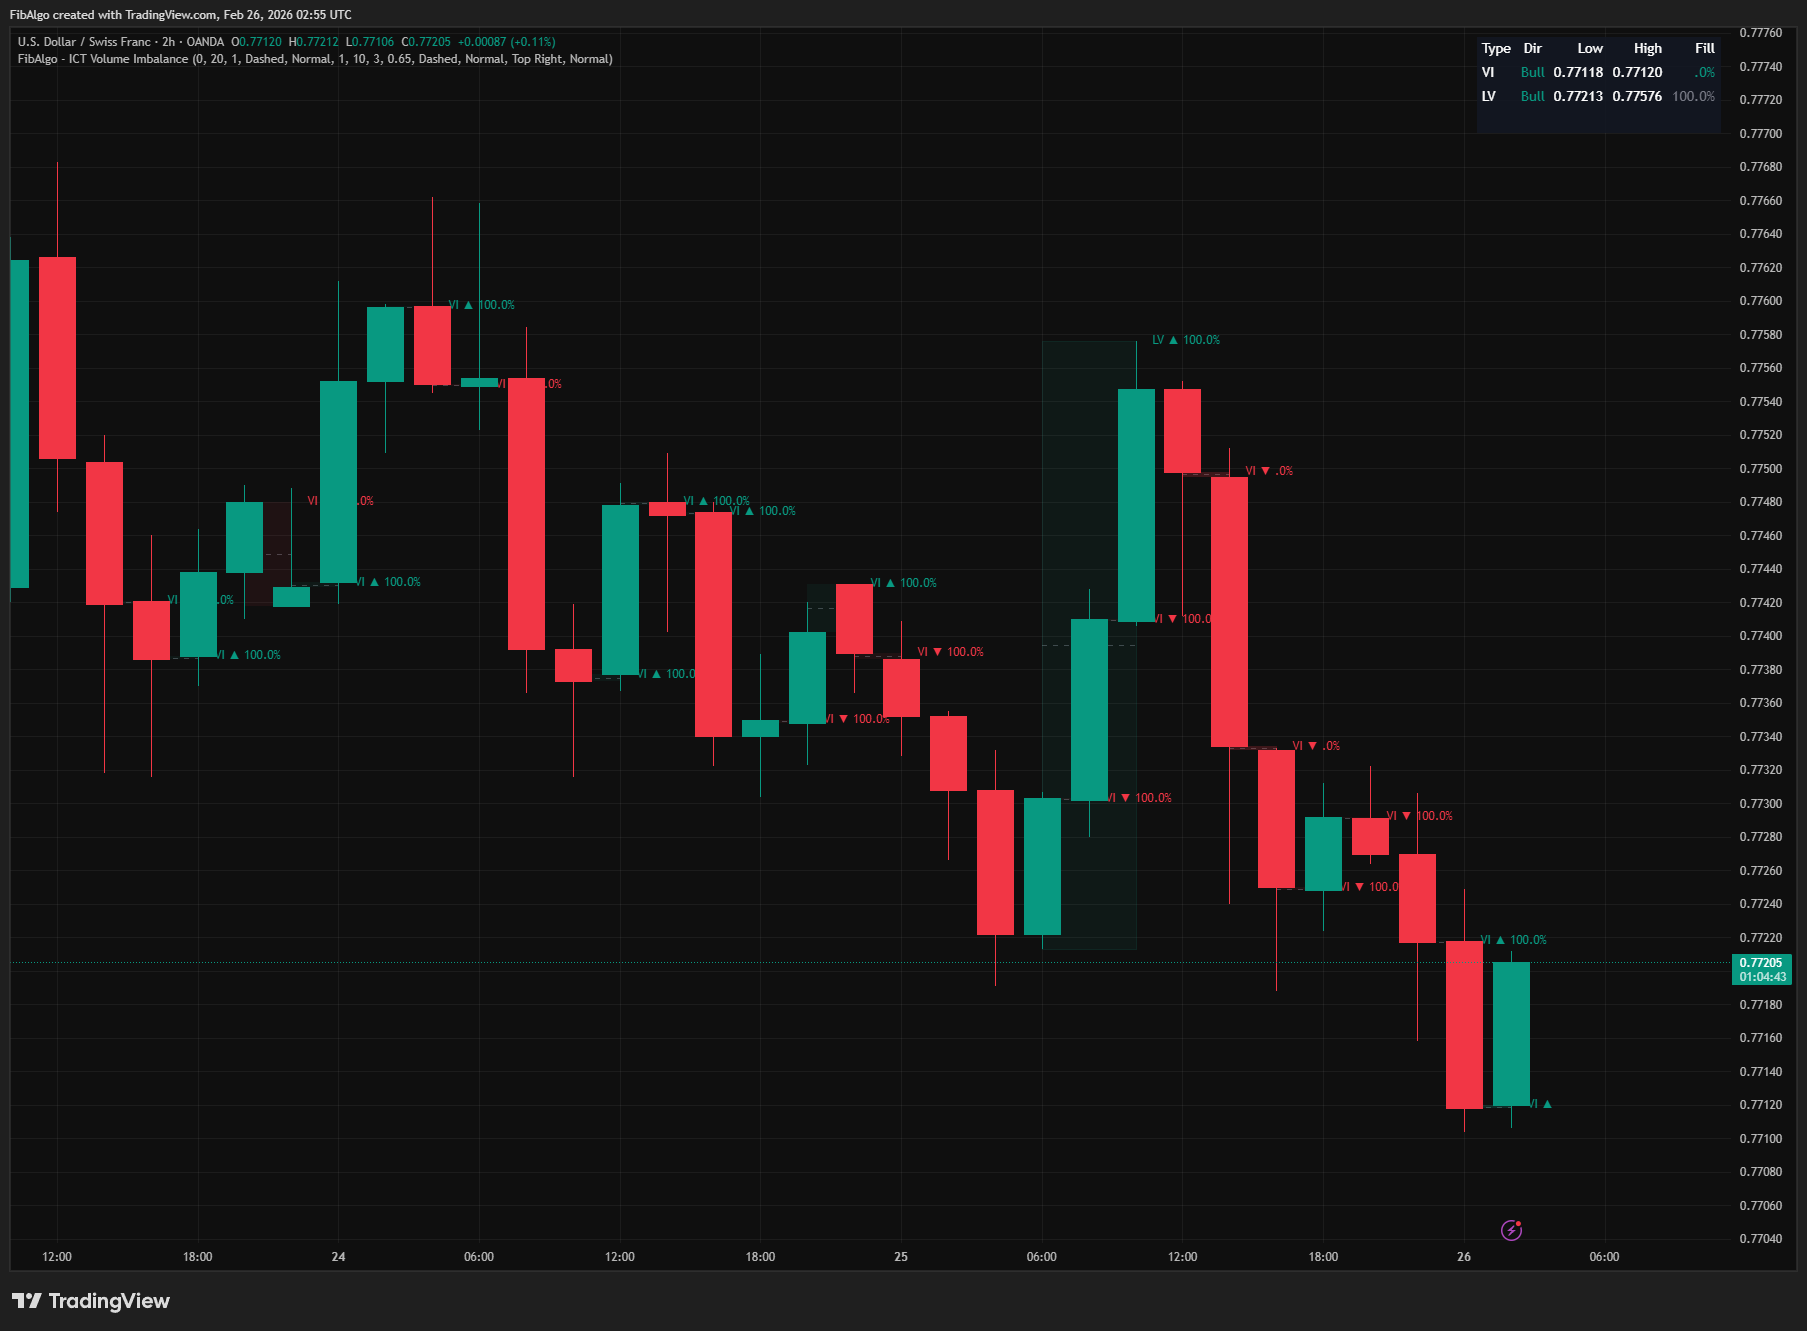
This indicator detects and visualizes two key ICT price delivery inefficiency concepts: Volume Imbalance (VI) and Liquidity Void (LV). Volume Imbalance identifies single-candle gaps between one candle's close and the next candle's open — areas where no trading occurred. Liquidity Void identifies broader zones created by multiple consecutive displacement bars moving aggressively in one direction. Both zone types are drawn as highlighted boxes with optional Consequent Encroachment (CE) midlines, real-time fill tracking (0% to 100%), and a summary table showing the latest zone data.
Key Concepts
- Volume Imbalance (VI) — A gap between the close of one candle and the open of the next candle occurring within the same session. This is NOT a session gap — it happens intrabar when the next candle opens at a different price than the previous candle closed. Bullish VI: the current candle opens higher than the previous candle's close (gap up). Bearish VI: the current candle opens lower than the previous candle's close (gap down). These gaps represent areas where no two-sided trading occurred, creating minor support/resistance zones that price tends to revisit and fill.
- Liquidity Void (LV) — A broader area of aggressive price movement where multiple consecutive candles drive in one direction with large bodies and minimal wicks. Each qualifying candle (displacement bar) has a body-to-range ratio exceeding a configurable threshold (default 65%). When three or more such bars appear consecutively in the same direction, the entire range from the lowest low to the highest high forms a Liquidity Void. Unlike a single FVG (3-candle pattern), an LV is a stacked series of inefficiencies — a "gap in price delivery" that acts as a magnet for future price action.
- Consequent Encroachment (CE) — The 50% midpoint of any VI or LV zone. ICT identifies this level as a key reaction point: price reaching the CE of a gap zone indicates that half the imbalance has been rebalanced. The CE often acts as a precision S/R level within the zone.
- Fill Tracking — Measures how much of the zone has been traded through after it was created. For a bullish zone, fill is measured from the top downward (how deep price has penetrated from above). For a bearish zone, fill is measured from the bottom upward. Fill percentage is persistent — once a level is reached, the percentage never decreases. A zone at 100% has been fully rebalanced and loses its significance.
How It Works
1. Volume Imbalance Detection On each bar after the first, the indicator compares the previous candle's close (close[1]) with the current candle's open. If there is a gap between them that meets the minimum tick threshold, a Volume Imbalance zone is created. The zone box spans from the previous bar to the current bar, with the top at the higher of the two prices and the bottom at the lower. A configurable minimum gap size (in ticks) filters out insignificant micro-gaps — set to 0 to show all gaps regardless of size. 2. Liquidity Void Detection The indicator tracks consecutive displacement bars — candles where the body size is at least a configurable percentage (default 65%) of the total range. When multiple consecutive displacement bars move in the same direction (all bullish or all bearish), a streak counter increments. When the streak ends (either a non-displacement bar appears, or the direction reverses), if the streak count meets the minimum bar threshold (default 3), the entire range of the streak is recorded as a Liquidity Void zone.The streak's highest high and lowest low define the zone boundaries. Direction changes trigger finalization of the previous streak before starting the new one. An active streak on the last visible bar is flushed with a deduplication guard to prevent duplicates on realtime bar updates.
3. Fill Tracking and Fade After a zone is created, fill tracking begins on the very next bar (zone bars themselves are excluded to avoid false instant fills). For bullish zones, fill measures how deeply price has pushed down from the zone's top: fillAmt = top - low. For bearish zones, fill measures how high price has pushed up from the zone's bottom: fillAmt = high - bottom. Fill percentage is calculated as fillAmt / zoneRange * 100 and clamped between 0% and 100%. The fill value is persistent using math.max — once price reaches a fill level, the percentage never decreases.When a zone reaches 100% fill and the "Fade When Fully Filled" option is enabled, the zone's box opacity increases significantly (becomes nearly transparent), providing a clear visual distinction between active and fully-rebalanced zones.
4. Consequent Encroachment Midline Each zone can optionally display a CE line at its exact 50% midpoint: (top + bottom) / 2. The CE line uses configurable color and style (Solid/Dashed/Dotted), and extends the same width as the zone box. When "Extend Zones" is enabled, the CE line extends rightward to the current bar alongside the box.
All alerts are one-shot per zone (each fires only once) and include the symbol and timeframe in the message. A master "Enable Alerts" toggle disables all alert processing when off.
7. Summary Table A real-time summary table displays the most recent VI and LV zones with five columns: Type (VI/LV), Direction (Bull/Bear with color coding), Low price, High price, and Fill percentage. Fill percentage is color-coded: direction color when below 50%, orange at 50%+, gray at 100%. Table position (any corner) and text size (Tiny/Small/Normal) are configurable. If a zone type has no instances, its row is omitted.
Features
- Volume Imbalance Detection — Automatically identifies gaps between consecutive candles' close and open. Supports both bullish (gap up) and bearish (gap down) with independent color settings. Configurable minimum gap size in ticks to filter noise.
- Liquidity Void Detection — Tracks consecutive displacement bars (body/range ratio threshold) to identify broad institutional price delivery gaps. Configurable minimum consecutive bar count and body ratio for sensitivity tuning.
- Consequent Encroachment (CE) Midlines — Optional 50% midpoint line drawn inside each zone. Configurable color and style (Solid/Dashed/Dotted). Key ICT precision level for reactions within the zone.
- Real-Time Fill Tracking — Persistent fill percentage (0% to 100%) updated every bar. Fill starts after zone bars to avoid false instant fills. Displayed on zone labels with configurable visibility.
- Fade on Full Fill — Zones that reach 100% fill automatically become nearly transparent, visually separating active zones from fully rebalanced ones. Optional toggle.
- Independent Zone Styling — Separate color, border width, CE color, CE style, label size, and history count settings for VI and LV. Full visual independence between zone types.
- Configurable History Depth — VI: 1–50 zones (default 20). LV: 1–30 zones (default 10). Oldest zones are auto-deleted with all drawing objects to stay within TradingView limits.
- Extend Zones Option — When enabled, all zones and CE lines stretch rightward to the current bar. When disabled, zones remain at their original formation width.
- 5 Alert Conditions — New VI, New LV, CE Touch, 50% Fill, 100% Fill. Each alert is one-shot per zone, includes symbol and timeframe, with independent toggles and a master enable switch.
- Summary Table — Displays the latest VI and LV zones with direction, price range, and fill data. Color-coded fill status. Configurable position and text size.
- Displacement Bar Sensitivity — Body/Range Ratio parameter (0.30–0.95) controls what qualifies as a displacement bar. Lower values detect more voids; higher values require stronger directional commitment.
- Minimum Gap Filter — Tick-based minimum gap size for VI detection. Eliminates insignificant micro-gaps while keeping meaningful imbalances. Set to 0 to show all.
How to Use
- VI as Intraday S/R: Volume Imbalances act as minor support and resistance zones. When price retraces to a bullish VI, expect a bounce (support). When price rallies into a bearish VI, expect a rejection (resistance). The CE midline within the VI is the most probable reaction point.
- LV as a Price Magnet: Liquidity Voids represent large areas of inefficient price delivery. ICT teaches that price must return to fill these voids — they act as magnets. When you identify an unfilled LV, expect price to eventually revisit that zone. The fill percentage tells you how much work remains.
- CE Precision Entries: The Consequent Encroachment (50%) level of any VI or LV is a high-probability reaction point. Use it as a precise entry level when price retraces into a zone. Combine with order flow confirmation or other ICT tools (Order Blocks, FVGs) for confluence.
- Fill Tracking for Zone Validity: Zones below 50% fill are still "fresh" and carry the strongest reaction potential. Zones between 50–99% have partially rebalanced but may still cause reactions at the remaining unfilled portion. Zones at 100% are fully rebalanced and generally should not be expected to provide support/resistance.
- LV + VI Confluence: When a Volume Imbalance appears within or adjacent to a Liquidity Void, the confluence strengthens both zones. The VI provides a precise gap level while the LV provides the broader institutional context.
- Combine with ICT Framework: Use VI/LV zones alongside Market Structure (trend direction), Premium/Discount (range positioning), Killzones (session timing), and Liquidity Levels (sweep targets). A bullish VI inside a discount zone during London Killzone, for example, is a high-confluence long setup.
Limitations
- Volume Imbalance detects gaps between close[1] and open — this is sensitive to the data feed. Different brokers may report slightly different open prices, which can affect which gaps appear.
- Liquidity Void detection depends on the Body/Range Ratio threshold. The default 0.65 works well for most markets, but highly volatile instruments may need a lower threshold, while range-bound markets may need a higher one.
- Fill tracking starts on the bar AFTER the zone is created. The zone formation bars are excluded to prevent false instant fills (since the candle that creates a VI typically has a low/high that would immediately register as fill).
- Fill percentage is persistent and never decreases. A zone that briefly wicked to 80% fill then reversed will permanently show 80%+ even if price moves away. This reflects ICT's concept that partially filled zones retain significance at the unfilled portion.
- The "Extend Zones" option extends ALL visible zones to the current bar, which can create visual clutter on charts with many zones. Consider reducing History Count when using this feature.
- Drawing object limits: TradingView allows 500 boxes, 500 lines, and 500 labels. Each zone uses up to 3 objects (box + CE line + label). With default settings (20 VI + 10 LV = 30 zones), this uses at most 90 objects — well within limits. Increasing both history counts significantly on low timeframes may approach these limits.
- Liquidity Void detection on very low timeframes (1m or less) may produce many small voids. Consider increasing the Minimum Consecutive Bars or Body/Range Ratio on lower timeframes.
- This indicator identifies price delivery inefficiencies — it does not generate buy/sell signals. Use it within the broader ICT framework alongside Market Structure, Order Blocks, Fair Value Gaps, Premium/Discount, Killzones, and Liquidity Levels for complete trade setups.