Overview
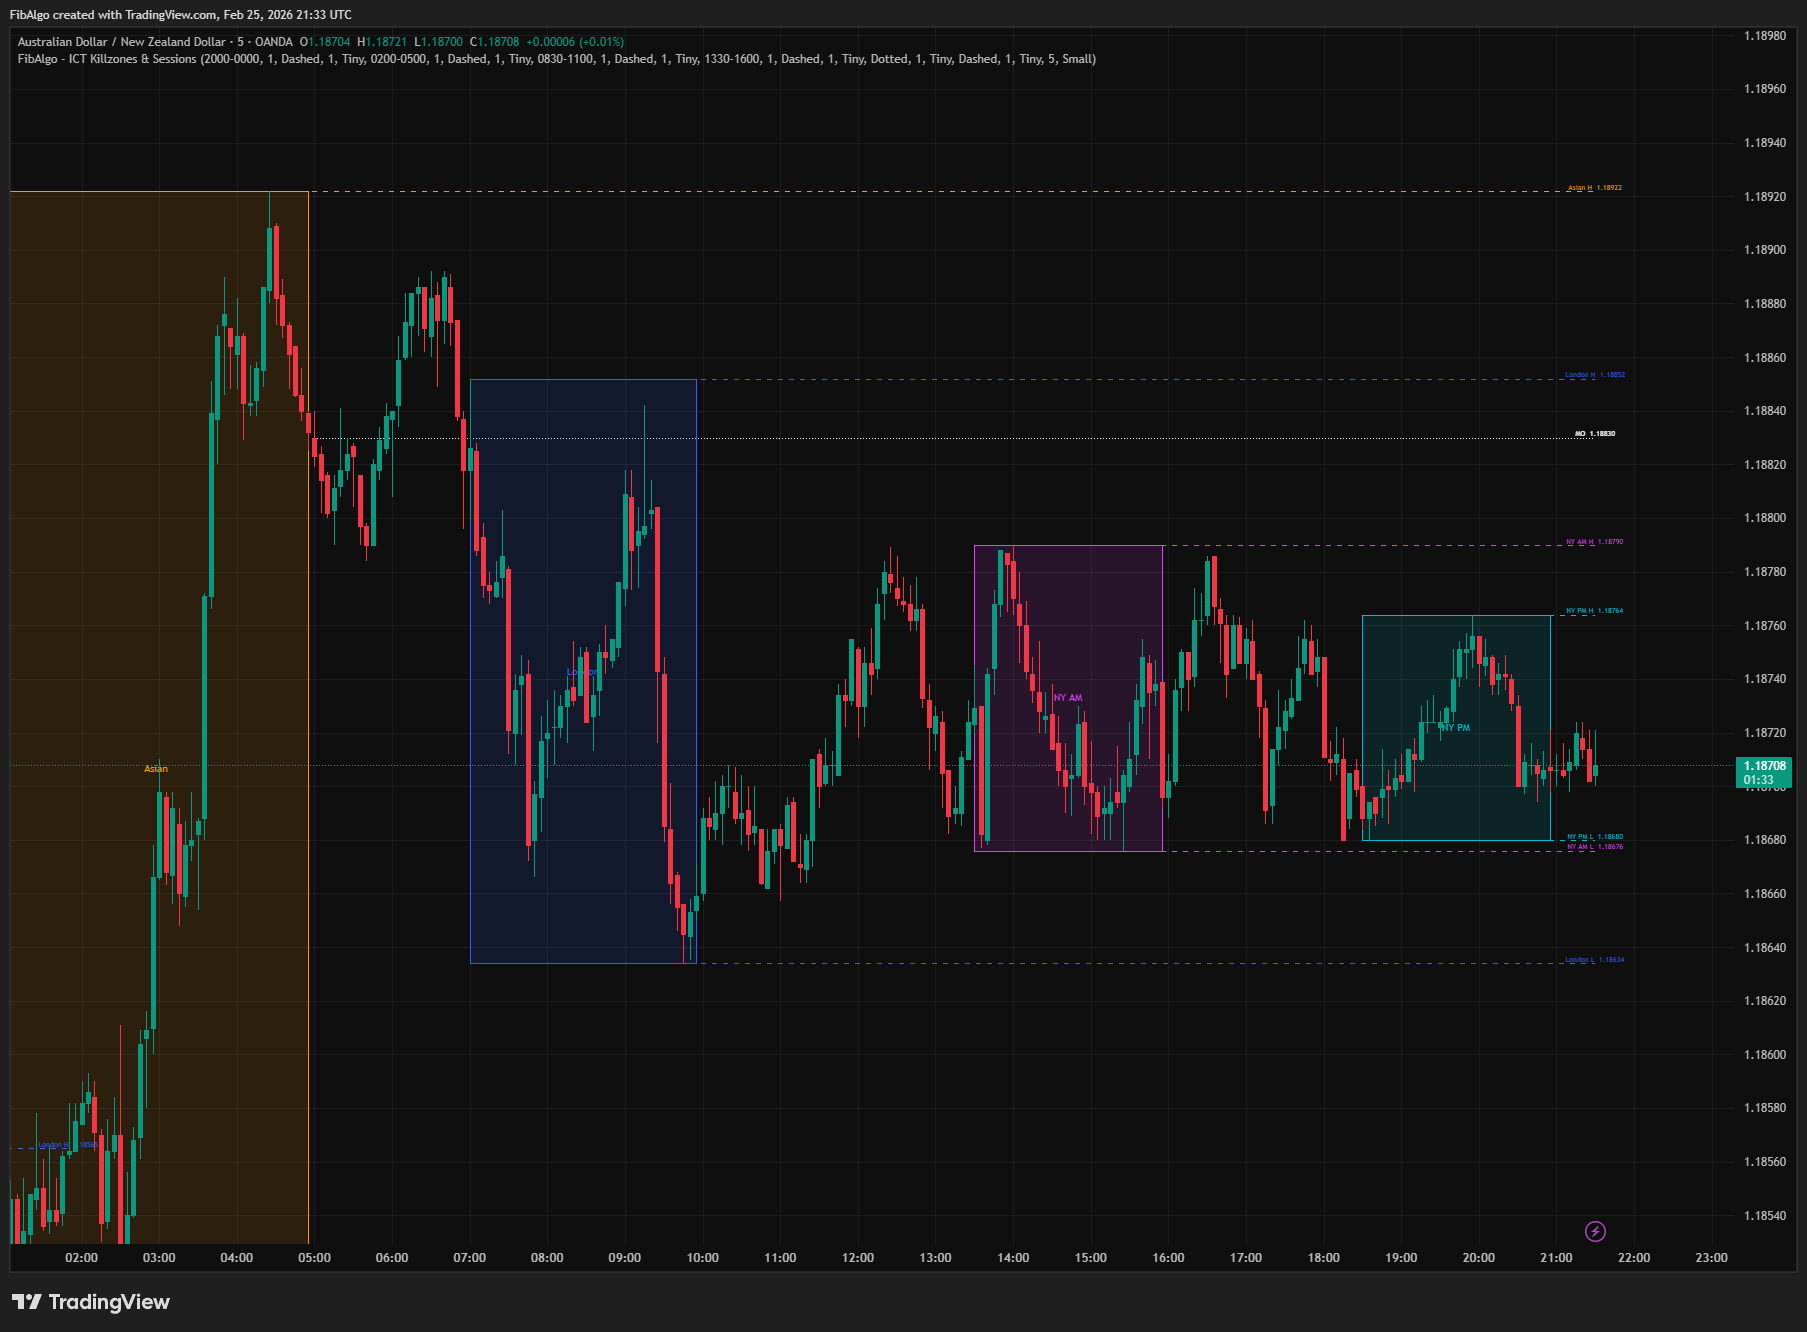
This indicator highlights ICT (Inner Circle Trader) Killzones — the specific time windows during the trading day when institutional order flow is most active. It draws colored session boxes for the Asian, London, New York AM, and New York PM killzones, tracks each session's high and low with extending lines, and plots the Midnight Open (MO) and True Day Open (TD) reference levels. Every visual element is independently configurable per killzone with its own color, line style, label, and toggle.
Key Concepts
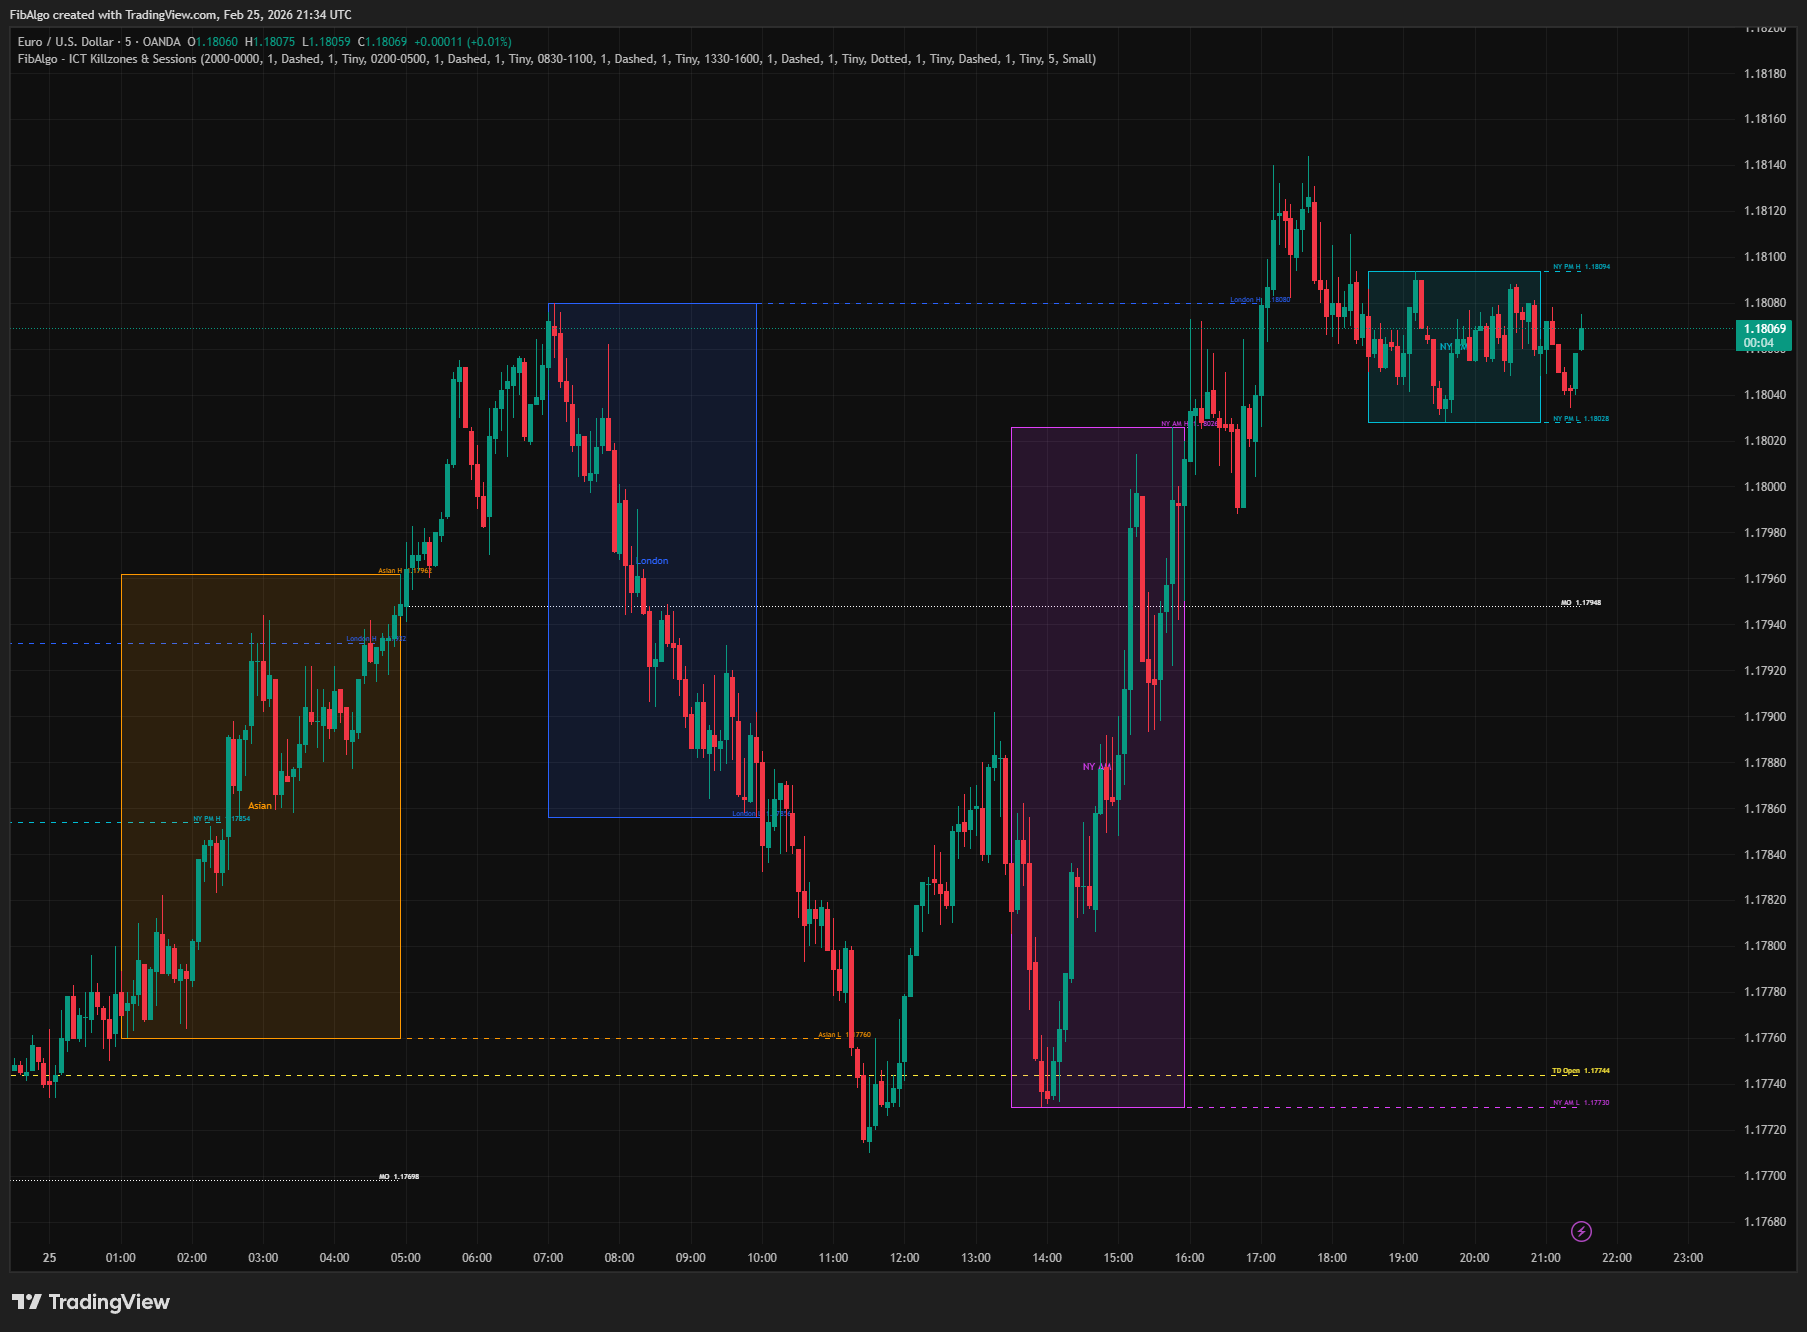
- Asian Killzone (20:00–00:00 ET) — The Asian session establishes the initial range of the day. This range acts as a liquidity pool that London and New York sessions target — price often sweeps the Asian high or low before reversing. ICT traders use the Asian range as a reference for the day's directional bias.
- London Killzone (02:00–05:00 ET) — The London open is the most significant session transition. It frequently sets the high or low of the day (HOD/LOD). Institutional players use this window to run stops placed during the Asian session and establish the day's trend direction.
- New York AM Killzone (08:30–11:00 ET) — The highest-volume session, coinciding with the US equity open and major economic releases. NY AM often targets and sweeps the levels established during London, creating continuation or reversal setups.
- New York PM / London Close (13:30–16:00 ET) — As London closes, a second wave of institutional activity occurs. Positions are squared, and the daily range often completes or reverses during this window.
- Midnight Open (MO) — The price at 00:00 ET marks the start of the new calendar day. ICT uses this level as a directional filter: price trading above MO suggests bullish bias, below suggests bearish. Acts as an intraday support/resistance level.
- True Day Open (TD) — The price at 18:00 ET (6 PM) when CME futures open for the new trading day. This is ICT's "true" daily open — more significant than the midnight open for futures traders. It marks where institutional positioning begins for the new session.
How It Works
1. Killzone Detection The indicator converts bar timestamps to Eastern Time (ET) and checks whether the current bar falls within each killzone's time window. Session times are fully configurable — you can adjust them from the settings panel. Overnight sessions (e.g., Asian 20:00–00:00) are handled correctly by detecting when start time is greater than end time. 2. Session Boxes When a killzone begins, a colored box is drawn from the first bar's high/low. As the session progresses, the box expands rightward and adjusts its top/bottom to track the session's developing high and low. The killzone name is displayed centered inside the box. Box color, border width, and label size are all independently configurable per killzone.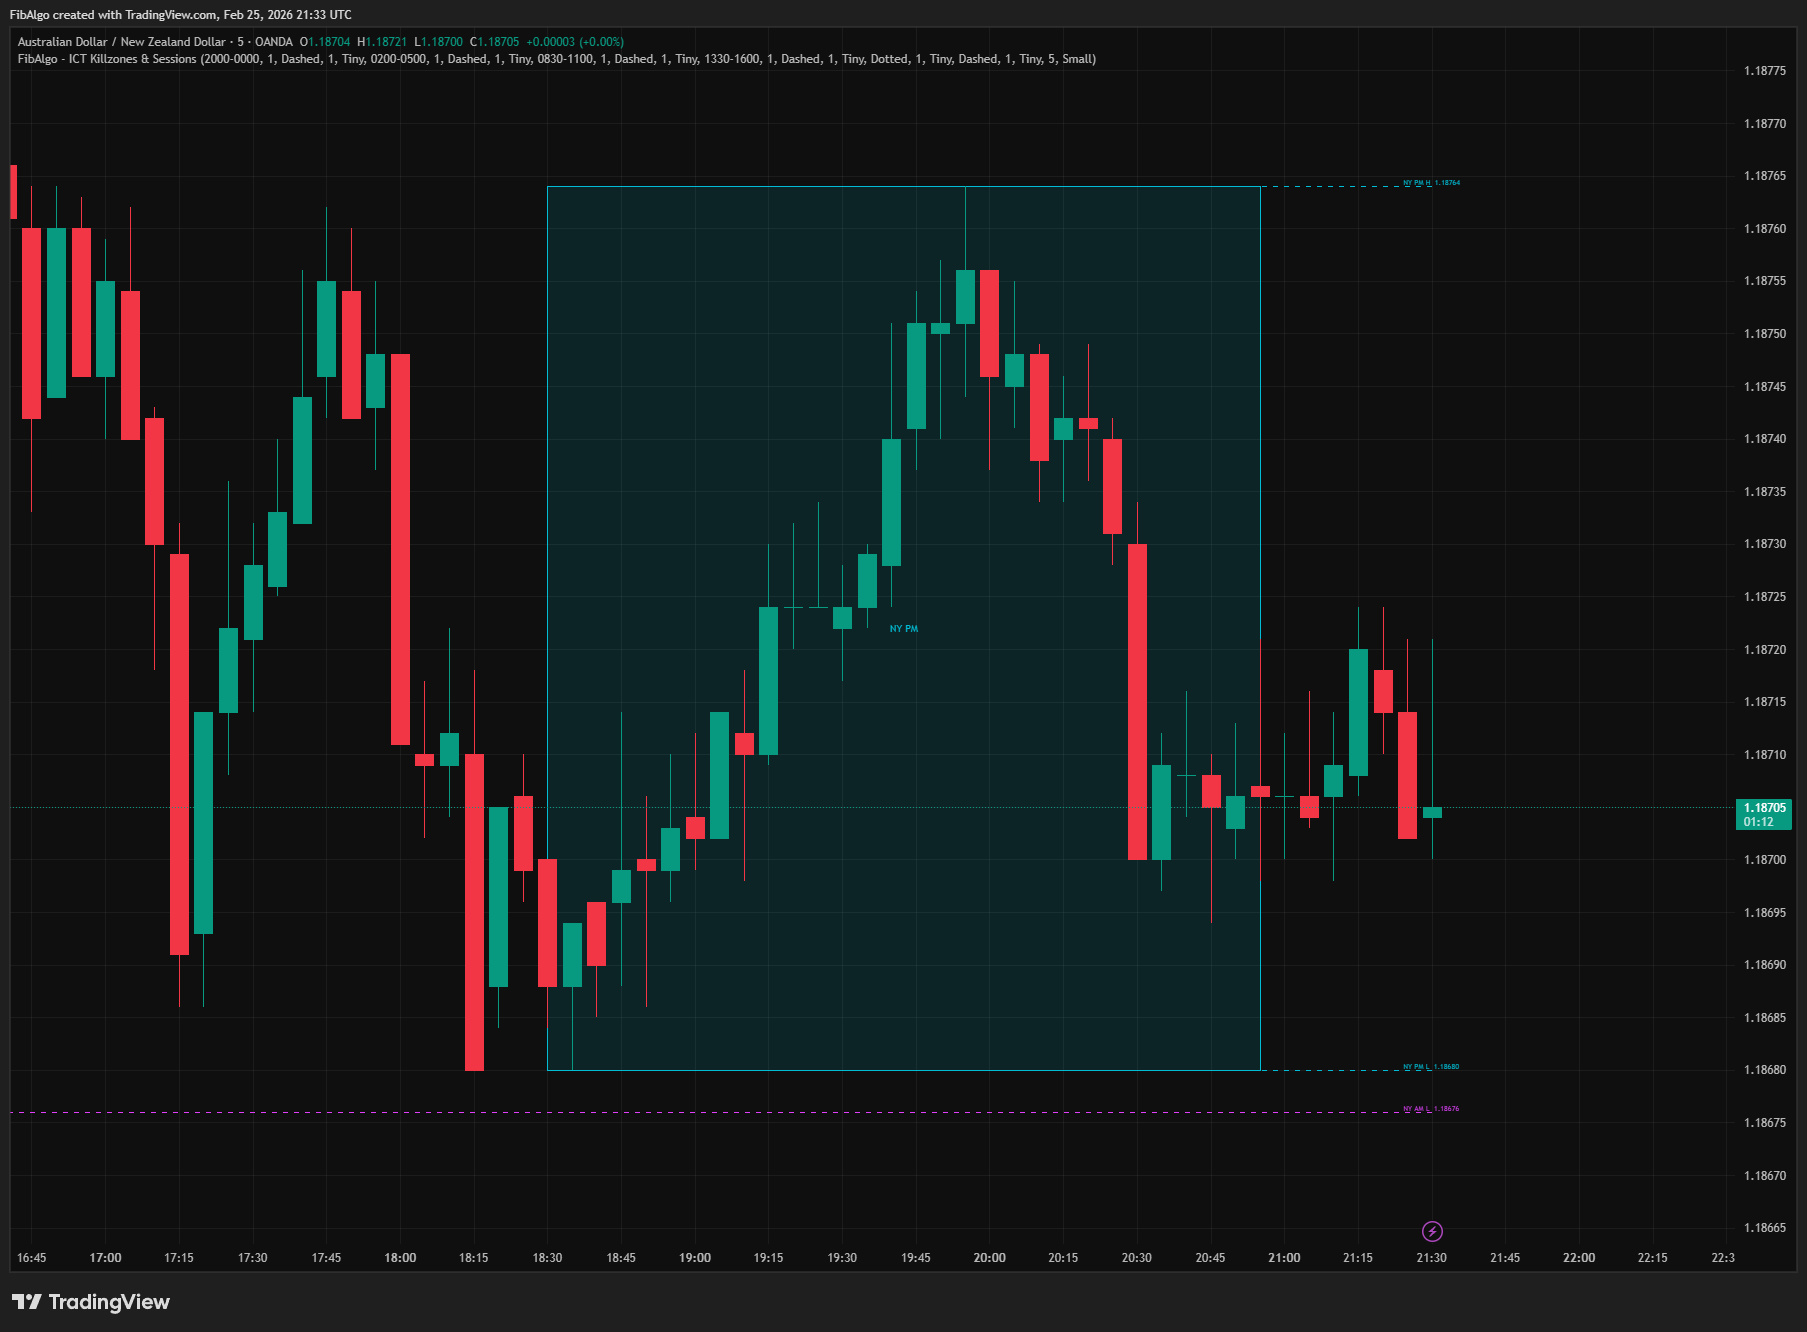
- When price closes above the session high, the high line stops extending — the level has been broken.
- When price closes below the session low, the low line stops extending.
- Each side (high/low) is independent — the high can break while the low continues extending.
- A "Session H/L Break" alert fires when extension stops (if enabled).
Features
- 4 ICT Killzones — Asian, London, New York AM, New York PM / London Close. Each with colored session boxes and centered killzone name labels.
- Per-Killzone Controls — Independent settings for each killzone: enable/disable, time window, box color, border width, H/L line color, line style, line width, label show/size, extend toggle.
- Session High/Low Lines — Horizontal lines at each session's high and low, updating in real time during the session.
- Smart Extension — H/L lines extend beyond the session until price closes beyond the level. High and low tracked independently — broken side stops, intact side continues.
- Midnight Open (MO) — 00:00 ET opening price. ICT directional bias filter — bullish above, bearish below.
- True Day Open (TD) — 18:00 ET opening price. The institutional daily open for futures markets.
- Multi-Day History — Configurable history depth (1–30 days). Killzone boxes, MO lines, and TD lines all respect the same history window.
- Configurable Time Windows — All killzone times are adjustable via input.session() — adapt to your specific market or trading style.
- Overnight Session Support — Asian killzone (20:00–00:00) and similar cross-midnight sessions handled correctly.
- Timeframe Guard — Automatically detects non-intraday charts and displays a warning message. Killzones only render on intraday timeframes.
- Touch Detection — Alerts when price touches the Midnight Open or True Day Open level for the first time.
- Advanced Alert System — 11 individual alert toggles: Start/End for each killzone (8), MO Touch, TD Touch, Session H/L Break. Master enable toggle.
- Clean Visual Design — Opaque line colors (separate from transparent box fills), centered box labels, flat label style (no balloon), minimal chart clutter.
How to Use
- Identify Active Sessions: Colored boxes show exactly when each killzone is active. Focus your trading during these windows — this is when institutional order flow creates the largest moves.
- Asian Range as Target: Mark the Asian session high and low. During London and NY, watch for price to sweep one side of the Asian range — this often precedes the day's directional move.
- London Sets the Day: The London killzone frequently establishes the HOD or LOD. If London sweeps the Asian high and reverses, the day is likely bearish (and vice versa).
- NY AM for Entries: Use the NY AM killzone for trade entries. It often targets London's high or low, creating displacement moves into Order Blocks and Fair Value Gaps.
- MO and TD as Bias Filters: If price is above both MO and TD, bullish bias is confirmed. Below both, bearish. Mixed signals suggest ranging conditions or pending reversal.
- H/L Break Alerts: When a session's H/L line stops extending (level broken), it confirms that the liquidity at that level has been taken. Use this as confirmation for continuation or reversal.
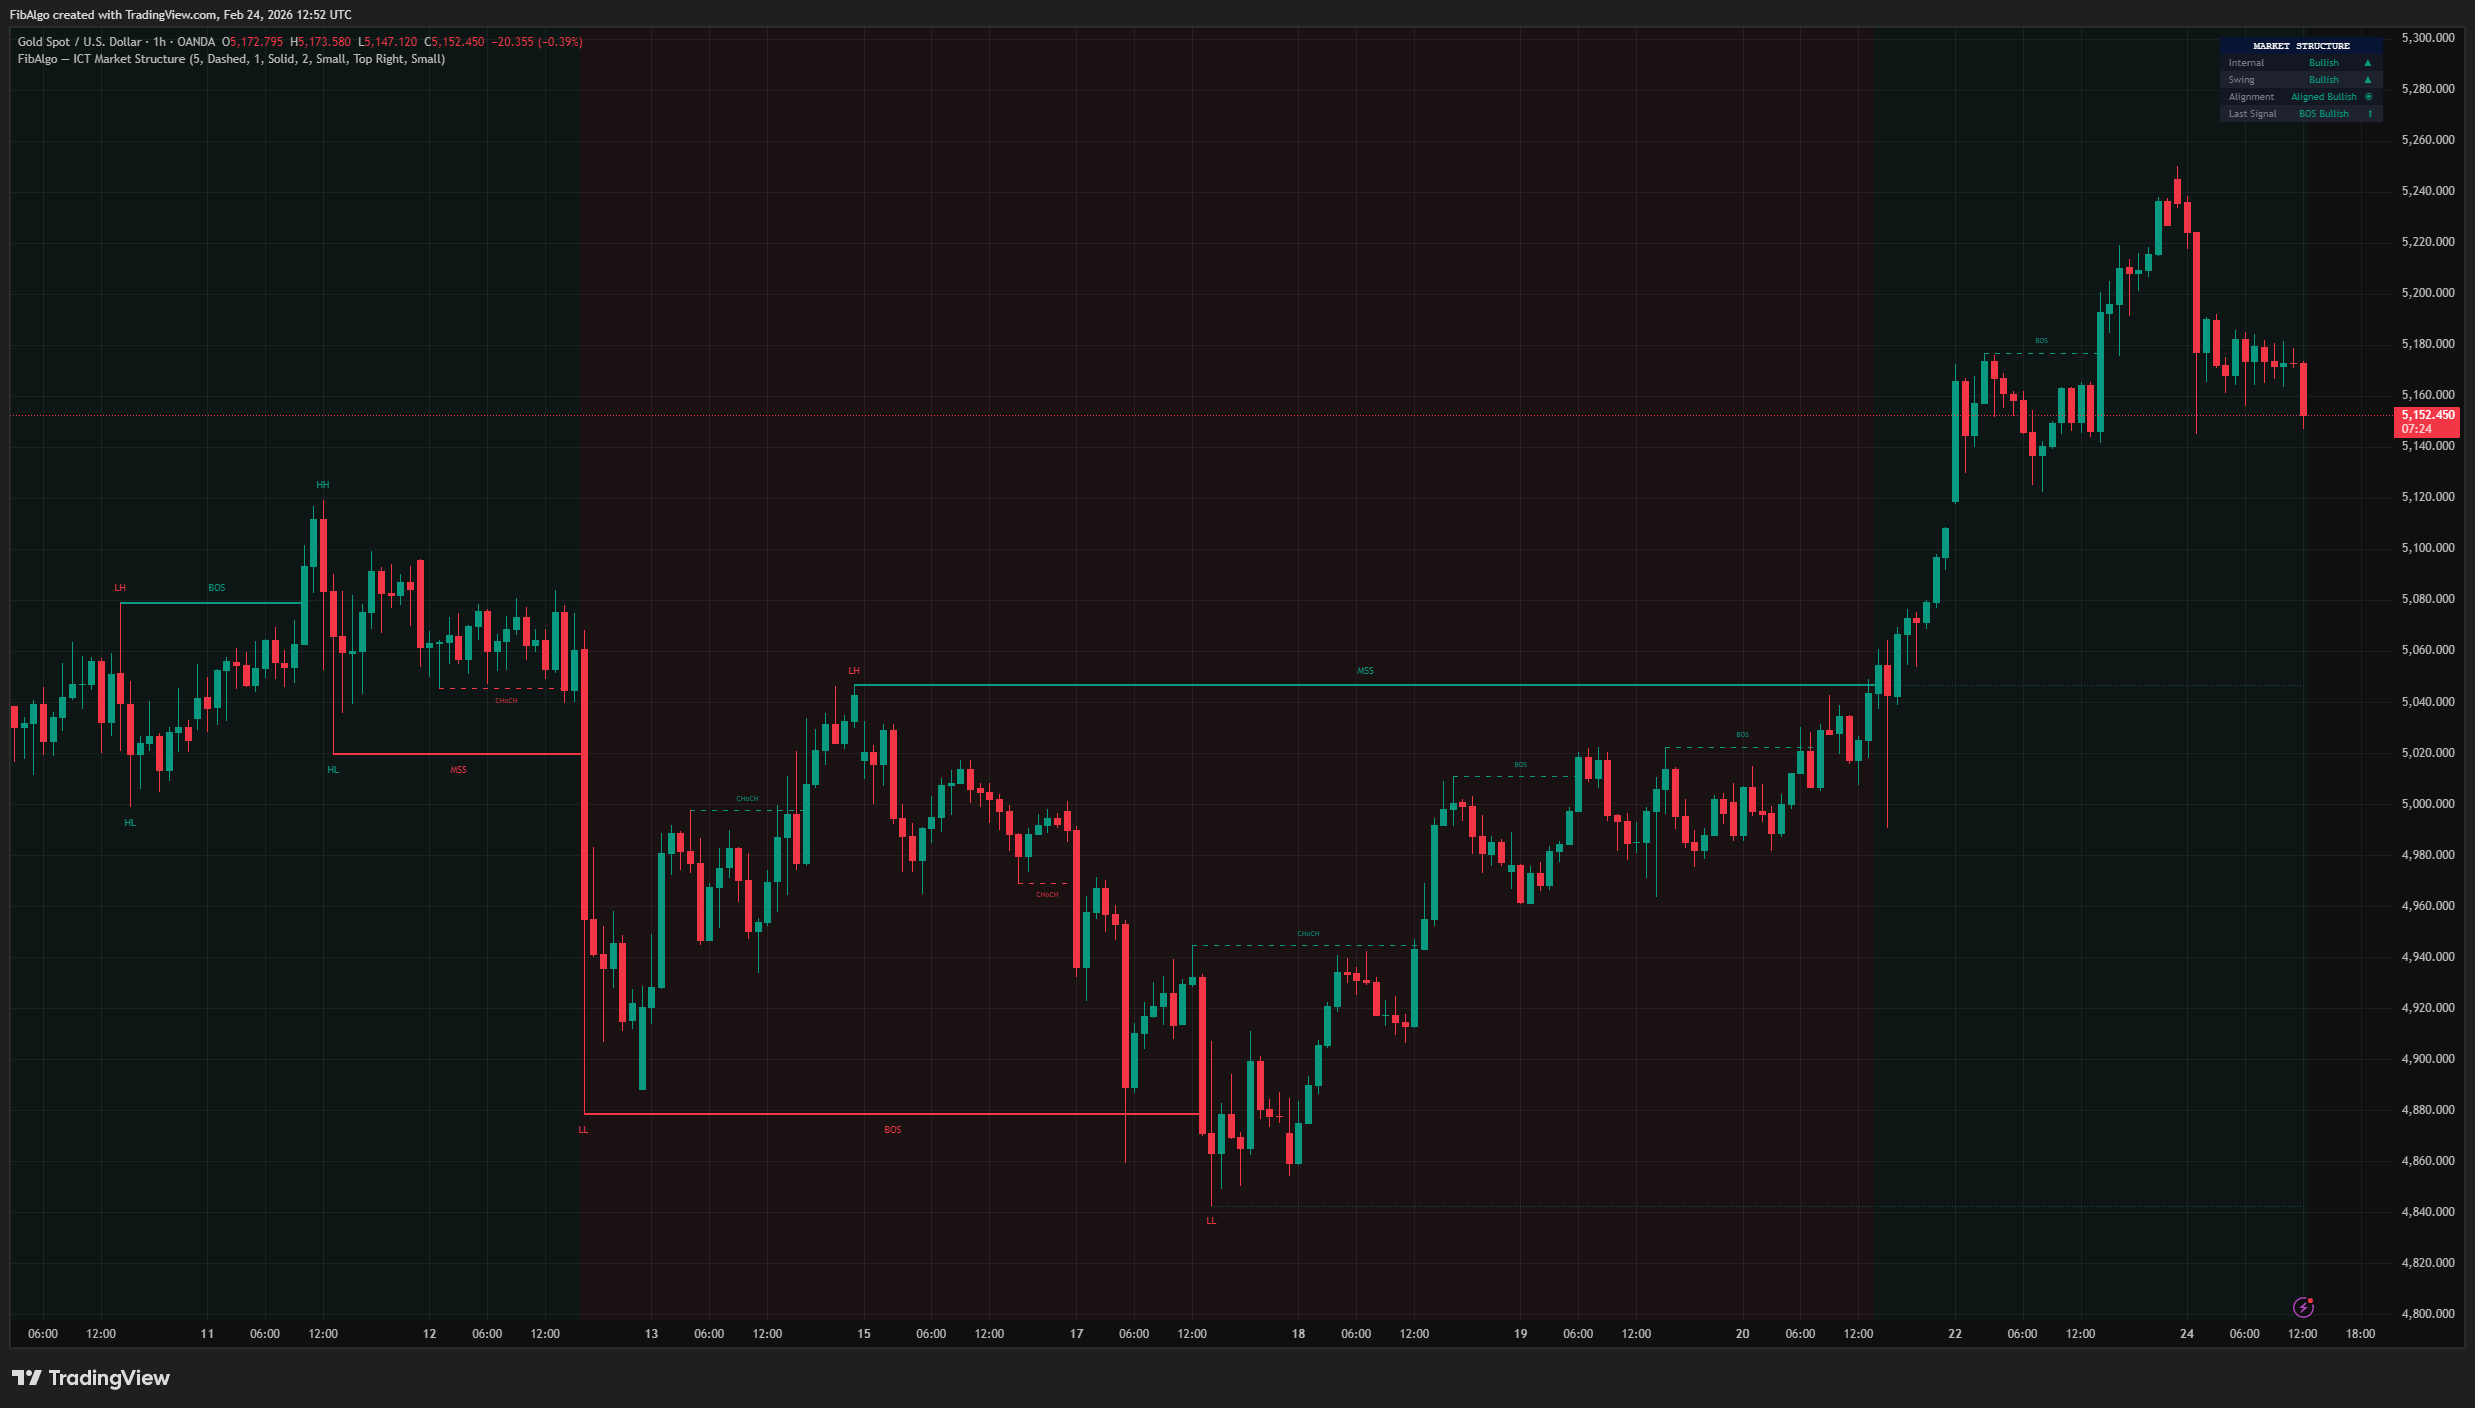
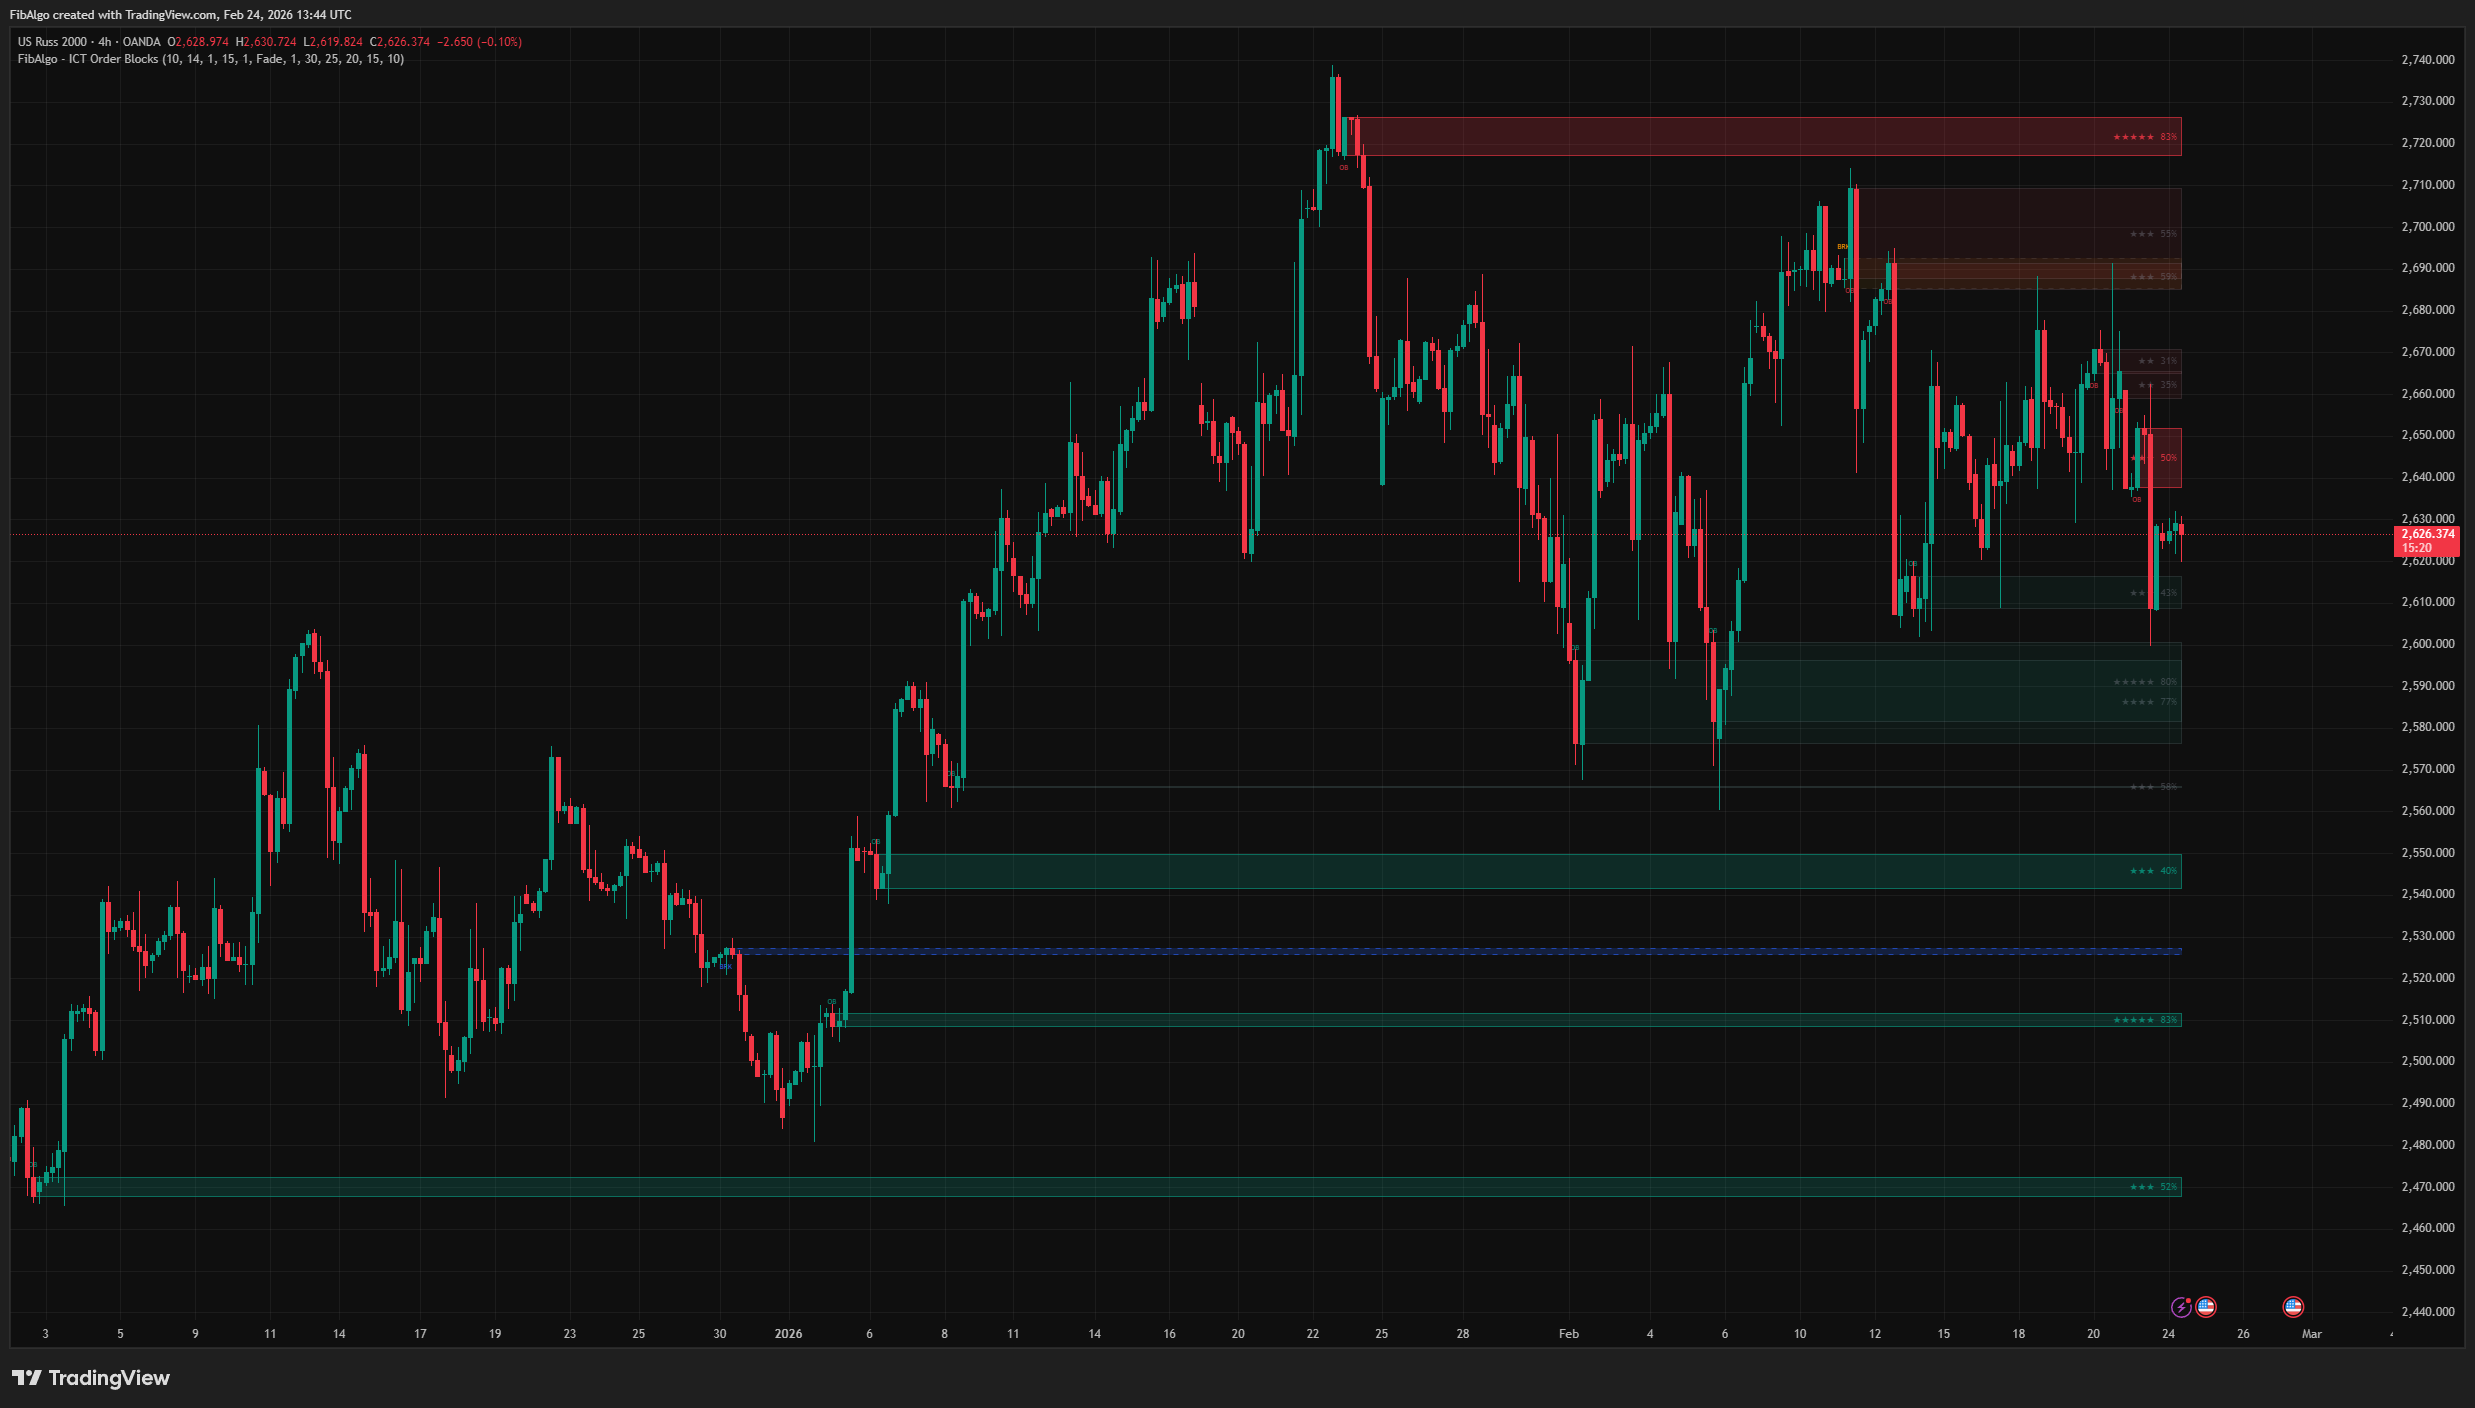
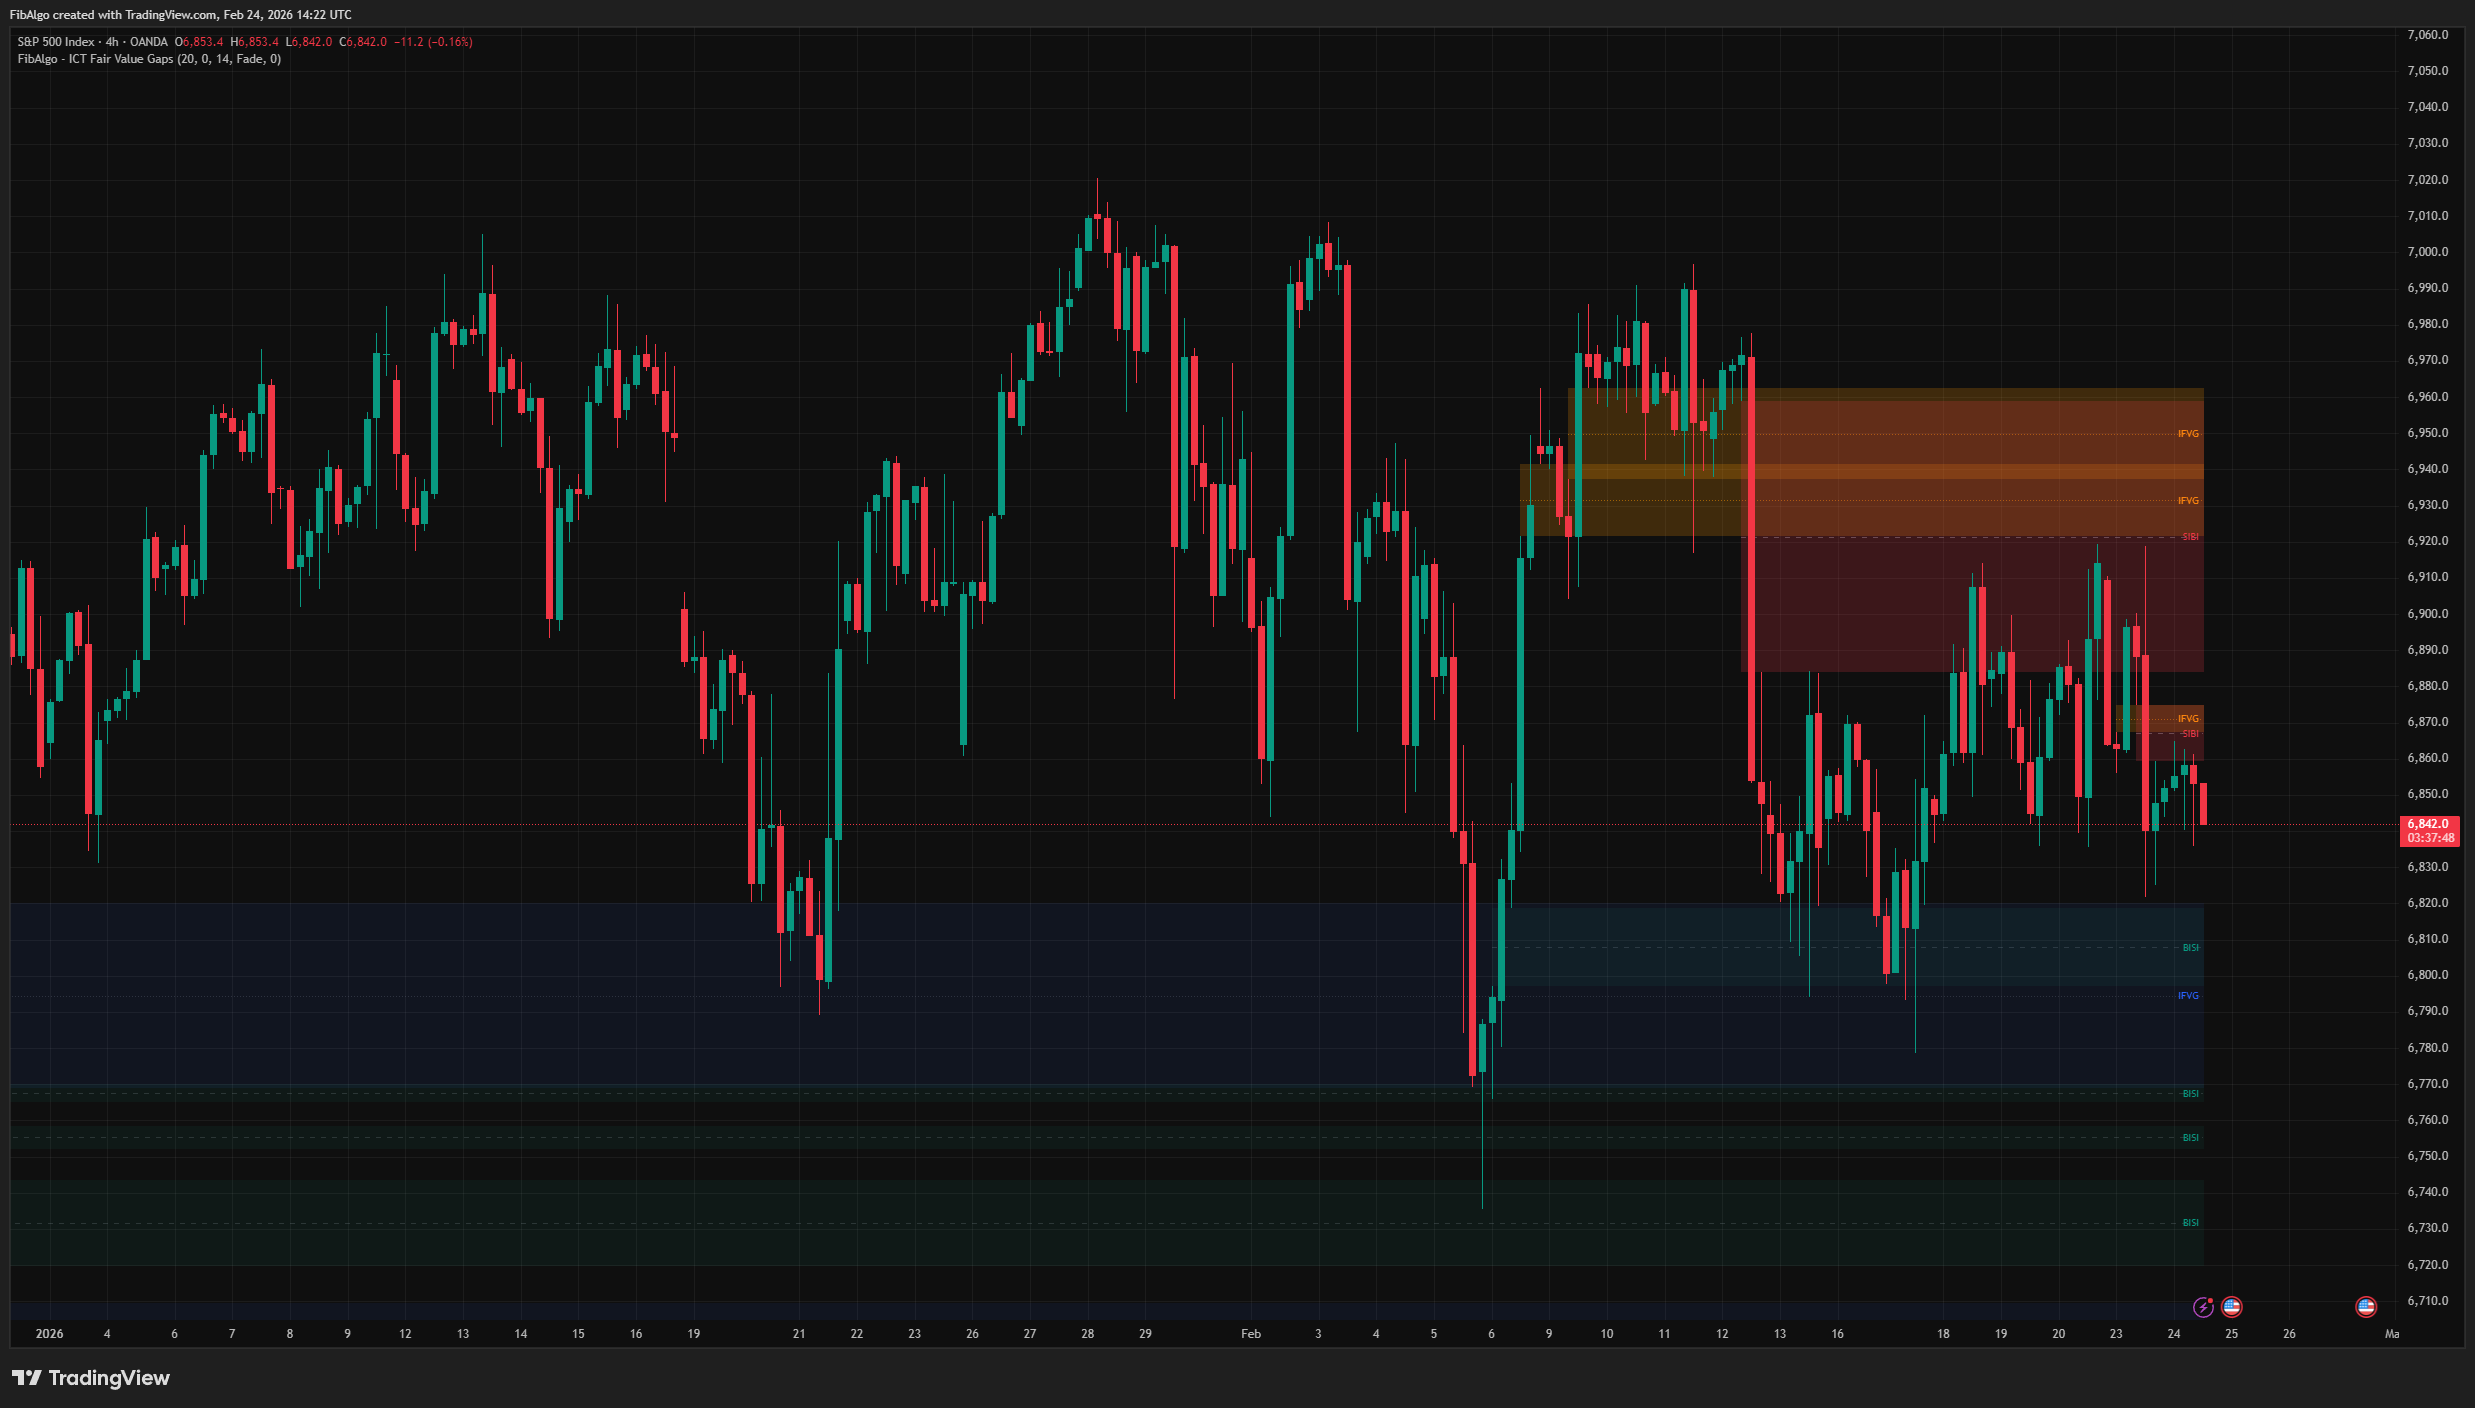
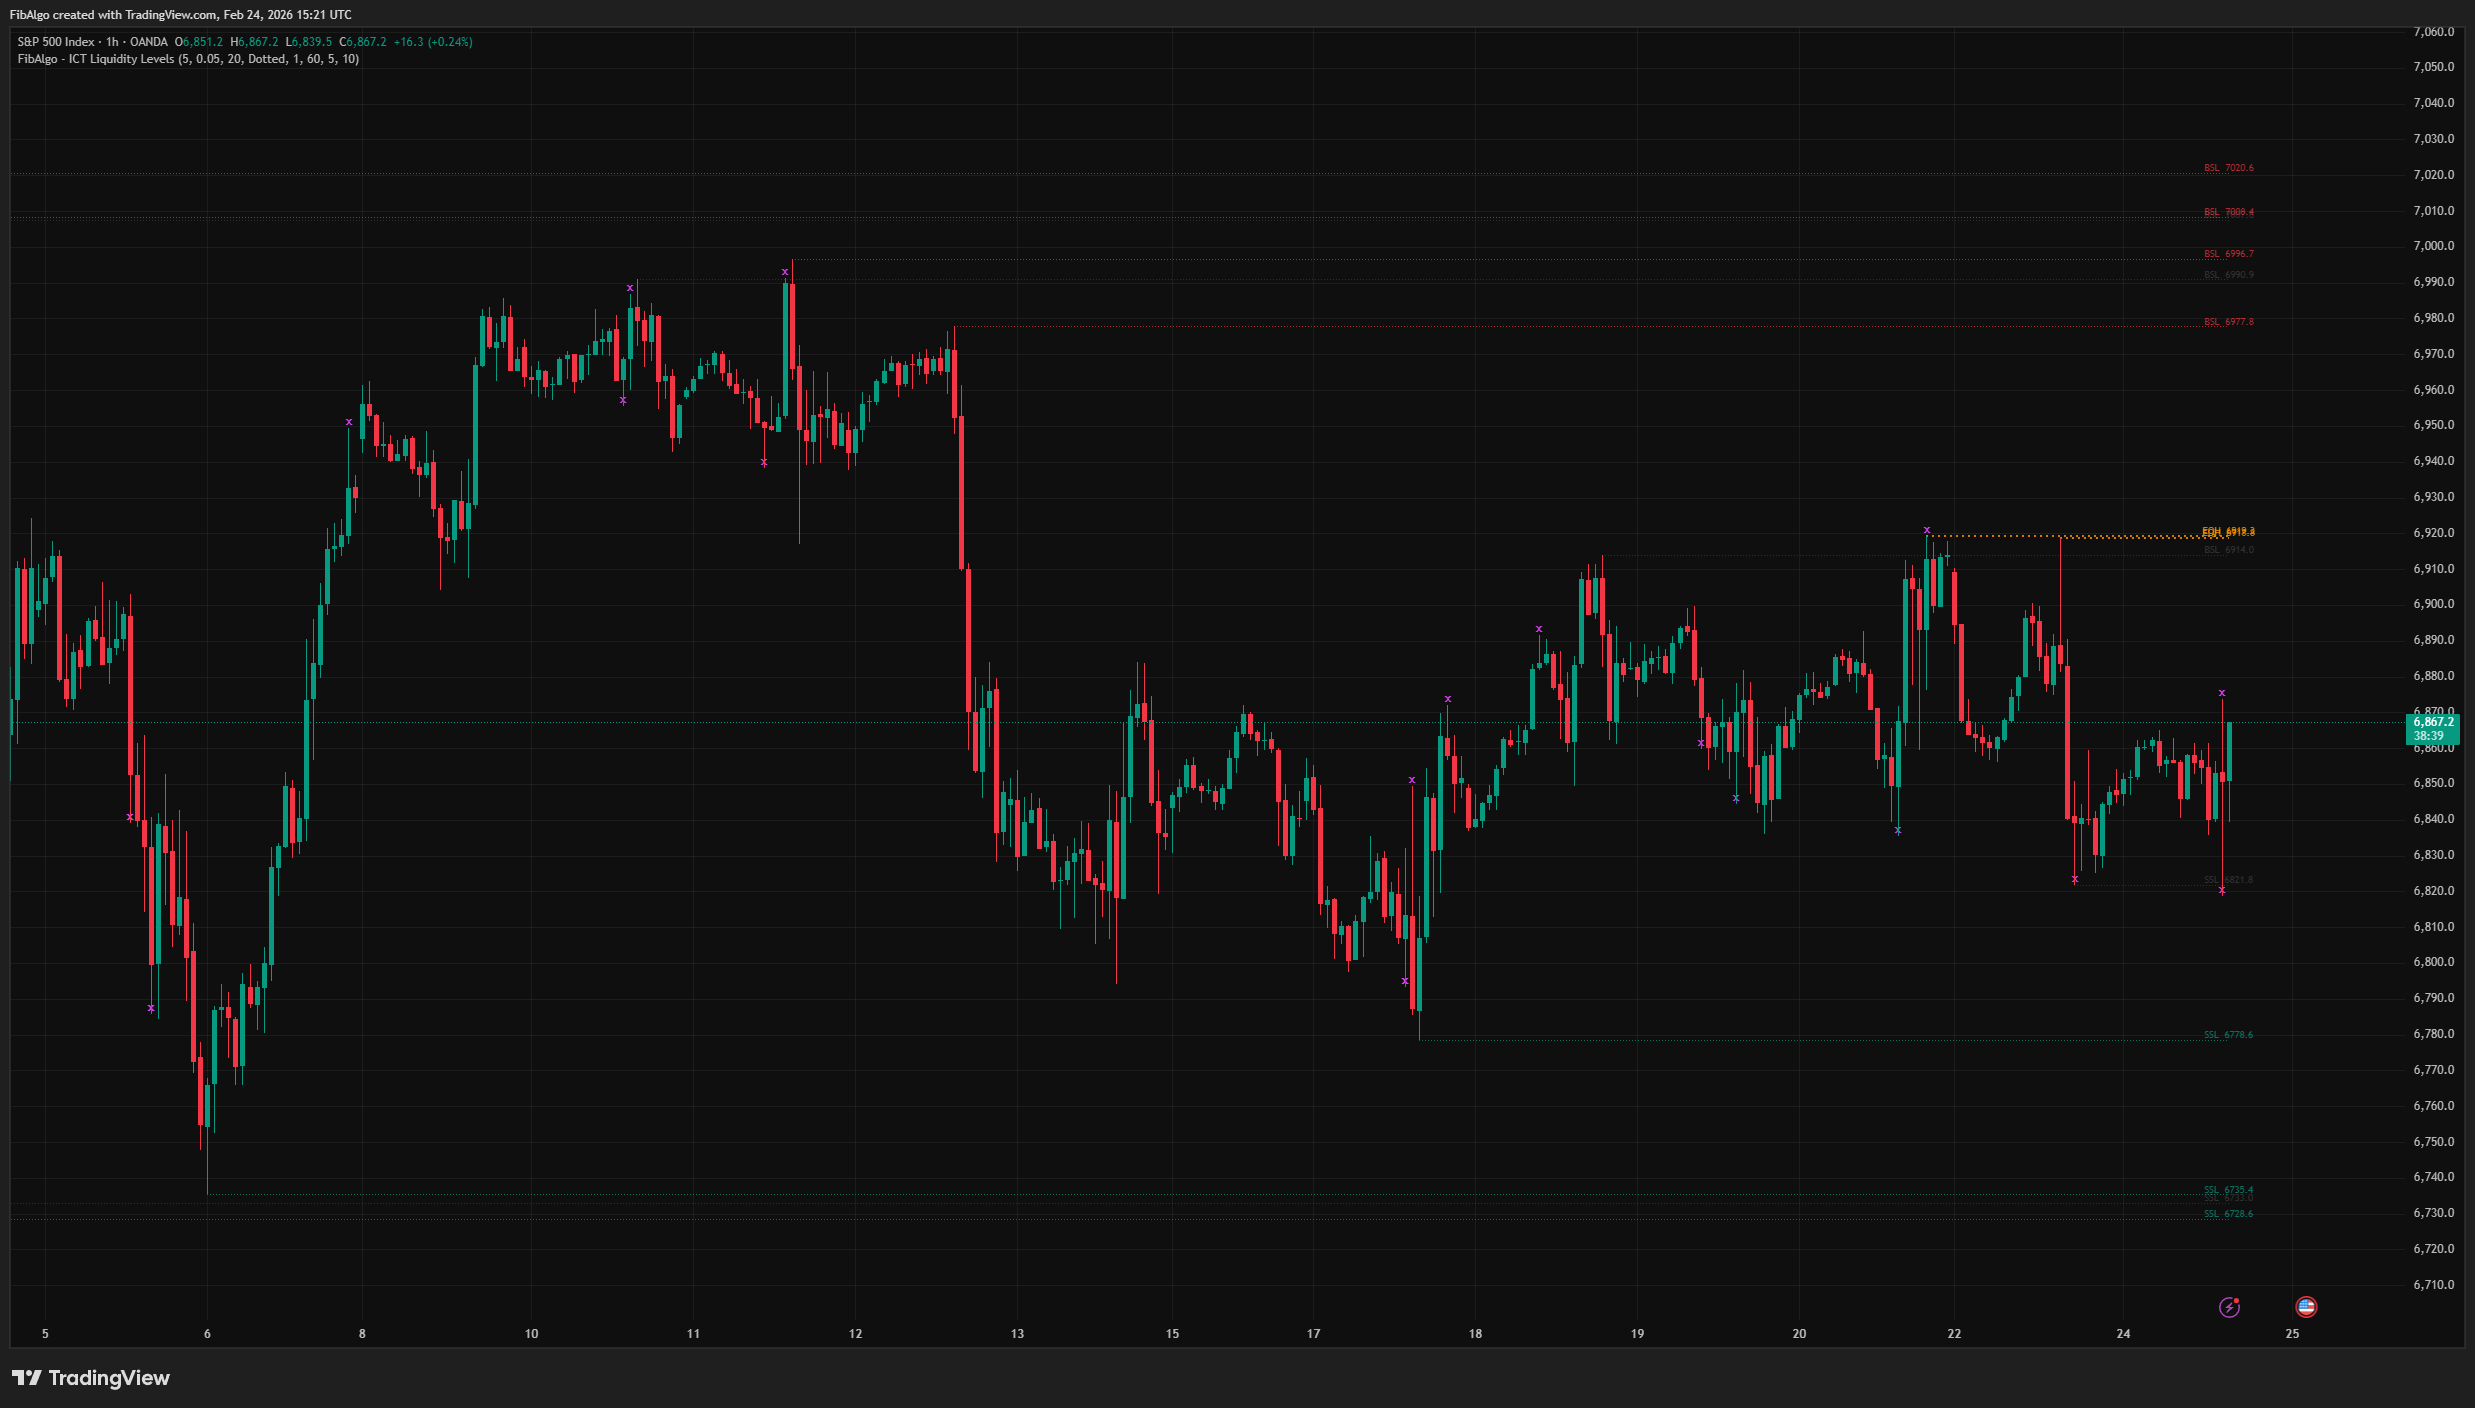
- Combine with ICT Tools: Killzones tell you WHEN to trade. Pair with Order Blocks (WHERE price reacts), Fair Value Gaps (WHERE price rebalances), Liquidity Levels (WHERE stops rest), and Market Structure (WHICH direction) for complete ICT analysis.
Limitations
- This indicator is designed for intraday timeframes only (1m to 4H). On daily or higher charts, killzone detection cannot function — the indicator displays a warning message and disables rendering.
- Session times are in Eastern Time (ET / America/New_York). They automatically adjust for US Daylight Saving Time. If you trade instruments in other timezone conventions, adjust the time windows accordingly.
- Midnight Open captures the opening price of the first bar at or after 00:00 ET. On higher intraday timeframes (e.g., 4H), this may not be exactly midnight — it will be the first available bar's open.
- True Day Open captures the opening price at or after 18:00 ET. On charts that do not have bars at 18:00 (weekend gaps, holidays, or instruments with limited hours), the TD line may not appear for that day.
- The "Extend H/L Beyond Session" feature stops a line when close breaks the level. A wick beyond with close inside does not stop extension — only a closing break counts.
- This indicator marks time-based killzones and key opening levels — it does not generate buy/sell signals. Use it alongside Order Blocks, Fair Value Gaps, Liquidity Levels, and Market Structure analysis for complete ICT trade setups.
Tags
#Sessions & Time#Smart Money#Price Action