Overview
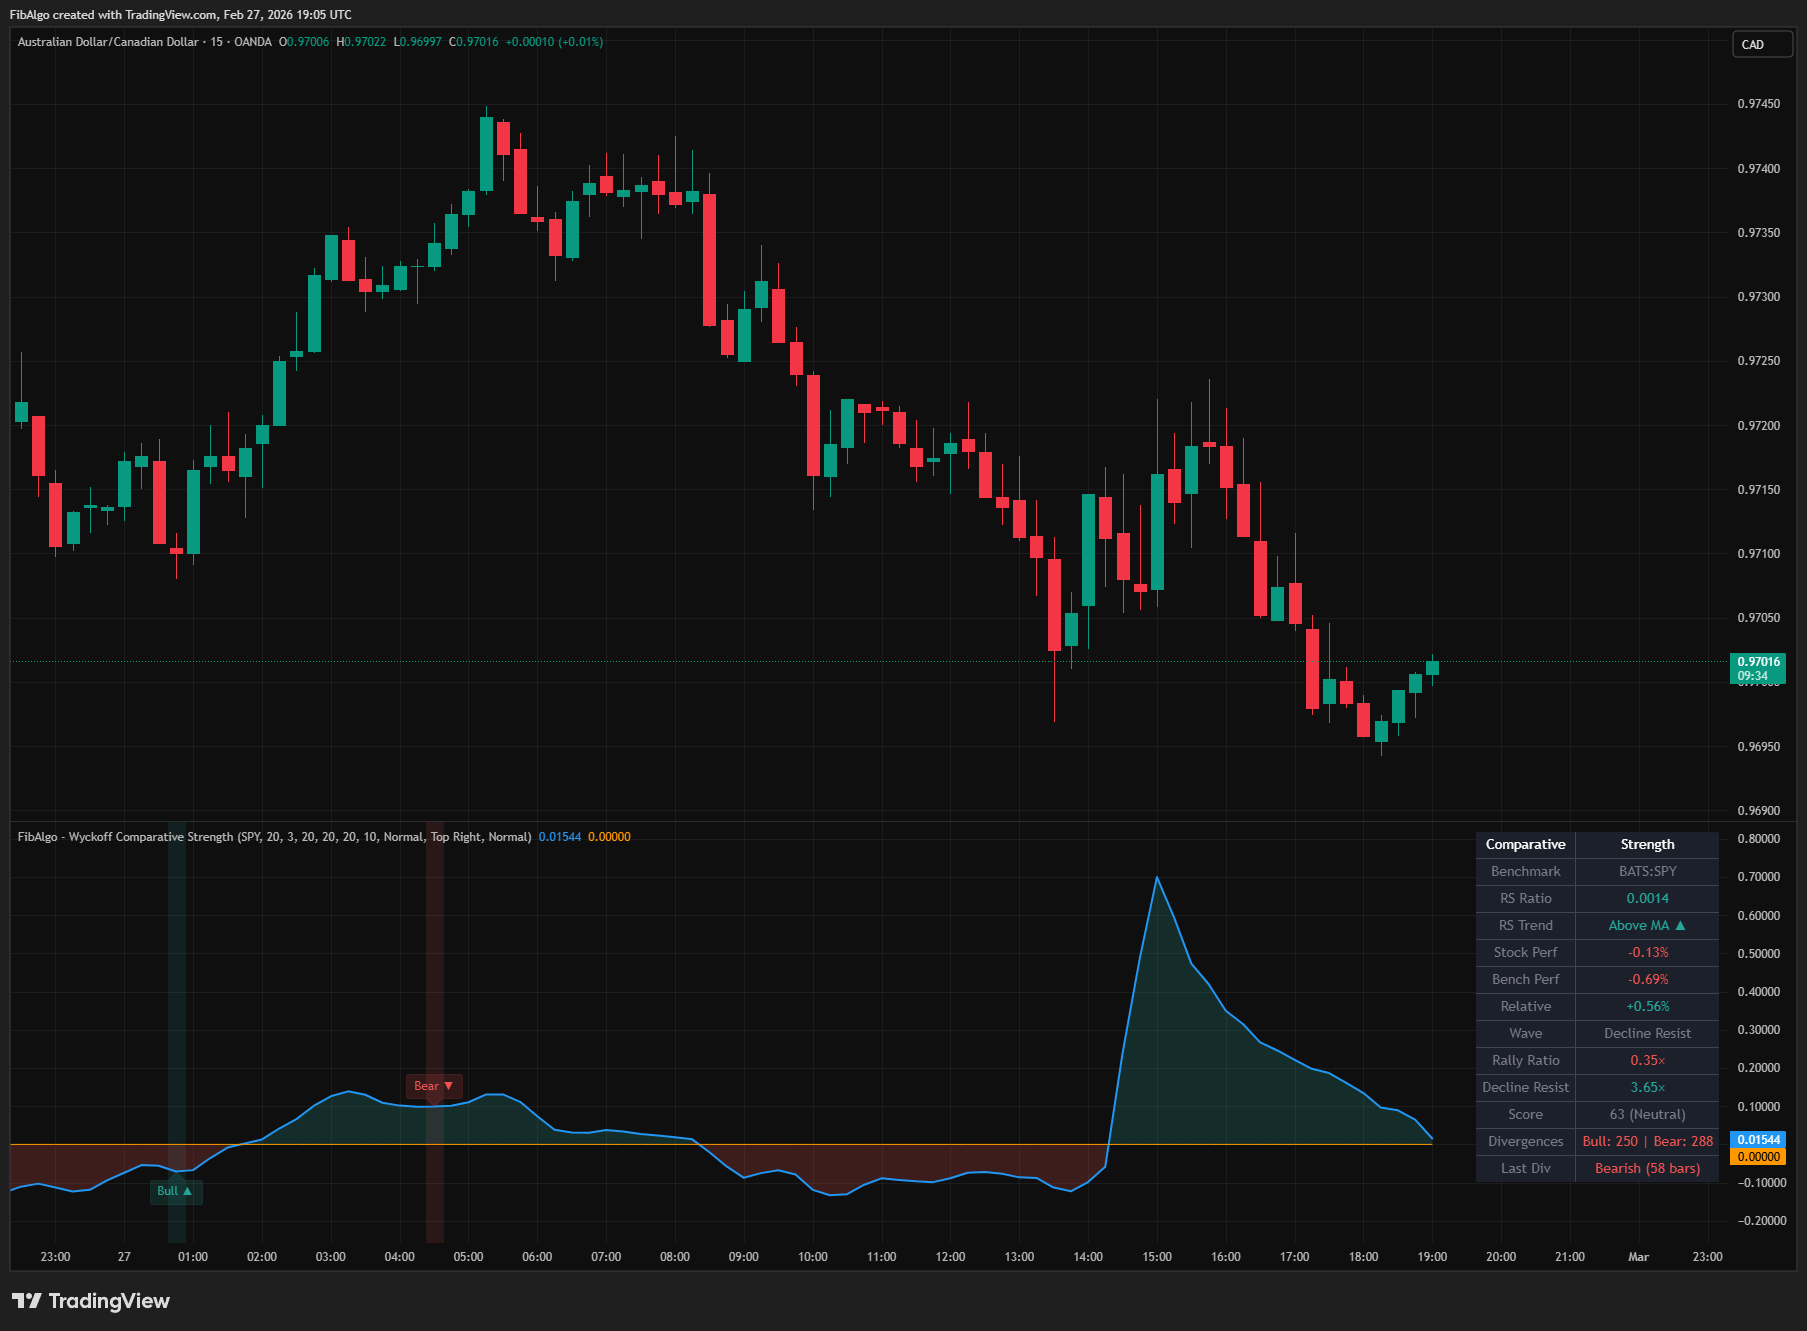
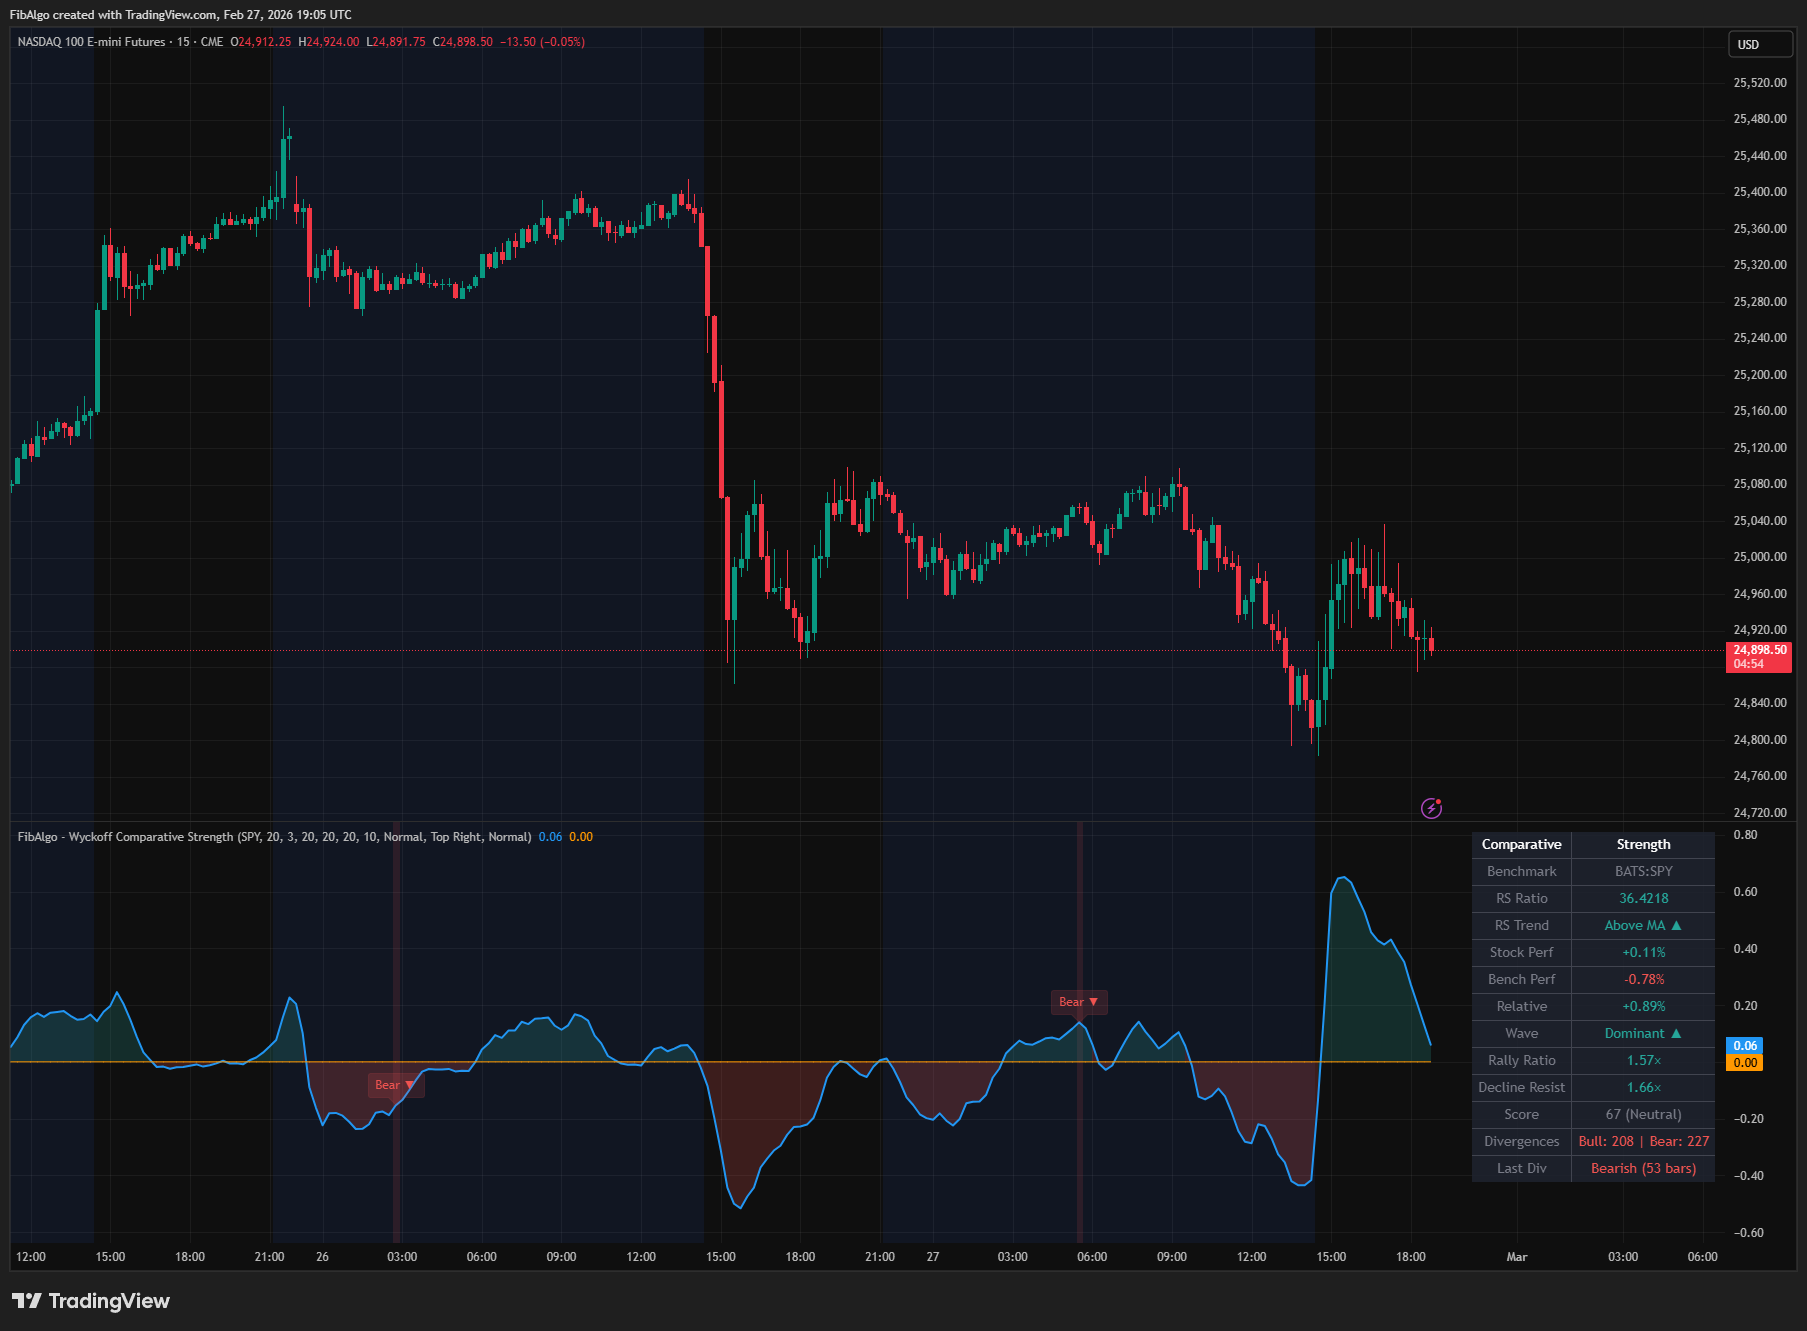
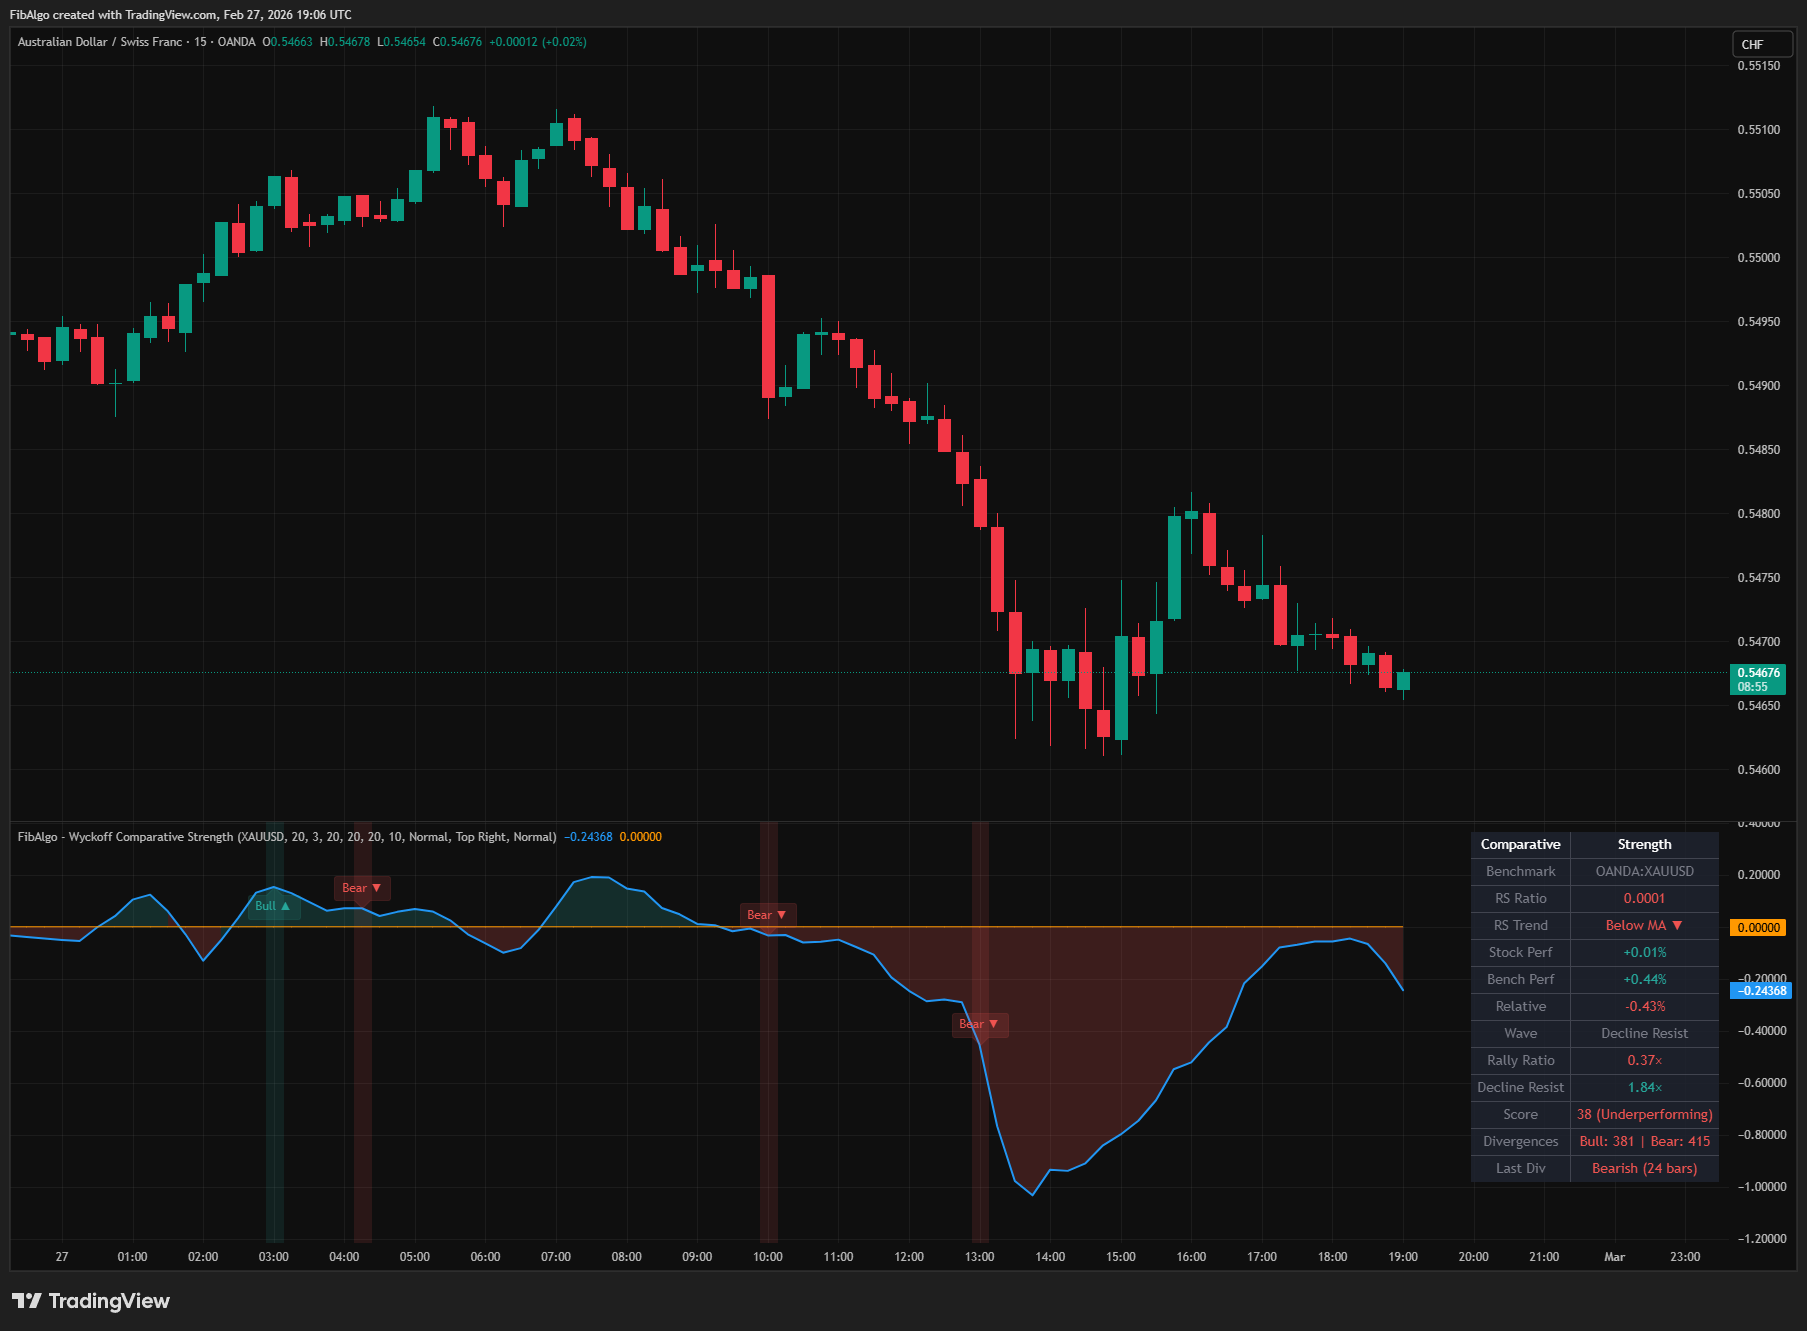
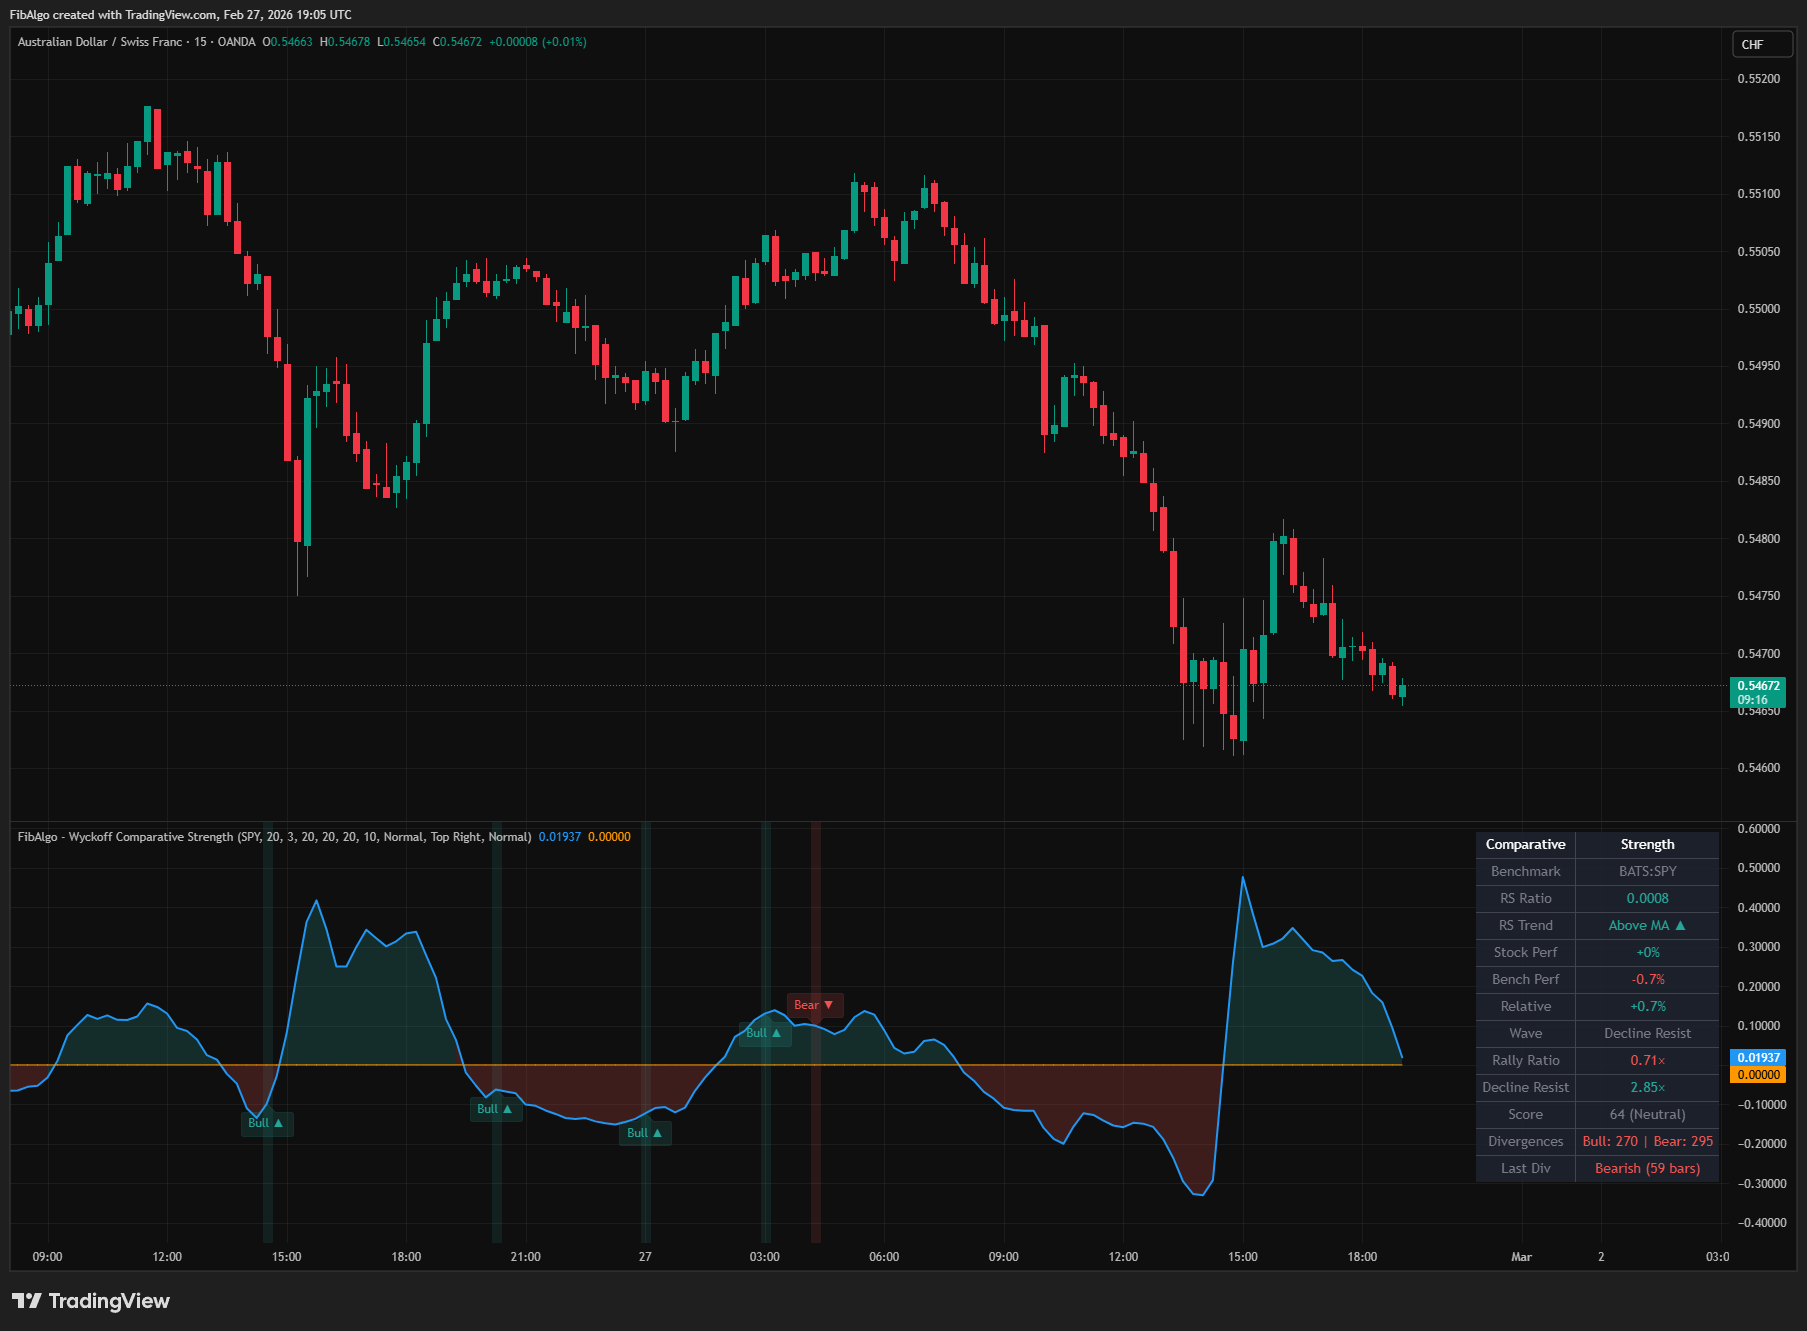
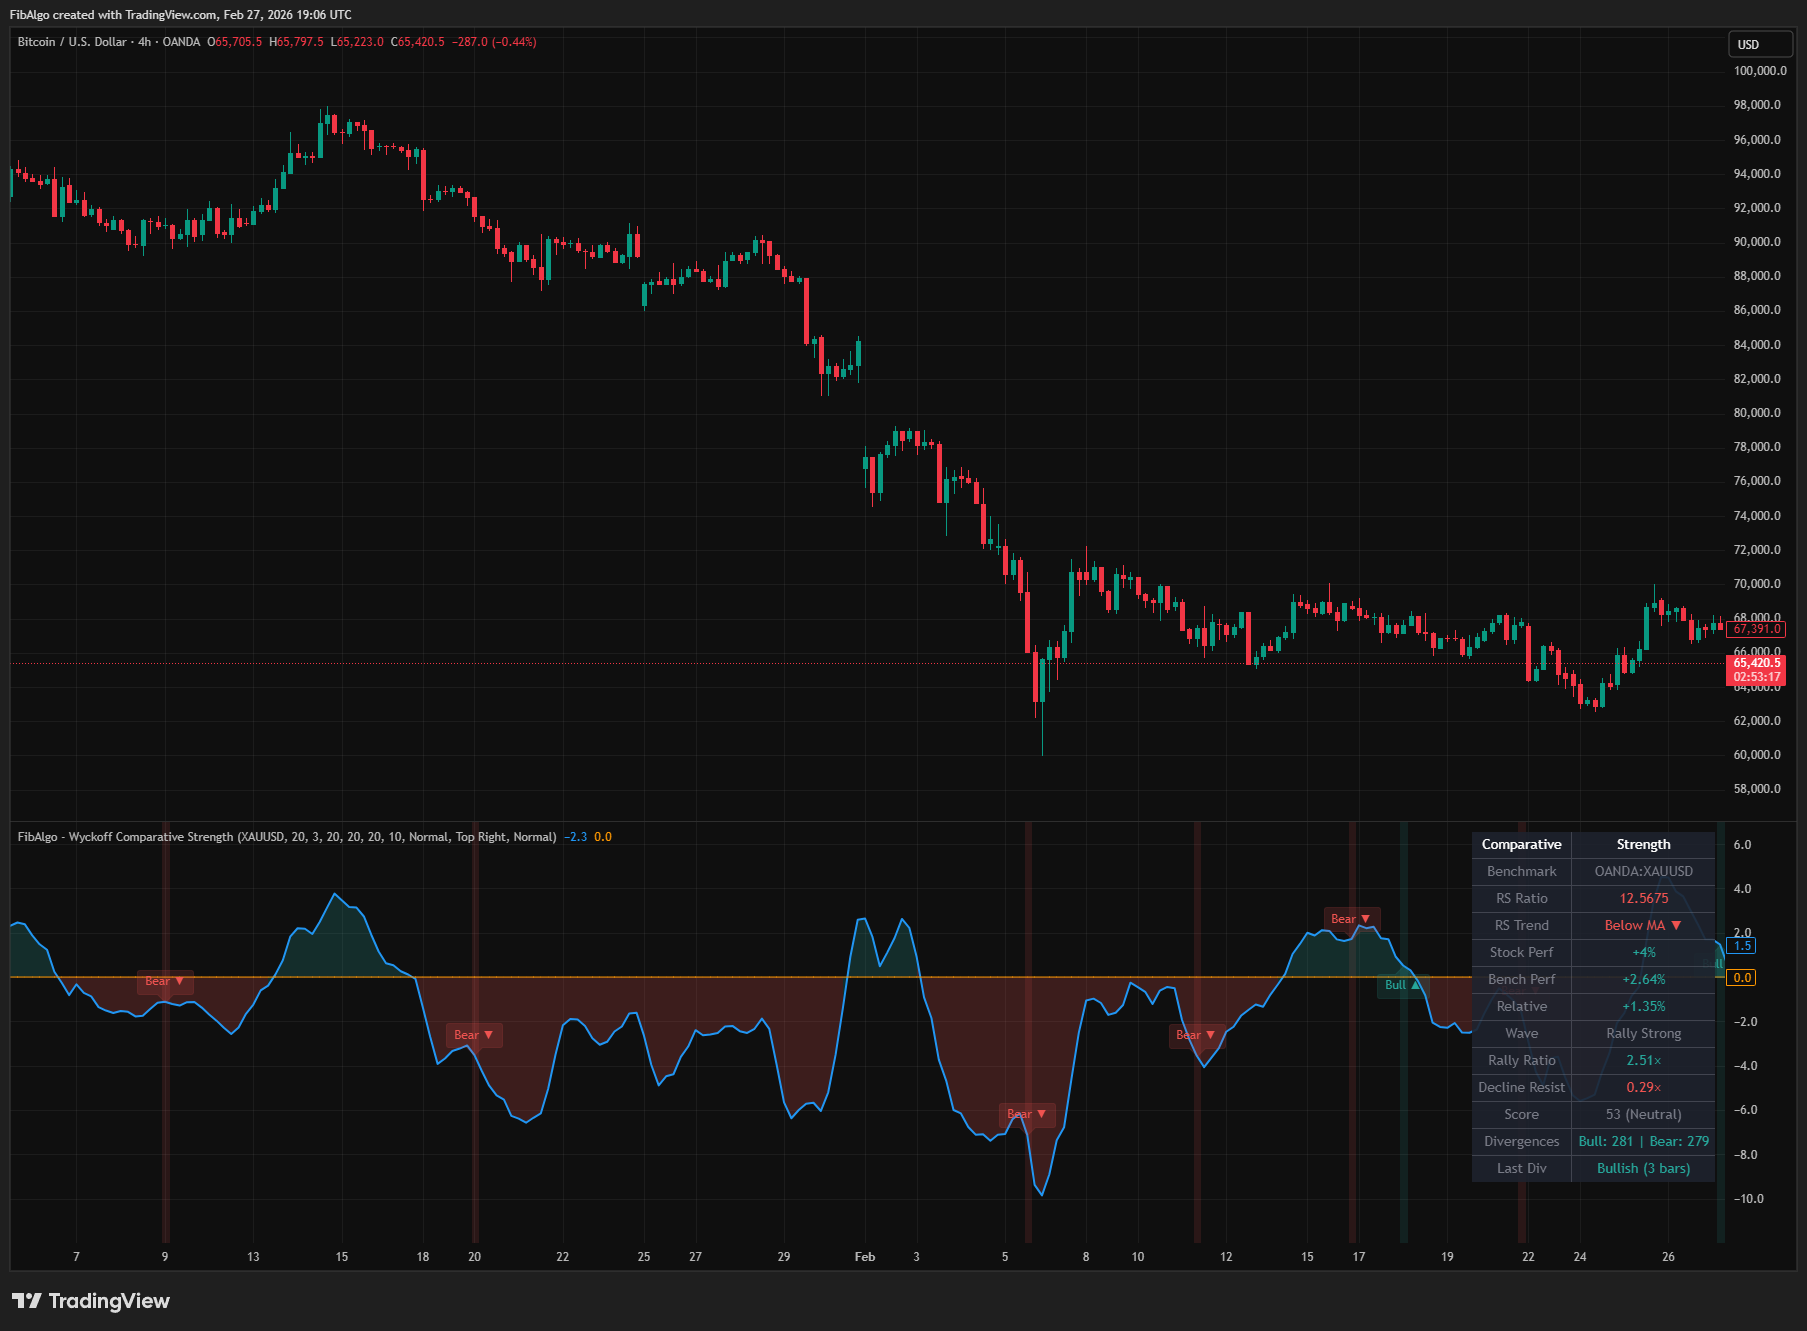
FibAlgo - Wyckoff Comparative Strength measures how a stock performs relative to a benchmark index — a cornerstone of Wyckoff analysis. The indicator displays a zero-centered RS strength oscillator in a separate pane, showing the percentage deviation of the Relative Strength ratio from its moving average. When the oscillator is above zero, the stock is outperforming its benchmark; when below, it is underperforming. The indicator also detects stock-vs-benchmark divergences with configurable cooldown, performs wave amplitude comparison, and provides a composite outperformance score (0-100). Wyckoff emphasized that the strongest trades come from instruments showing comparative strength against the broad market during accumulation, with the RS ratio being the primary tool for identifying such leaders and laggards.
Key Concepts
- Relative Strength (RS) Ratio — Calculated as Stock Price / Benchmark Price. A rising RS ratio means the stock is outperforming the benchmark; a falling ratio means underperformance. This is the most direct way to visualize Wyckoff's comparative strength principle.
- RS Strength Oscillator (Zero-Centered) — The indicator converts the RS ratio into a percentage deviation from its moving average: (RS Smoothed − RS MA) / RS MA × 100. Positive values mean RS is above its MA (outperforming regime); negative values mean RS is below its MA (underperforming regime). The zero line represents the MA crossover level, providing a clean, scale-independent view regardless of absolute price ratios.
- Stock vs Benchmark Divergence — When the stock makes higher highs/lows while the benchmark makes lower highs/lows (bullish divergence), or vice versa (bearish divergence), it reveals shifting relative strength. Wyckoff considered such divergences as powerful early signals of which instrument is being accumulated or distributed. A configurable cooldown period prevents excessive signaling.
- Wave Comparison (Wyckoff Wave Analysis) — Compares the average amplitude of rallies and declines between stock and benchmark. A stock that rallies more and declines less than the benchmark is "Dominant" — showing genuine underlying strength. A stock that rallies less and declines more is "Submissive" — a sign of innate weakness.
- Outperformance Scoring — A composite 0-100 score centered at 50 (neutral) combining RS trend direction, RS momentum, relative performance, and wave quality. Scores above 70 indicate clear outperformance; below 30 indicate significant weakness.
How It Works
1. RS Ratio Calculation & Oscillator The raw RS ratio is computed as the current stock's close divided by the benchmark symbol's close on each bar. This raw ratio is smoothed with a short SMA (default 3 periods) to reduce noise while preserving responsiveness. A longer-period SMA (default 20 periods) serves as the trend reference moving average. The indicator then converts these into a zero-centered oscillator by calculating the percentage deviation of the smoothed RS from its MA:- RS Ratio = Close / Benchmark Close
- Smoothed RS = SMA(RS Ratio, RS Smoothing)
- RS MA = SMA(RS Ratio, RS MA Period)
- Oscillator = (Smoothed RS − RS MA) / RS MA × 100
- Oscillator above zero → outperforming (green fill)
- Oscillator below zero → underperforming (red fill)
- Stock Performance = (Close − Close[N]) / Close[N] × 100%
- Benchmark Performance = (Bench Close − Bench Close[N]) / Bench Close[N] × 100%
- Relative Performance = Stock Performance − Benchmark Performance
- Per-bar percentage up-moves and down-moves are calculated separately for both stock and benchmark
- These are averaged over the Wave Comparison Length (default 20 bars)
- Rally Ratio = Average Stock Rally / Average Benchmark Rally — values above 1.0× mean the stock rallies harder
- Decline Resistance = Average Benchmark Decline / Average Stock Decline — values above 1.0× mean the stock declines less
- Wave Classification: both ratios above 1.1 = "Dominant ▲", both below 0.9 = "Submissive ▼", mixed = "Rally Strong", "Decline Resist", or "Neutral ═"
- Window 1 (recent): highest high and lowest low of the last N bars
- Window 2 (previous): highest high and lowest low of the N bars before that
- Bullish divergence: stock makes higher high while benchmark makes lower high, OR stock makes higher low while benchmark makes lower low — stock is stronger
- Bearish divergence: stock makes lower high while benchmark makes higher high, OR stock makes lower low while benchmark makes higher low — stock is weaker
- Edge trigger ensures each divergence fires only once on the transition bar, avoiding repeated signals
- Divergence Cooldown (default 10 bars) enforces a minimum gap between same-type signals, preventing excessive noise in trending markets
- Divergence labels include detailed tooltips showing the specific swing comparison, relative performance, RS ratio value, and strength score
- RS Trend (±15 points): how far the RS ratio is above or below its MA
- RS Momentum (±15 points): rate of change of the RS ratio over the performance lookback
- Relative Performance (±10 points): stock vs benchmark percentage return difference
- Wave Quality (±10 points): combined rally ratio and decline resistance strength
Features
- Zero-Centered RS Oscillator — Displays the RS ratio as a percentage deviation from its moving average, providing a clean oscillator view that stays centered around zero regardless of absolute price ratios between stock and benchmark (Mansfield RS approach)
- Zero Reference Line — The zero line represents the RS MA crossover level. Oscillator above zero = outperforming; below zero = underperforming, with instant visual polarity
- RS/Zero Fill Zone — Green fill when oscillator is above zero (outperforming); red fill when below (underperforming), providing instant visual feedback on the current strength regime
- Stock vs Benchmark Divergence Detection — Identifies bullish and bearish divergences by comparing swing highs and lows between the stock and benchmark across two adjacent windows
- Divergence Cooldown — Configurable minimum bar gap (default 10) between same-type divergence signals, preventing excessive noise in trending or choppy markets
- Edge-Triggered Divergence Labels — Labels appear once per divergence transition with detailed tooltips including swing comparison details, relative performance, RS ratio, and strength score
- Wave Comparison Analysis — Compares average rally and decline amplitudes between stock and benchmark, classifying the relationship as Dominant, Submissive, Rally Strong, Decline Resist, or Neutral
- Rally Ratio and Decline Resistance Metrics — Quantitative measures of how the stock rallies versus the benchmark and how well it resists declines, displayed in the info table
- Outperformance Scoring (0-100) — Composite score centered at 50 combining RS trend, RS momentum, relative performance, and wave quality with four grades (Outperforming, Neutral, Underperforming, Weak)
- Performance Comparison — Side-by-side N-bar percentage returns for stock and benchmark with the difference shown as Relative Performance
- Divergence Background Coloring — Optional background tinting on divergence bars for instant identification of relative strength shifts
- Configurable Benchmark Symbol — Compare against any index, ETF, or symbol. Default SPY for US equities; change to QQQ, DIA, IWM, or any relevant benchmark
- Info Table (13 rows) — Real-time dashboard showing Benchmark symbol, RS Ratio, RS Trend, Stock/Benchmark/Relative Performance, Wave classification, Rally Ratio, Decline Resistance, Strength Score with grade, Divergence counts, and Last Divergence age
- Alert System — Individual alerts for bullish and bearish divergences with detailed messages including ticker, benchmark, swing comparison type, relative performance, and score
How to Use
- Add the indicator to your chart. It opens in a separate pane below the price chart, displaying the RS strength oscillator around a zero line.
- Set the Benchmark Symbol to match your market. For US stocks, SPY (S&P 500) is the default. For Nasdaq-heavy stocks, consider QQQ. For crypto, use BTCUSD or a broader crypto index.
- When the oscillator is above zero (green fill), the stock is outperforming its benchmark — this is the Wyckoff definition of comparative strength favoring the stock.
- Watch for bullish divergence labels: the stock is making higher highs or higher lows while the benchmark makes lower ones. This is a leading indicator that the stock is being accumulated more aggressively than the market.
- Watch for bearish divergence labels: the stock is making lower highs or lower lows while the benchmark makes higher ones. This suggests distribution or relative weakness in the stock.
- Check the Wave classification in the info table. "Dominant ▲" with Rally Ratio above 1.0× and Decline Resistance above 1.0× confirms the stock both rallies harder and declines less — the hallmark of Wyckoff comparative strength.
- Use the Score (0-100) for quick assessment. Scores above 70 ("Outperforming") indicate strong relative strength suitable for long-side entries. Scores below 30 ("Weak") indicate significant underperformance.
- Combine with other Wyckoff indicators: when Accumulation & Distribution (#1) shows Phase C/D and this indicator shows the stock outperforming the benchmark with the oscillator above zero, the probability of a successful markup increases substantially.
- During market-wide selloffs, monitor which stocks keep the oscillator above zero. These relative strength leaders often produce the strongest rallies when the broader market recovers.
- Adjust the RS MA Period for different trading styles: shorter (10-14) for swing trading, longer (30-50) for position trading.
Limitations
- This indicator does not generate buy or sell signals. It measures relative strength between a stock and a benchmark for educational and analytical purposes based on Wyckoff methodology.
- The indicator displays in a separate pane (not overlaid on price). The oscillator shows the percentage deviation of the RS ratio from its moving average, not the absolute RS ratio value. The raw RS ratio is shown in the info table.
- Divergence detection uses a fixed window comparison method. In strong trending markets, divergences may be rare; in choppy markets, they may fire more frequently. Adjust the Divergence Lookback and Divergence Cooldown to match market conditions.
- Wave comparison requires sufficient up and down bars within the wave length. In strong one-directional trends, one side may have very small average moves, making ratios volatile. A minimum threshold of 0.001% prevents division-by-zero issues.
- The benchmark symbol must be available on TradingView and have data for the current timeframe. If the benchmark returns no data, the RS ratio will not be calculated.
- Volume is not used in this indicator. Wyckoff comparative strength focuses on price behavior relative to benchmark, not volume dynamics. Combine with volume-based indicators (VSA #3, Selling & Buying Climax #5) for complete Wyckoff analysis.
- Past relative strength does not guarantee future performance. A stock outperforming today may begin underperforming at any time.