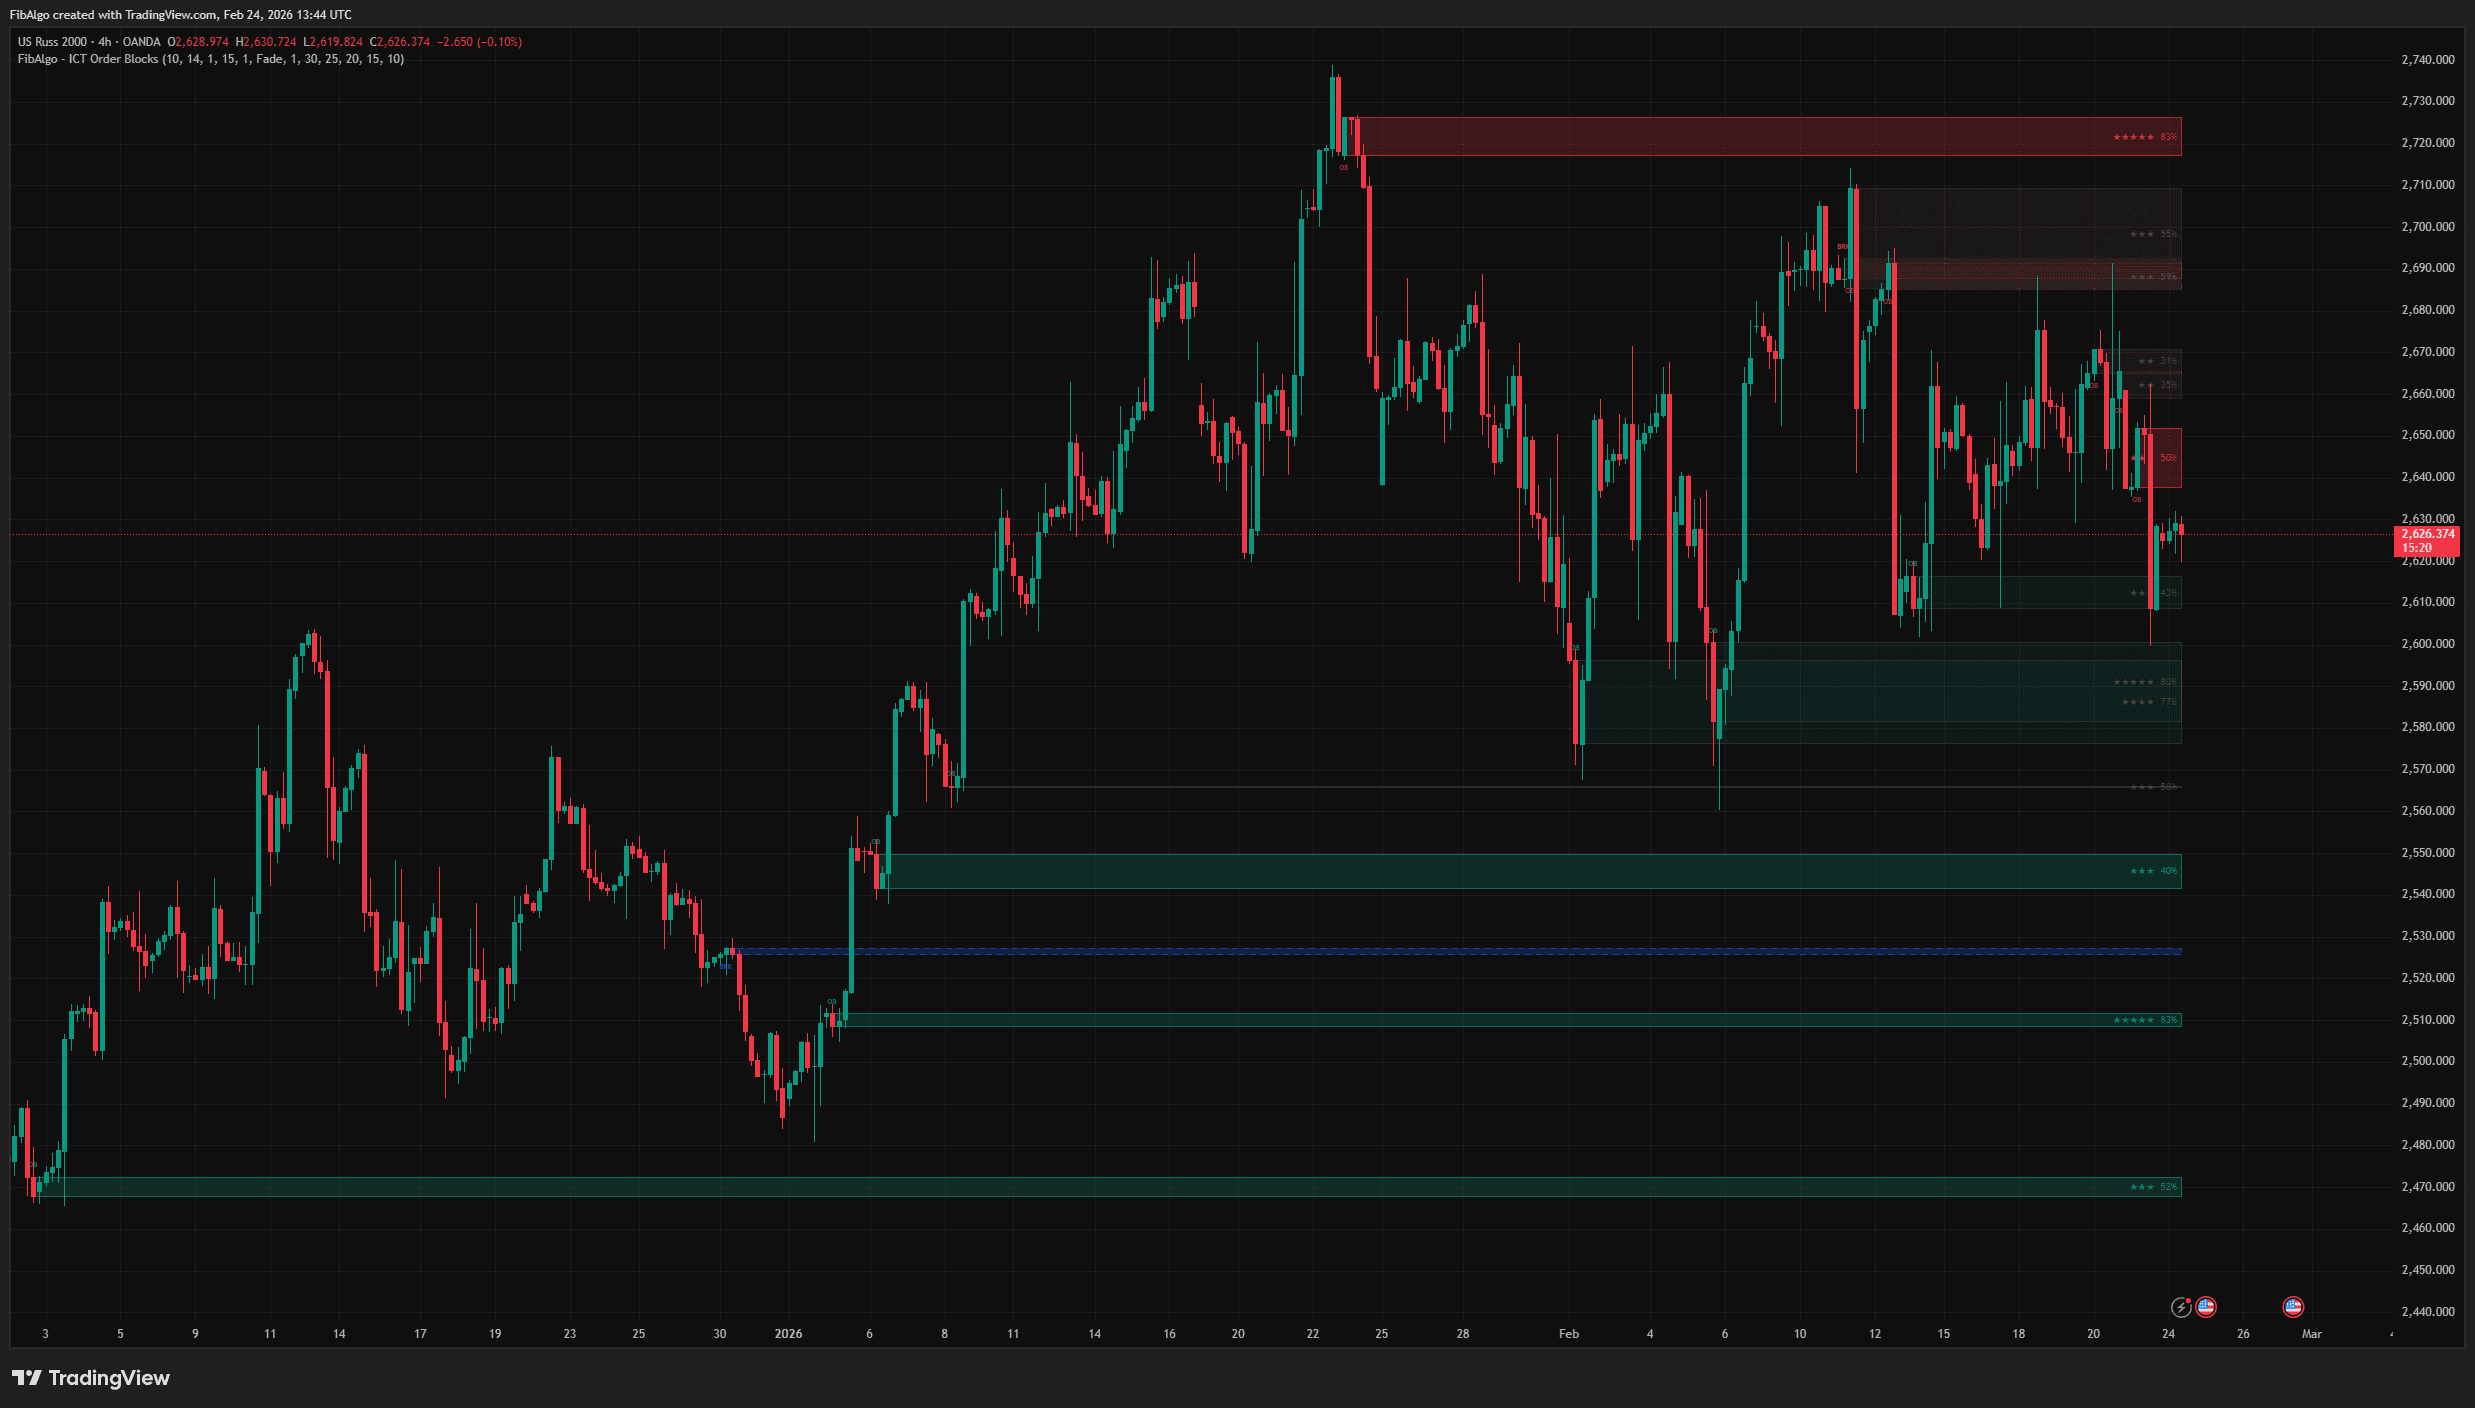
After this guide you will be able to mark the 20, 40 and 60-day IPDA look-back ranges on a daily chart. You will also be able to turn them into a dealing range with a clear premium and discount, and use that range to decide which side of the market to look for trades on. You will see how to tell when the read has stopped working, too.
This is a framework for organising a chart. It is not a secret code that predicts price. Used that way, it is one of the most useful habits in the ICT toolkit.
What IPDA means
IPDA stands for Interbank Price Delivery Algorithm. It is a term from ICT (The Inner Circle Trader) teaching. The idea is that price in major markets is delivered in a repeatable way: it moves from one pool of liquidity to the next, and it rebalances the inefficiencies it leaves behind on the way.The claim that one literal algorithm runs the interbank market cannot be checked, and you do not need to believe it. What you can use is the behaviour the model describes. Price tends to reach for obvious highs and lows where stops sit, and it often returns to fill fair value gaps, the three-candle imbalances left by fast moves.
If you are new to these terms, read the smart money concepts guide first. IPDA sits on top of liquidity, market structure and fair value gaps, and it adds one thing: a fixed time window that tells you which highs and lows matter right now.
The look-back ranges
ICT frames the IPDA data range as the last 20, 40 and 60 trading days, counted on the daily chart. That is roughly one, two and three months of sessions. Weekends and market holidays are left out because no candle prints on them.
What each range gives you
- 20-day range: the short-term high and low. These are the levels price is most likely to interact with in the next few weeks.
- 40-day range: the middle layer. It often holds the swing that started the current leg.
- 60-day range: roughly one quarter of trading. Its high and low are the large liquidity pools that a quarterly move tends to aim at.
How to count them
On the daily chart, start from today's candle and count back 20 candles. Mark the highest high and the lowest low inside that window. Repeat for 40 and 60. You end up with up to six levels, but the ranges overlap, so the same high often appears in all three.
The rule that matters: an untaken high or low inside the 60-day window is a candidate target, and one that price has already run is spent. Mark which levels have been swept and which are still clean.
Looking forward
ICT also describes a look-forward use. Levels in today's 60-day window are the ones price may seek over the next 20 to 60 days. A change in the dominant direction often shows up around the turn of a calendar quarter, which ICT calls a quarterly shift. Treat the first weeks of a new quarter as a time to re-check your bias rather than assume the old trend carries on.
How it links to dealing ranges
A dealing range is the swing high and swing low that price is currently trading between. The look-back ranges give you a disciplined way to choose that high and low. You no longer have to pick whichever swing looks convenient.
Once you have the range, split it at 50 percent. That midpoint is equilibrium. Anything above it is premium, anything below it is discount.
- With a bullish bias, look for longs in discount, aiming at the untaken liquidity above the range high.
- With a bearish bias, look for shorts in premium, aiming at the untaken liquidity below the range low.
- At equilibrium, do nothing. Price there gives you no edge on location.
Many ICT traders refine entries with the optimal trade entry zone, the 62 to 79 percent retracement of the swing. If you want the Fibonacci side of that in detail, the Fibonacci trading strategy guide covers how to anchor the tool correctly.
The 20-day range usually works as the dealing range for swing trades. The 60-day range sets the larger premium and discount. The best locations line up: discount in the 20-day range that is also discount in the 60-day range.

TradingView Indicator Library
35 ICT, Wyckoff and Fibonacci indicators — 29 of them free — with screenshots, guides and FAQs.
Reading it on a chart
Here is the full process on EUR/USD, daily chart. The prices are illustrative, chosen to show the steps cleanly.
Step 1: mark the ranges
Counting back 60 trading days, the lowest low is 1.0710 and the highest high is 1.1190. The 60-day equilibrium is 1.0950. Counting back 20 trading days, the low is 1.0880 and the high is 1.1120, so the 20-day equilibrium is 1.1000.
Step 2: find the draw on liquidity
The 60-day high at 1.1190 has not been traded through. Daily structure is making higher highs and higher lows. That points to the buy-side liquidity above 1.1190 as the draw. The 60-day low at 1.0710 is far away and behind a series of higher lows.
Step 3: wait for location
Price is at 1.1060, which is premium in the 20-day range. Buying here means buying high. Instead, note the unfilled daily fair value gap between 1.0905 and 1.0935. It sits below both the 20-day equilibrium (1.1000) and the 60-day equilibrium (1.0950), so it is discount on both layers.
Step 4: confirm on a lower timeframe
When price trades into the gap, drop to the 1-hour chart. Wait for a market structure shift: price takes out a short-term low, then reverses hard and breaks the last 1-hour lower high. That tells you buyers have stepped in at the level. Without it, the level is only a level.
Step 5: define the trade
- Entry near 1.0930 after the 1-hour shift.
- Stop below the 20-day low at 1.0870, so the idea is wrong if that low breaks.
- First target at the 20-day high, 1.1120. Second target at the 60-day high, 1.1190.
Risk is 60 pips against roughly 190 pips to the first target. Size the position from the stop distance, as the risk management guide explains. The method is the same on forex and crypto.
If you would rather have swing highs, lows and gaps drawn for you while you practise this, you can find FibAlgo's indicators by searching FibAlgo on TradingView. You still choose the range. The tool just saves you the marking.
When the read fails
IPDA ranges describe where liquidity sits. They do not force price to go there. These are the failures you will meet most often, and the signs that come first.
- Displacement against the bias. In the example, a large daily candle that closes below 1.0880 has taken the 20-day low with force. The draw has likely moved to the sell-side liquidity at 1.0710. Before that close, you usually see price slice through the fair value gap without any 1-hour reaction.
- The gap does not hold. A healthy discount gap gets a reaction within a session or two. If price sits inside it and keeps closing lower, buyers are absent. Stand aside.
- Both sides are taken. If price sweeps the 60-day high and the 60-day low within a few weeks, the range has stopped working as a map. Wait for a fresh range to form.
- News and regime change. A central bank surprise can reprice a pair beyond any 60-day level in one session. Check the calendar before you trust a range around major releases.
The common thread: when price closes beyond your stop level with a strong candle, the setup is finished. Accept it and redraw the ranges. Do not defend an old bias.
Mistakes to avoid
- Counting calendar days. Sixty calendar days is closer to 42 trading days. Count candles on the daily chart, not dates.
- Treating IPDA as a crystal ball. It tells you where liquidity is and which side has better location. It does not tell you when price will move, so you still need a lower-timeframe trigger.
- Redrawing the range to fit the trade. Pick the range from the count, then look for a trade. If you keep shifting the high or low until your entry looks like discount, you have stopped using the framework.
- Buying premium because the bias is bullish. Direction and location are separate questions. A correct bias with a bad entry still produces a wide stop and poor reward.
- Ignoring swept levels. A high that has already been run no longer holds resting stops. Targeting it again is targeting a pool that has been drained.
- Stacking too many tools. Ranges, gaps, order blocks, kill zones and Fibonacci levels all at once usually end in paralysis. Start with the 20 and 60-day ranges plus equilibrium, and add one layer at a time. The common trading mistakes guide covers this overload problem in more depth.
Practise the count on three or four markets for a few weeks before trading it. Mark the ranges every Monday, write down the draw on liquidity, and review on Friday whether price respected the levels or broke them. That review teaches you more about IPDA than any definition.
Frequently Asked Questions
What does IPDA stand for in ICT?
What are the IPDA look-back periods?
Does IPDA work on crypto and stocks?
How is an IPDA range different from a dealing range?
What timeframe should I use to enter IPDA trades?
Related indicators

ICT · Wyckoff · Fibonacci
Put What You Learned Into Practice
Apply these ideas on your own charts with FibAlgo's TradingView indicators.
- Traders
- 5,000+
- Indicators
- 35
- Free Indicators
- 29
Free account. Free indicators included.