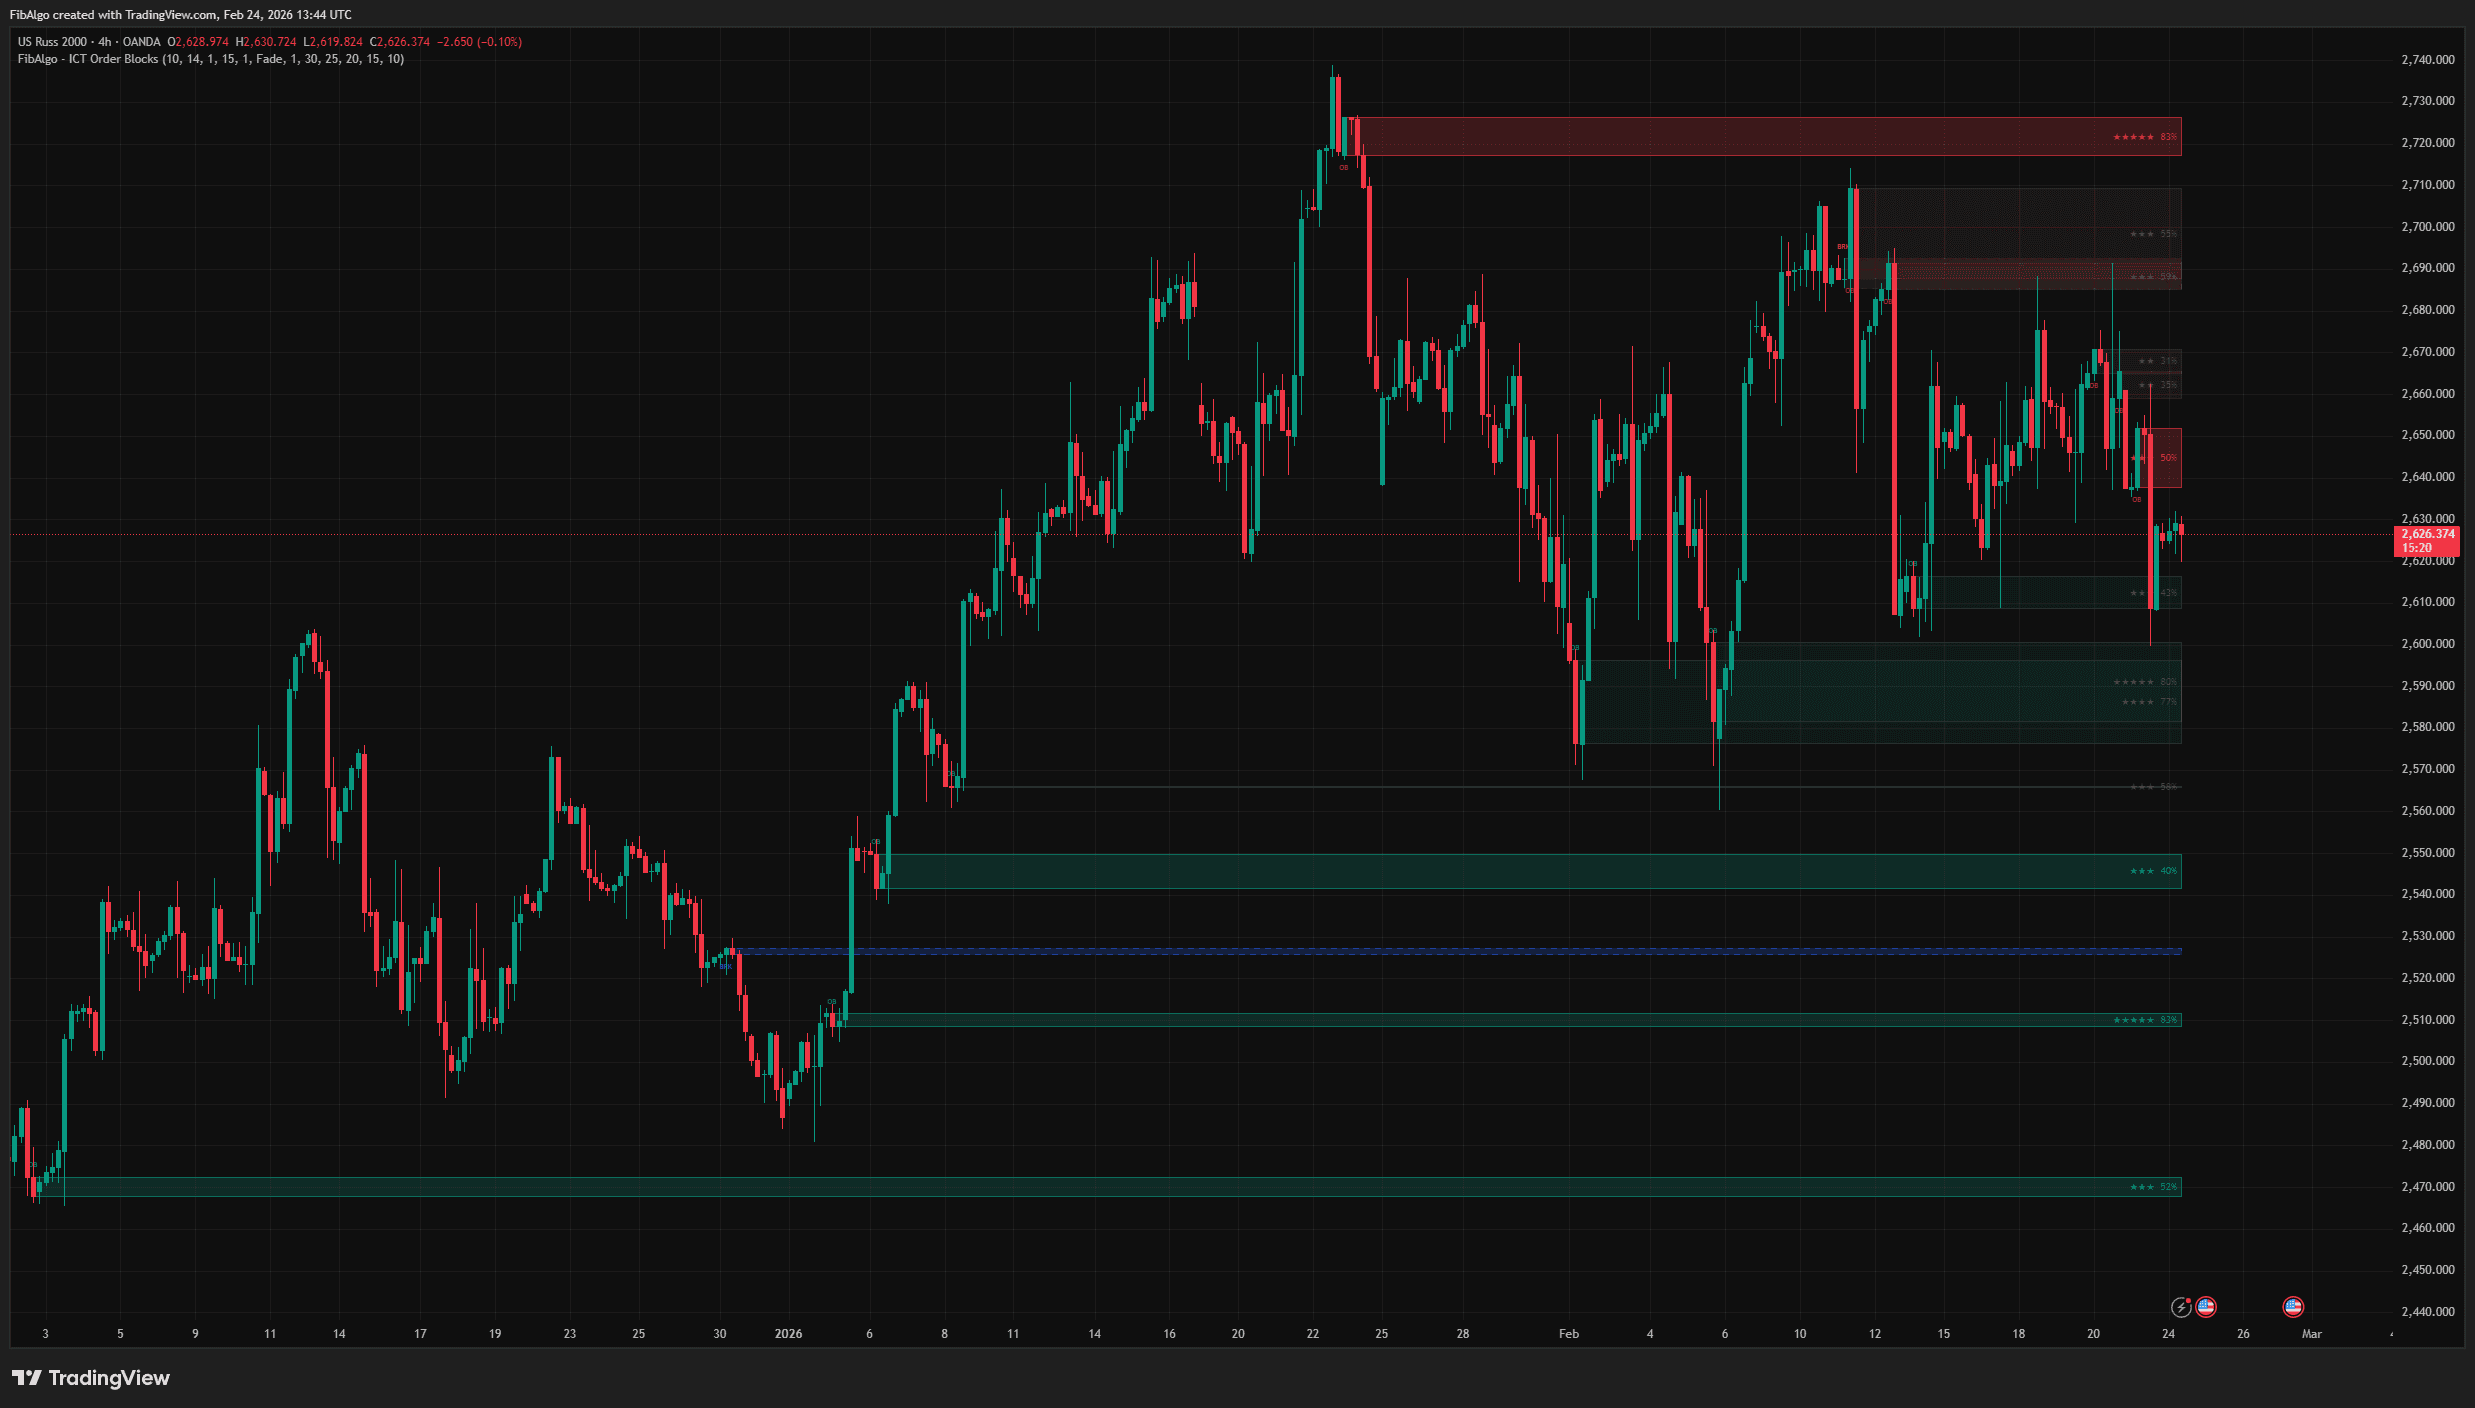
After this guide you will be able to find the true day open on any TradingView chart, mark it by hand, and check that it sits on the right candle. You will also know how to read it with other key levels and what the chart shows when the level has stopped being useful.
What the true day open is and why traders mark it
The true day open is the price at which the trading day is treated as really beginning, rather than where the platform happens to start its daily candle. In ICT-style and Quarterly Theory teaching, that moment is usually 00:00 New York time. The Asian session has already run by then, and London is close to its open.
The reason to mark it is simple: it splits the day in two. Price above the line is expensive relative to the day's start, and price below it is cheap, which is the same premium and discount idea covered in our smart money concepts guide.
That gives you one checkable question before any intraday trade. If your bias for the day is bullish, are you buying below the line or chasing above it? If your bias is bearish, are you selling above it or chasing below it?
How it differs from the midnight open
Most of the time, these two labels point to the same price. The midnight open names a clock reading: the first price of the 00:00 New York candle. The true day open names a role: the reference that starts the trading day.
The practical split comes from how teachers define the role, so check which time your source uses before you copy a setup. Most use 00:00 New York, and some apply the word true to other session references, such as a 09:30 open for US stock index traders. If a course and your chart disagree, the time stamp settles it, not the label.
The bigger difference is between either of these and the open of your daily candle. That candle can start at a very different time depending on the market and data feed:
- Spot forex: the daily candle usually starts around 17:00 New York, at the rollover.
- CME index futures: the session starts at 18:00 New York the evening before.
- Crypto on most exchanges: the daily candle starts at 00:00 UTC, which is 19:00 or 20:00 New York the evening before.
So the daily candle's open and the true day open can be several hours and a meaningful distance apart. Reading one while thinking of the other is the most common source of confusion with this level.
Marking it by hand on a dated chart
Here is the routine on EUR/USD, on a 15-minute chart, for Tuesday 3 November 2026. US clocks changed on 1 November that year, so New York was on winter time and midnight fell at 05:00 UTC. The prices below are round numbers chosen for easy arithmetic, so read the real ones from your own chart.
The steps
- Open the chart on a 15-minute timeframe. The 1-minute and 5-minute charts work as well, because a candle starts at exactly 00:00 on each of them.
- Set the chart time zone to New York using the time zone control at the bottom right of TradingView.
- Use Go to, in the bottom toolbar, to jump to 3 November 2026 at 00:00.
- Hover over the candle that starts at 00:00 and read its open from the values at the top left of the chart, not its close.
- Draw a horizontal ray from that candle's open, with magnet mode on so that it snaps to the open.
- Label it with the date and stop it at the end of the session, so old lines do not clutter tomorrow's chart.
If that candle opens at 1.1000, then 1.1000 is your line for the day. Check your work by switching to the 5-minute chart: the ray should still sit on the open of the 00:00 candle. If it does not, you anchored it to the wrong candle or the wrong part of the candle.

TradingView Indicator Library
35 ICT, Wyckoff and Fibonacci indicators — 29 of them free — with screenshots, guides and FAQs.
Common mistakes: wrong time zone and wrong session
Nearly every misplaced line comes from one of the errors below. Each one has a quick check, so run through them once when you set up a new chart.
Reading midnight in your local time
The fix is to convert from New York time, not from your own clock. Traders outside the US often mark their own midnight, and that line has nothing to do with this concept. Use this table if you prefer to keep your chart on another time zone:
| Chart time zone | New York winter time | New York summer time |
| --- | --- | --- |
| UTC | 05:00 | 04:00 |
| London | 05:00 | 05:00 |
| Istanbul (UTC+3) | 08:00 | 07:00 |
| Chicago | 23:00 the evening before | 23:00 the evening before |
Forgetting the clock change weeks
The US and UK change their clocks on different dates each spring and autumn. In those short gaps, New York midnight falls at 04:00 on a London chart instead of the usual 05:00. Setting the chart itself to New York avoids the problem completely.
Using a timeframe with no candle at midnight
On many forex feeds, 4-hour candles are aligned to the 17:00 rollover, so none of them begins at 00:00 New York. The fix is to mark the level on a 15-minute chart or lower and then view it on higher timeframes. Your line stays correct even when no candle lines up with it.
Picking a market that does not trade at midnight
A regular stock such as AAPL has no midnight print, and the extended-hours data on TradingView only begins in the early morning. Traders who want this level for US indices usually mark it on futures such as ES or NQ, then decide whether to carry the reference over to the stock or ETF. The other option is to use the 09:30 cash open and label it clearly as a different level.
Treating the line as an exact price
Different feeds can show slightly different opens for the same forex pair at the same minute. Mark the level on the feed you actually trade, and read it as a thin zone rather than a precise tick. A wick that passes it by one or two pips has told you very little.
Using it with key levels for context
On its own, the line gives you location and nothing more. It becomes useful when other levels sit near it or around it. Before London opens, add these to your chart:
- Previous day high and low, the most obvious pools of resting stops.
- Asian range high and low, the range that price often raids first in London.
- Higher-timeframe structure, such as the last 4-hour swing that decides your bias.
- Fibonacci retracement levels of the latest swing, if you use them. Our Fibonacci trading guide covers how to choose that swing.
A worked scenario: EUR/USD, 15-minute
Continue with the 1.1000 line, and add a previous day high of 1.1040, a previous day low of 1.0960 and an Asian low of 1.0985. Assume your 4-hour read is bullish. That means you only look for longs below 1.1000, which is the discount side of the day.
During London, price drops to 1.0982, takes the Asian low, and closes a 15-minute candle back above 1.0985. That is a sweep of nearby stops, in discount, in the direction of your bias. A plan could use an entry on the reclaim, an invalidation under 1.0982, and the previous day high at 1.1040 as the target.
The line also gives you a management checkpoint in this plan. If price reaches 1.1000 and stalls, you know where you are in the day's range, and you can apply the rule you set in advance. Size the trade from the distance to the invalidation, as explained in our risk management guide.
When the level fails and what you see first
This line is a reference, not a barrier, and on many days price pays it little respect. Three pictures tell you to stop relying on it.
- Acceptance on the wrong side: in the bullish scenario above, price stops dipping below 1.1000 and instead closes several 15-minute candles under it, then rejects it from below. The line has become resistance, so the long plan is cancelled.
- A one-way day: price leaves the line in the first hour of London and never returns. Waiting for a discount entry means no trade, and that is a valid outcome.
- A news reset: a release at 08:30 New York, such as US payrolls, can move price far from the line in one candle. Anything you read before the release may no longer apply, so wait for new structure to form.
The warning usually comes before the failure. Watch for shallow bounces that get weaker each time, pullbacks that keep making lower highs under the line, and a higher-timeframe level sitting right in your path. If you see these while your bias says otherwise, the chart is arguing with your bias, and the bias is what needs reviewing.
Where the FibAlgo ICT Midnight Open indicator fits
Marking the line by hand is worth doing for a couple of weeks, because that is how you learn the time zone traps. After that, redrawing it every day on several charts is routine work. The FibAlgo ICT Midnight Open indicator plots the midnight open level for you on TradingView; look it up by name on fibalgo.com or search FibAlgo on TradingView.
The indicator takes care of the drawing, and the reading stays with you. Before relying on any plotted line, compare it once with your hand-marked candle on the same date. Bias, key levels and invalidation remain your decisions.
Frequently Asked Questions
What time is the true day open?
Is the true day open the same as the midnight open?
How do I find the true day open on TradingView?
Does the true day open work on crypto?
Should I buy below the true day open and sell above it?
Related indicators

ICT · Wyckoff · Fibonacci
Put What You Learned Into Practice
Apply these ideas on your own charts with FibAlgo's TradingView indicators.
- Traders
- 5,000+
- Indicators
- 35
- Free Indicators
- 29
Free account. Free indicators included.