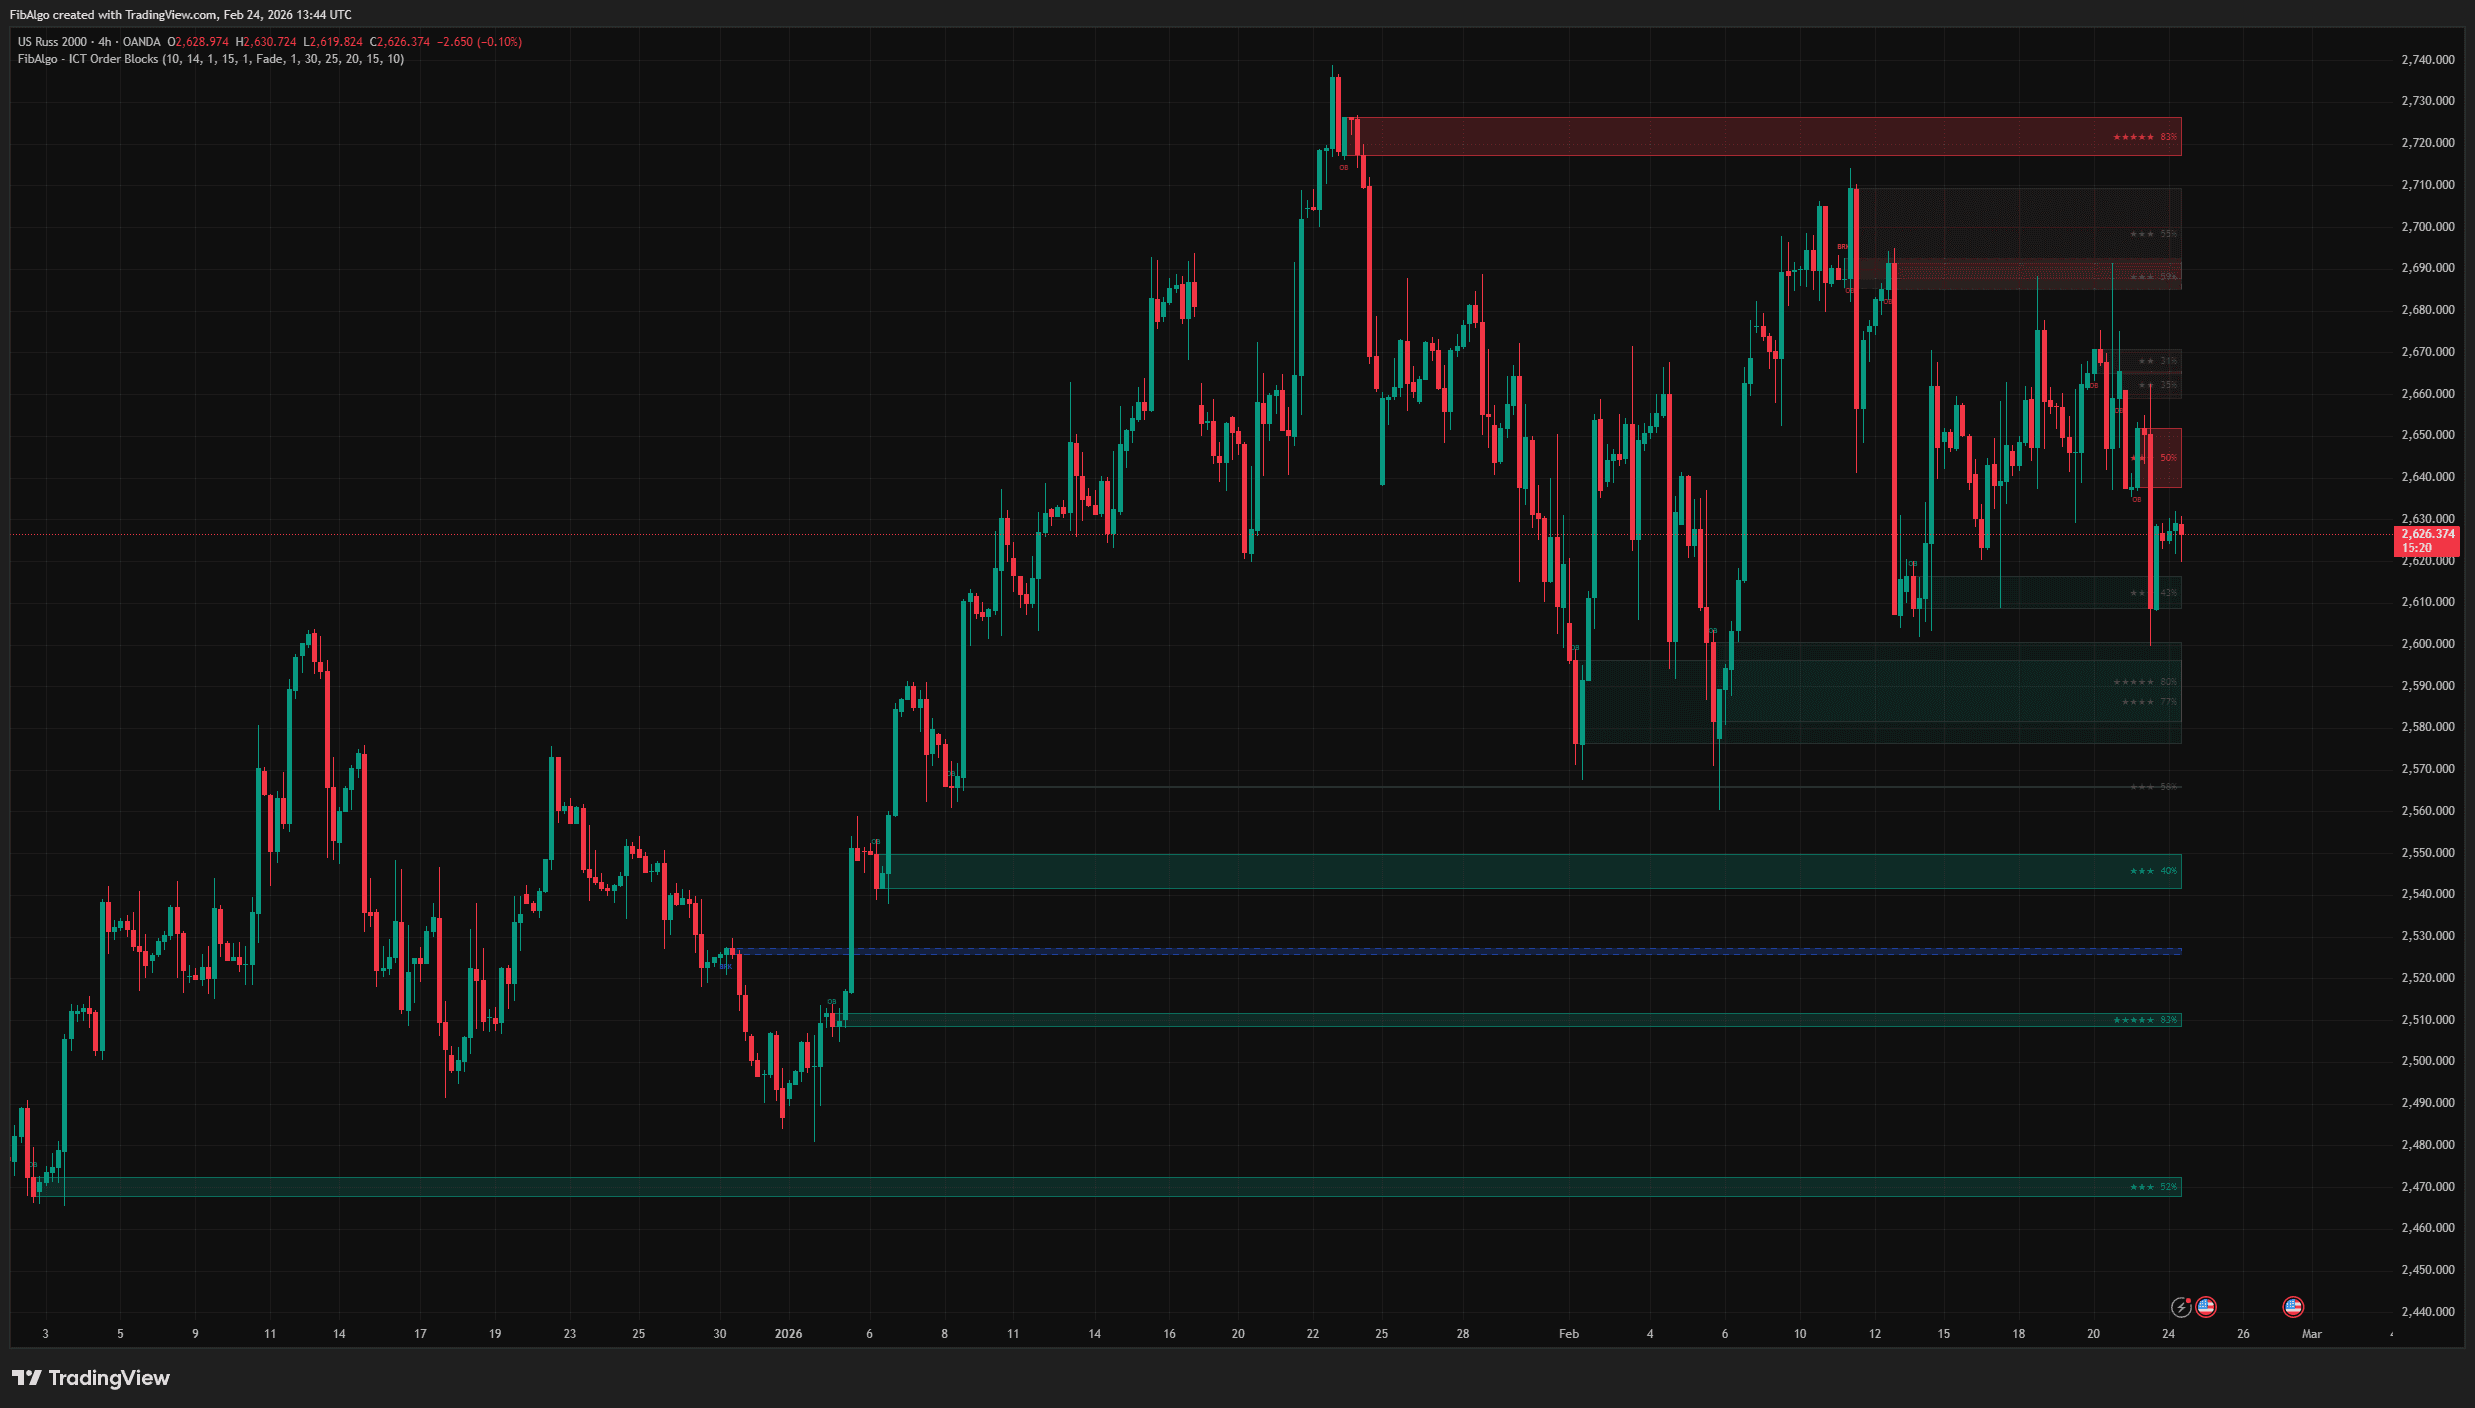
After this guide you will be able to label the swings on any TradingView chart, tell a break of structure from a change of character, and find a market structure shift on the swings that actually matter. You will also have one rule for deciding whether a break counts, and a list of the signs that a shift is about to fail.
Nothing here needs a special tool. A blank chart, a line tool and some patience are enough. The free indicator at the end speeds it up once you can already do it by hand.
Swing highs and lows: HH, HL, LH, LL
A swing high is a candle whose high stands above the highs of the candles on both sides of it. A swing low is the mirror. Pick one rule for how many candles must sit on each side, for example two to the left and two to the right, and keep it for that timeframe.
Each new swing gets a label compared with the swing of the same kind before it. A higher high (HH) tops the previous swing high, a higher low (HL) holds above the previous swing low, and lower highs (LH) and lower lows (LL) are the bearish versions. An uptrend is a run of HH and HL. A downtrend is a run of LH and LL.
A swing is not confirmed until the candles to its right have printed. Until then it is a candidate, and labeling a candidate is the most common way traders invent structure that is not there.
Label a chart in five minutes
- Open the timeframe you trade and find the most obvious high and low on screen.
- Mark every swing between them with the same candle rule. Do not add swings by eye.
- Label each new high against the last high and each new low against the last low.
- Read the last two labels: HH plus HL is up, LH plus LL is down, and a mix is a range or a transition.
The mistake to avoid is labeling every wiggle. If your chart has a label on every few candles, raise the number of candles each side and start again.
Break of structure versus change of character
A break of structure (BOS) is a close beyond the last swing in the direction of the trend. In an uptrend that means a close above the last HH. In a downtrend it means a close below the last LL. A BOS says the trend is still doing what it was doing.
A change of character (CHoCH) is the first close beyond a swing against the trend. In an uptrend that is the first close below the last HL. It is the first sign that sellers did something buyers could not stop.
The name comes from which swing was broken, not from how big the candle was. Ask one question: did price break the swing that continues the trend, or the swing that protects it?
A CHoCH on its own is a warning, not a short signal. Treating every CHoCH as a reversal is how traders sell the bottom of a normal pullback. The fix is simple: a CHoCH means you stop buying pullbacks blindly. It does not mean you start selling yet.
Where MSS differs on higher-degree swings
Swings come in degrees. Inside every pullback there are small internal swings, and those pullbacks sit inside the larger swings that define the leg. A break of an internal swing changes the internal picture. It does not have to change the leg.
In ICT usage, a market structure shift (MSS) is a break of the swing the trend depends on. In an uptrend that is the higher low that launched the most recent higher high, often called the protected low. When price closes below it, the leg that made the last high has failed.
An MSS usually comes in a recognisable order. First price runs the liquidity on the opposite side, for example by trading above the last high where buy stops sit. Then it reverses with displacement: large-bodied candles that leave gaps behind them. Then it closes through the protected swing. If you want the resting liquidity marked before you look for the sweep, ICT Liquidity Levels draws buy side and sell side liquidity and equal highs and lows.
Traders do not all use the same words. Some call every first counter-trend break a CHoCH and save MSS for the protected swing. Others use the two terms interchangeably. The label matters less than the habit: before the session, write down which swing is protected on your timeframe. A break of anything smaller is internal.

TradingView Indicator Library
35 ICT, Wyckoff and Fibonacci indicators — 29 of them free — with screenshots, guides and FAQs.
Wick break or close break: why the close answers
A wick through a swing high tells you price traded there. The close tells you whether price was accepted there. A candle that wicks above a high and closes back below it took the stops above that high and was rejected. That is a sweep, not a break.
The company's own charts showed this several times in November 2026. On 15 November a red BTCUSDT 4h candle wicked above the high of the big green candle before it, and its body closed below that high. Anyone who flipped on the wick was reacting to a level that did not hold.
The rule is: a break counts when a candle body closes beyond the swing on the timeframe you labeled it on. A 15-minute close beyond a 4h swing is a 15-minute event. It tells you something, but it is not a 4h break.
This gives a clean split between planning and deciding. Mark the swing before price gets there and write what each outcome means. The level is the plan. The close is the answer, whether the swing holds or breaks.
The cost is that the close can land far from the level, and the entry looks worse than the wick traders got. Do not chase it. After a real break, price often comes back toward the broken level or into the gap the displacement left, and that return is where a planned entry belongs.
A chart example
This walk-through uses BTCUSDT on the 4h. The swings are named with letters, not prices, so you can find the same shape on the chart you have open instead of copying numbers.
Step 1: mark the context
The 4h is in an uptrend and the last two labels are HH and HL. Call the higher high H1 and the higher low that launched it L1. L1 is the protected low. Write the plan now: a 4h close below L1 shifts the bias, and anything above it is a pullback.
Step 2: watch the run on the high
Price rallies back to H1. A candle wicks above H1 and closes back below it. On a wick-based read that is a bullish break. On a close-based read nothing has broken, and buy-side liquidity above H1 has been taken. Bias is unchanged, but you are now watching L1 closely.
Step 3: the internal warning
Price drops and closes below a small internal low inside the move up from L1. That is an internal CHoCH. It is a warning on a lower degree. L1 has not been touched, so the leg is still intact.
Step 4: the shift
A large-bodied 4h candle closes below L1. That is the market structure shift on this degree: the low that built H1 has failed. The next rally that stops below H1 will be labeled a lower high, and that lower high becomes the new protected swing.
Step 5: what follows a real shift
If the shift is real, the next swings print LH and LL and each new close below the last low is a bearish BOS. The company's 19 November post described Bitcoin's 4h drop in exactly those terms: a staircase of breaks, not one slide. That staircase is what confirmation looks like after the shift.
When the shift fails
An MSS is a read, not a promise. These are the ways it fails, with what you see before it does.
- Reclaim. The breaking candle closes beyond the swing, then the next candles close back inside. Before it happens, the breaking candle usually has a small body and no displacement, and nothing follows through.
- Break into a bigger level. The shift on your timeframe closes straight into a previous day, week or month high or low. One timeframe up, that is just a reaction off a level, not a new trend.
- Range conditions. The last labels alternate, HH then LL, and swings overlap. In a range every break gets reversed and structure labels flip back and forth. If the labels are mixed, step back and treat the range edges as the structure.
- Timeframe conflict. A 5-minute MSS inside a 4h pullback is often the pullback ending, which is the opposite of what the 5-minute chart suggests. Check the protected swing one timeframe up before acting.
- News candles. One candle cuts through several swings and comes straight back. Wait for the closes after the event, not the spike itself.
The invalidation sits in the same place every time: a close back beyond the broken swing. The stop sits beyond the first swing that forms after the shift, such as the new lower high. For sizing that stop, see the guide on risk management in crypto trading.
Marking structure with a free indicator
Labeling by hand is how you learn it. Doing it on ten charts every morning is slow, and the swing rule drifts when you are tired. That is the point where a tool helps.
ICT Market Structure is a free TradingView indicator, found by searching FibAlgo on TradingView. It marks HH, HL, LH and LL swings and labels BOS, CHoCH and MSS on the chart. Use it the way you would check a colleague's work: label one chart yourself first, then turn the indicator on and compare. Where you disagree, the cause is usually swing size or which swing counts as protected, and settling that question is the lesson.To try the read on your own charts, open a free FibAlgo account and put ICT Market Structure on the market you already trade. For how structure fits with order blocks, fair value gaps and liquidity, the smart money concepts guide puts the pieces together.
Frequently Asked Questions
What is the difference between a market structure shift and a change of character?
Does a market structure shift need a candle close?
What timeframe is best for reading market structure?
Does market structure work on crypto, forex and stocks?
What is a protected high or low in ICT?
Related indicators

ICT · Wyckoff · Fibonacci
Put What You Learned Into Practice
Apply these ideas on your own charts with FibAlgo's TradingView indicators.
- Traders
- 5,000+
- Indicators
- 35
- Free Indicators
- 29
Free account. Free indicators included.