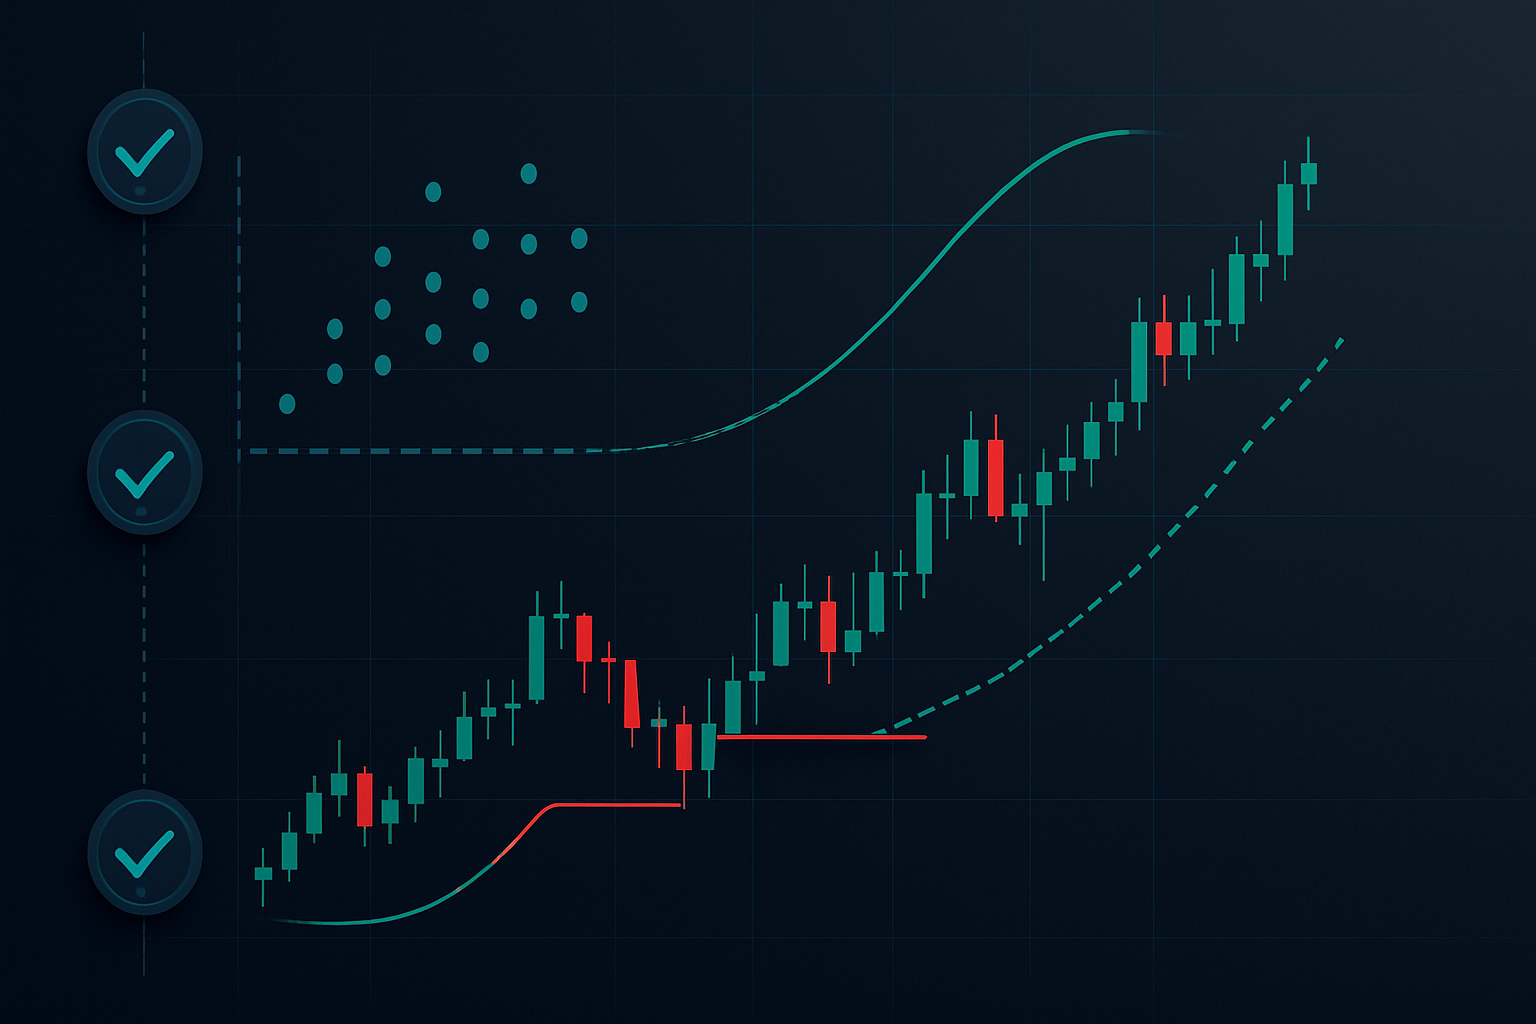
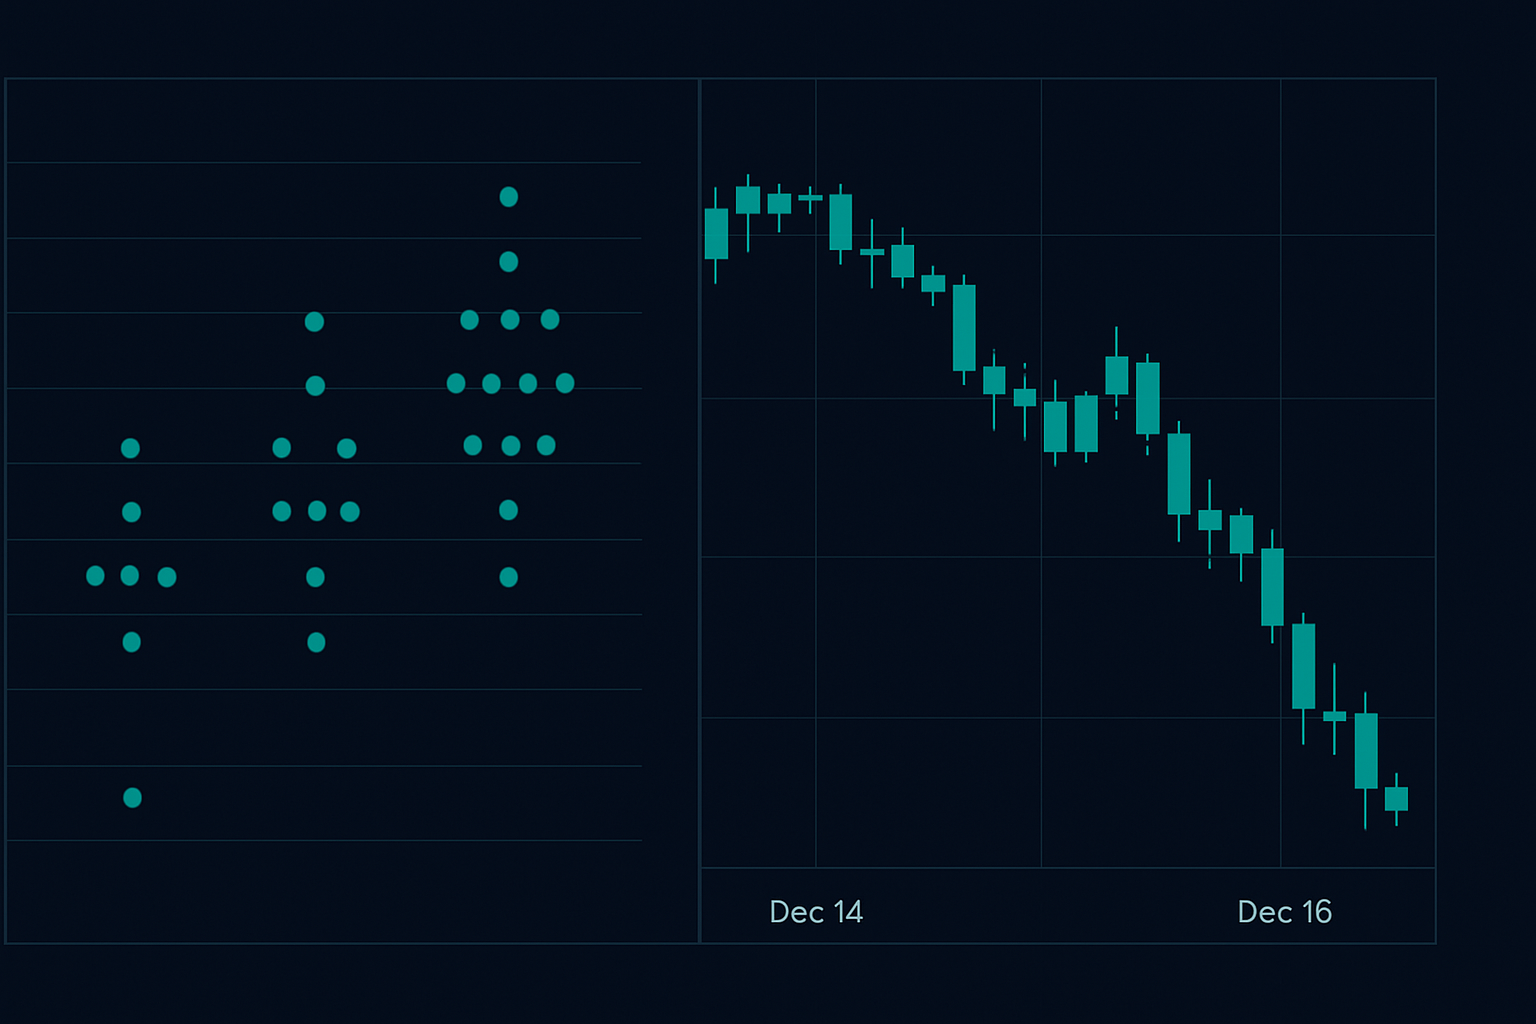
December 14, 2022: The Dot Plot That Paid for Christmas
2:00 PM EST. I'm watching six screens at once, EUR/USD queued up with a 50-lot position ready. The Fed's Summary of Economic Projections hits the wire. Within seconds, I spot what the algos miss — the 2023 dots have shifted massively higher. Not the 2024 projections everyone's watching. The near-term dots.
Forty-five seconds later, I'm short EUR/USD at 1.0647. By Friday's London close, I'm covering at 1.0485. That's 162 pips in 46 hours. While everyone else was parsing Powell's press conference for clues, the dot plot had already told the entire story.
Here's what fourteen years of trading FOMC taught me: the dot plot creates the cleanest 48-hour trading windows in forex. Better than NFP. Better than CPI. Better than any other scheduled risk event. And almost nobody trades it properly.
The Mechanics: Why Dot Plots Move Markets Like Clockwork
Most traders think the dot plot is just Fed communication theater. They're dead wrong. Here's what actually happens in those 48 hours:
Hour 0-2: Algorithms parse the median dot shifts. This creates the initial spike — usually good for 40-60 pips if you're fast. But this isn't the real trade.
Hour 2-12: Asian desks begin repricing their books. Watch USD/JPY during Tokyo — it's your early warning system for whether the move has legs.
Hour 12-24: European real money enters. Pension funds and insurance companies have new rate projections to price in. This is where the meat of the move happens.
Hour 24-48: US corporates adjust hedges based on new rate paths. The final push that usually completes the full 100+ pip move.
When I managed the EUR/USD book at JPMorgan, we had a simple rule: dot plot shifts of 3 or more members in the same direction meant clearing the decks for a 48-hour campaign trade. Not a scalp. Not a day trade. A proper position trade with size.
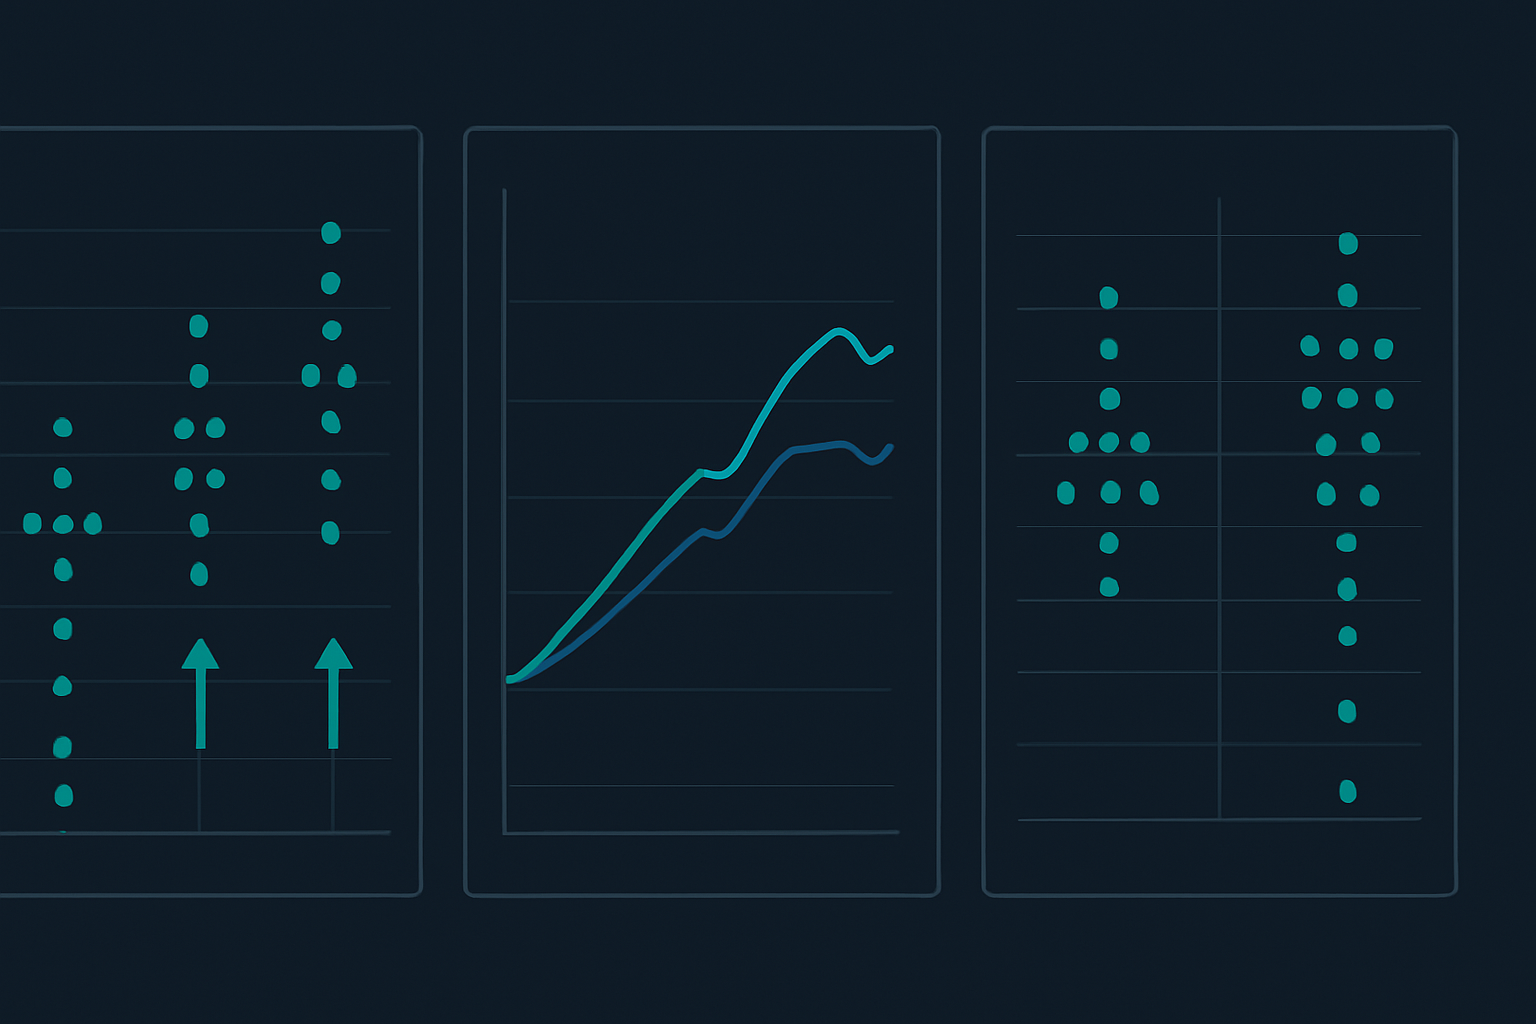
Reading the Dots: The Three-Layer Analysis
Here's exactly how I analyze dot plots within the first 5 minutes of release:
Layer 1: Year-End Dots
Count how many dots moved up or down for the current year's projection. This tells you the immediate repricing need. If 5+ dots shift higher for this year, you're looking at hawkish USD flow for the next 48 hours.
Layer 2: Next Year's Terminal Rate
Compare the median dot for next year versus market pricing. I keep a simple spreadsheet — Fed Funds futures implied rate vs. median dot. When the gap widens beyond 50 basis points, that's your directional signal.
Layer 3: The Dot Dispersion
This is what retail misses completely. Look at how scattered the dots are. Tight clustering means conviction. Wide dispersion means uncertainty. Trade with conviction, fade dispersion.
In March 2023, I watched retail traders fade the dollar after Powell sounded dovish in his presser. But the dots had shifted higher. The 2024 median had jumped 50bps. By the time London opened the next day, EUR/USD was down 80 pips. The dot plot doesn't lie — press conferences do.
The Entry Framework: Catching the Second Wave
Forget trying to trade the instant FOMC spike. That's a coin flip with terrible risk/reward. Here's the institutional approach:
Wait for the first retracement. After the initial algo spike (usually 15-30 minutes post-release), price always pulls back. This happens between hour 2 and hour 6 as profit-taking hits.
Enter on the retest of the spike high/low. Use a 15-minute chart for this. When price retests and holds the initial spike level, that's your entry. Stop goes 15 pips beyond the retracement low/high.
Size for a 48-hour hold. This isn't a scalp. I use 30% of normal position size because I'm holding overnight. Target is 3:1 minimum — if risking 20 pips, target 60+.
Real example: June 2023 FOMC. Dots shifted hawkish, EUR/USD spiked down from 1.0950 to 1.0910. Pulled back to 1.0935 by hour 4. Retest and hold at 1.0915 was the entry. Covered at 1.0842 before Friday's close. 73 pips, clean as clockwork.
Your smart money concepts apply perfectly here — the retracement is hunting stops before the real directional move.
Currency Pair Selection: Not All Dots Are Equal
Through thousands of dot plot trades, here's how different pairs typically react:
EUR/USD: The Clean Mover
Most liquid, cleanest technicals. Hawkish dots = 80-120 pip moves lower. Dovish dots = 60-100 pips higher. Trade size: Full position.
GBP/USD: The Overshoooter
Moves 20-30% more than EUR/USD but with worse spreads. Only trade if you can handle the volatility. I reduce size by 25%.
USD/JPY: The Correlation Play
Best for hawkish dot shifts. Tracks US 10-year yields perfectly. Check the correlation trading dynamics first.
USD/CAD: The Oil Complication
Only trade if oil is range-bound. Too many cross-currents otherwise.
AUD/USD: The Risk Proxy
Amplifies the move if global risk sentiment aligns. Dovish dots + risk-on = explosive AUD rallies.
Risk Management: The 48-Hour Framework
Holding through two trading sessions requires different risk management:
The 30% Rule: Never risk more than 30% of your normal position size on dot plot trades. The overnight gaps can be brutal if news breaks.
The Two-Stop System: Initial stop at 20 pips. After 12 hours, if you're up 30+ pips, move stop to breakeven. After 24 hours, trail by 40 pips.
The Friday Rule: If FOMC is on Wednesday, close by Friday London fix. Never hold dot plot trades through a weekend — too much can change.
In September 2022, I watched a colleague blow up his book holding a dot plot trade through NFP Friday. He was up 110 pips Thursday night, gave it all back and then some. The risk management discipline for multi-day holds is non-negotiable.
When Dot Plots Fail: The Three Warning Signs
Not every dot plot shift creates a clean trade. Here are the setups I skip:
1. The Dispersion Disaster
When dots are scattered across a 150bp range, there's no consensus. Market chops sideways for 48 hours. December 2019 was textbook — dots all over the place, EUR/USD chopped in a 40-pip range.
2. The Priced-In Shift
If Fed Funds futures already price the dot plot shift, the edge is gone. Always check the interest rate derivatives market first.
3. The Cross-Current Crisis
Major risk events within 48 hours kill clean moves. ECB meetings, major data, geopolitical events. March 2022's dot plot was untradeable — Ukraine war headlines every hour.
Advanced Technique: The Dot Plot Divergence Trade
Here's something I developed in my last year at JPMorgan. Sometimes the dots shift one way but the median stays flat. This creates a divergence opportunity.
Example: September 2023. Seven dots moved higher for 2024, but the median stayed at 5.1% because three outliers moved lower. Market initially ignored it. But institutional flow followed the majority shift, not the median. EUR/USD dropped 95 pips over the next 48 hours while retail watched the unchanged median.
The tell? Watch dark pool flows in the first 4 hours. If institutional size is moving opposite to the median, follow the flow.
Current Opportunity: March 2026 FOMC
As I write this in early March 2026, we're heading into the March 19-20 FOMC. Market's pricing 75% chance of unchanged rates but here's what matters: the dot plot hasn't been updated since December.
Fed Funds futures price 4.75% for end-2026. December dots showed 5.25% median. That's a 50bp gap — massive by historical standards. If dots shift lower to match market pricing, expect:
- EUR/USD rally: 80-100 pips minimum
- USD/JPY breakdown below 148.50
- AUD/USD test of 0.6850
But if dots hold firm at 5.25%? We could see the dollar rip higher, especially with current extreme fear in crypto markets suggesting risk-off positioning.
I'm preparing two playbooks — one for each scenario. Position sizing at 25% normal given the uncertainty. Using Bollinger Band squeezes on the 4-hour to time entries after the initial spike. FibAlgo's multi-timeframe alerts are perfect for catching the retest entry when it comes.
The Dot Plot Edge
After fourteen years and hundreds of FOMC trades, dot plots remain my highest-conviction setup. They're not sexy. They're not exciting. But they work with almost boring regularity.
The key is patience. Don't chase the spike. Wait for the setup. Size appropriately. Hold for the full 48-hour window. While everyone else is trying to parse Fed-speak and decode Powell's pauses, you'll be managing a position that's already working.
Remember: the dots show where policy is going, not where it is. And in forex, the direction of travel matters more than the destination. Trade the journey, collect the pips, and let others debate the destination.
The next dot plot drops March 20, 2026, at 2:00 PM EST. Mark your calendar. Prepare your playbook. And remember — when those dots shift, you've got 48 hours to print money while the market figures out what just happened.