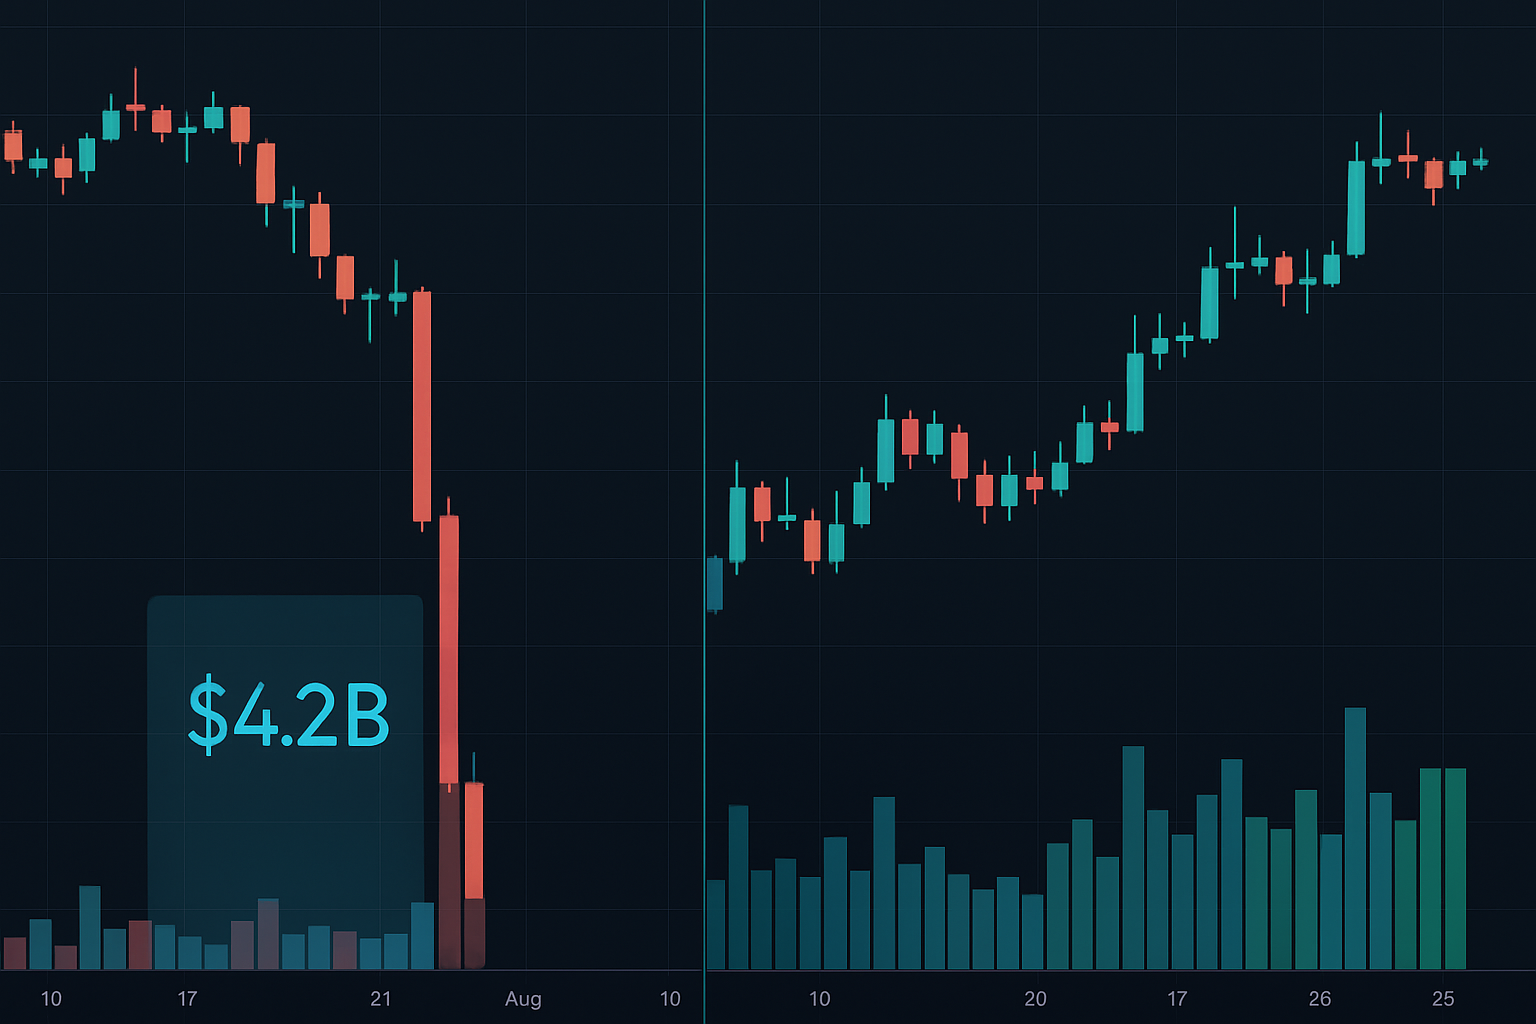
The $4.2 Billion Stop Loss Raid That Changed Everything
On August 5, 2024, Bitcoin flash-crashed from $65,000 to $49,000 in under four hours. Within minutes, it recovered to $54,000. Over $4.2 billion in leveraged positions got liquidated. The interesting part? Major institutions reported significant Bitcoin purchases during that exact window.
This wasn't random. It was a textbook liquidity hunt — and it happens every single day across crypto, forex, and stock markets. The pattern is so predictable that once you see it, you can't unsee it.
Smart money concepts aren't about conspiracy theories or secret banker meetings. They're about understanding how large players must operate given their size constraints. When you need to buy 50,000 Bitcoin or 10 million shares of Tesla, you can't just market buy without moving price against yourself. You need liquidity. And the best source of liquidity? Retail stop losses.
Why Traditional Support and Resistance Gets You Stopped Out
Here's what your trading education probably taught you: draw horizontal lines at previous highs and lows, place your stop just below support, enter on the bounce. Simple, clean, logical. Also completely visible to every algorithm on the planet.
The forex market processes $7.5 trillion daily. The CME alone handles over 20 million contracts per day. In this environment, obvious liquidity pools are magnets for institutional algorithms. That "perfect" support level where everyone has their stops? That's not protection — that's a buffet line for smart money.
The November 2024 Tesla earnings provide a crystal-clear example. The stock had "strong support" at $220, tested three times over two weeks. Retail traders piled in, stops clustered at $218-219. On November 14th, price spiked down to $217.50 in pre-market — collecting every stop — then reversed to close at $229. The support level worked perfectly... after taking everyone out first.
But here's where it gets interesting. These liquidity hunts follow a specific pattern. Once you understand the four phases, you can position yourself on the right side of these moves.
The 4-Phase Liquidity Hunt System
After analyzing thousands of these setups across different markets, a clear structure emerges. Smart money liquidity hunts follow four predictable phases:
Phase 1: The Accumulation Base
Price consolidates in a tight range for at least 10-20 candles. During this phase, retail traders start noticing the "obvious" support or resistance level. Stop losses begin clustering just beyond these levels. Volume typically decreases, creating the calm before the storm.
Phase 2: The Liquidity Build
Price makes 2-3 touches of the key level without breaking. Each touch brings more retail traders placing orders at the "proven" support or resistance. Social media starts buzzing about the level holding. This is when smart money algorithms map out the stop loss clusters.
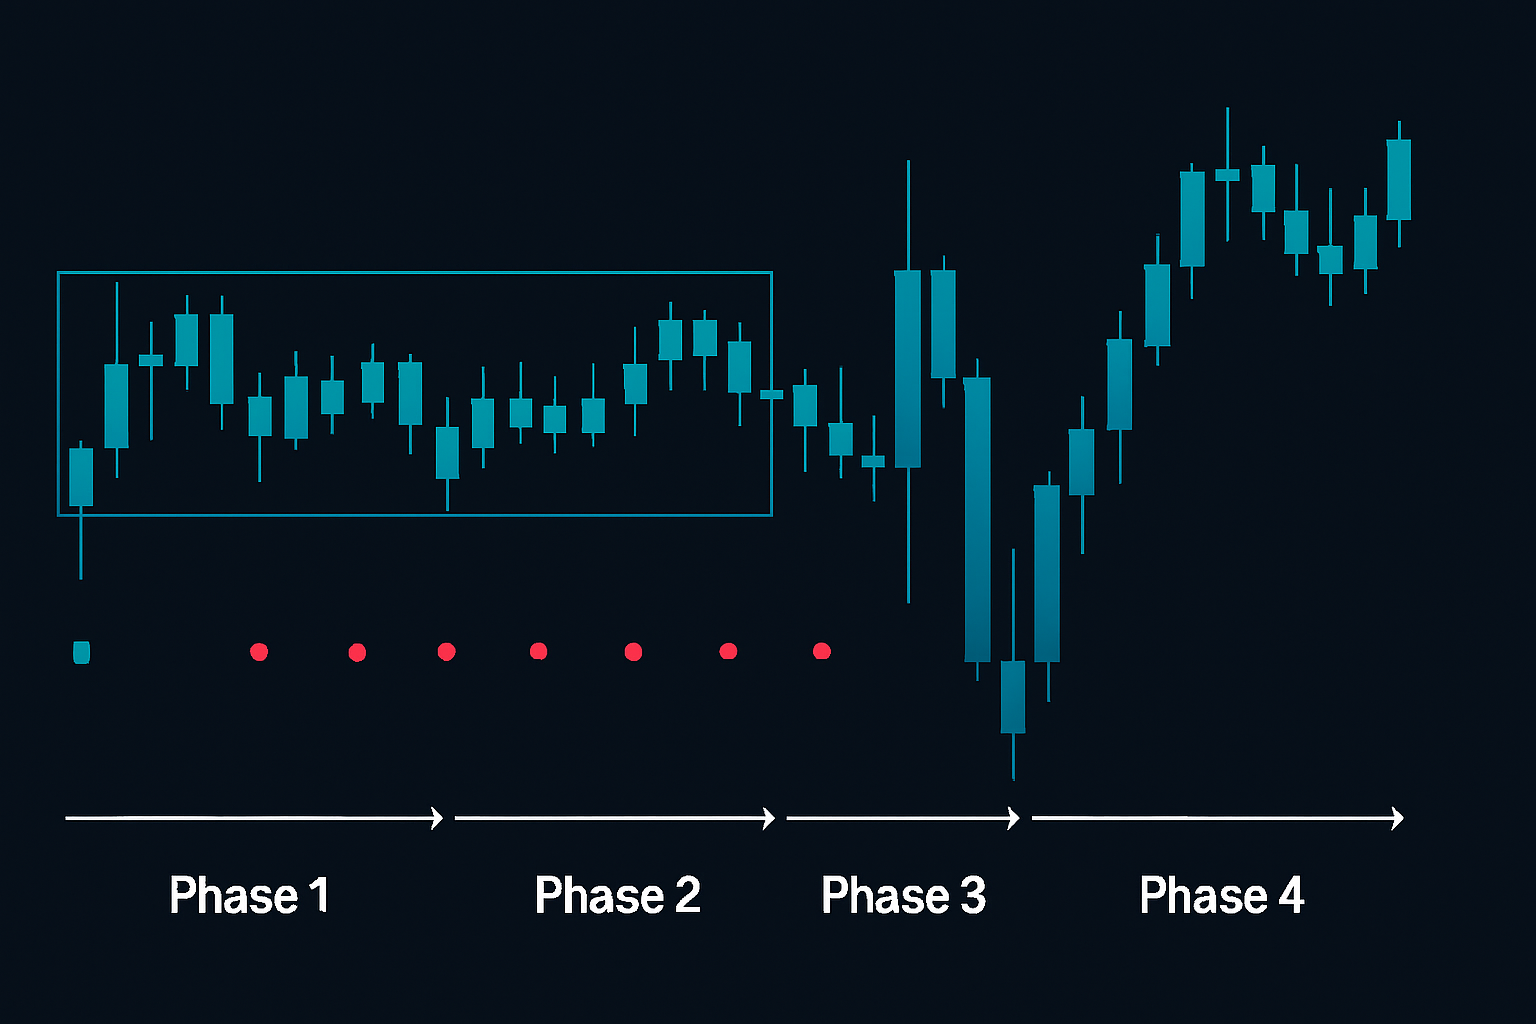
Phase 3: The Stop Hunt
A sudden spike pierces through the key level, often on "no news." This move is typically 0.5% to 2% beyond the cluster zone, just enough to trigger stops but not enough to signal a genuine breakout. Volume surges as stop losses trigger, providing the liquidity smart money needs for their actual position.
Phase 4: The Real Move
Within 1-4 candles, price reverses back through the original level and continues in the opposite direction of the stop hunt. This is where the actual trend begins, now fueled by the liquidity grabbed from retail traders. The move often extends 3-5x the distance of the stop hunt spike.
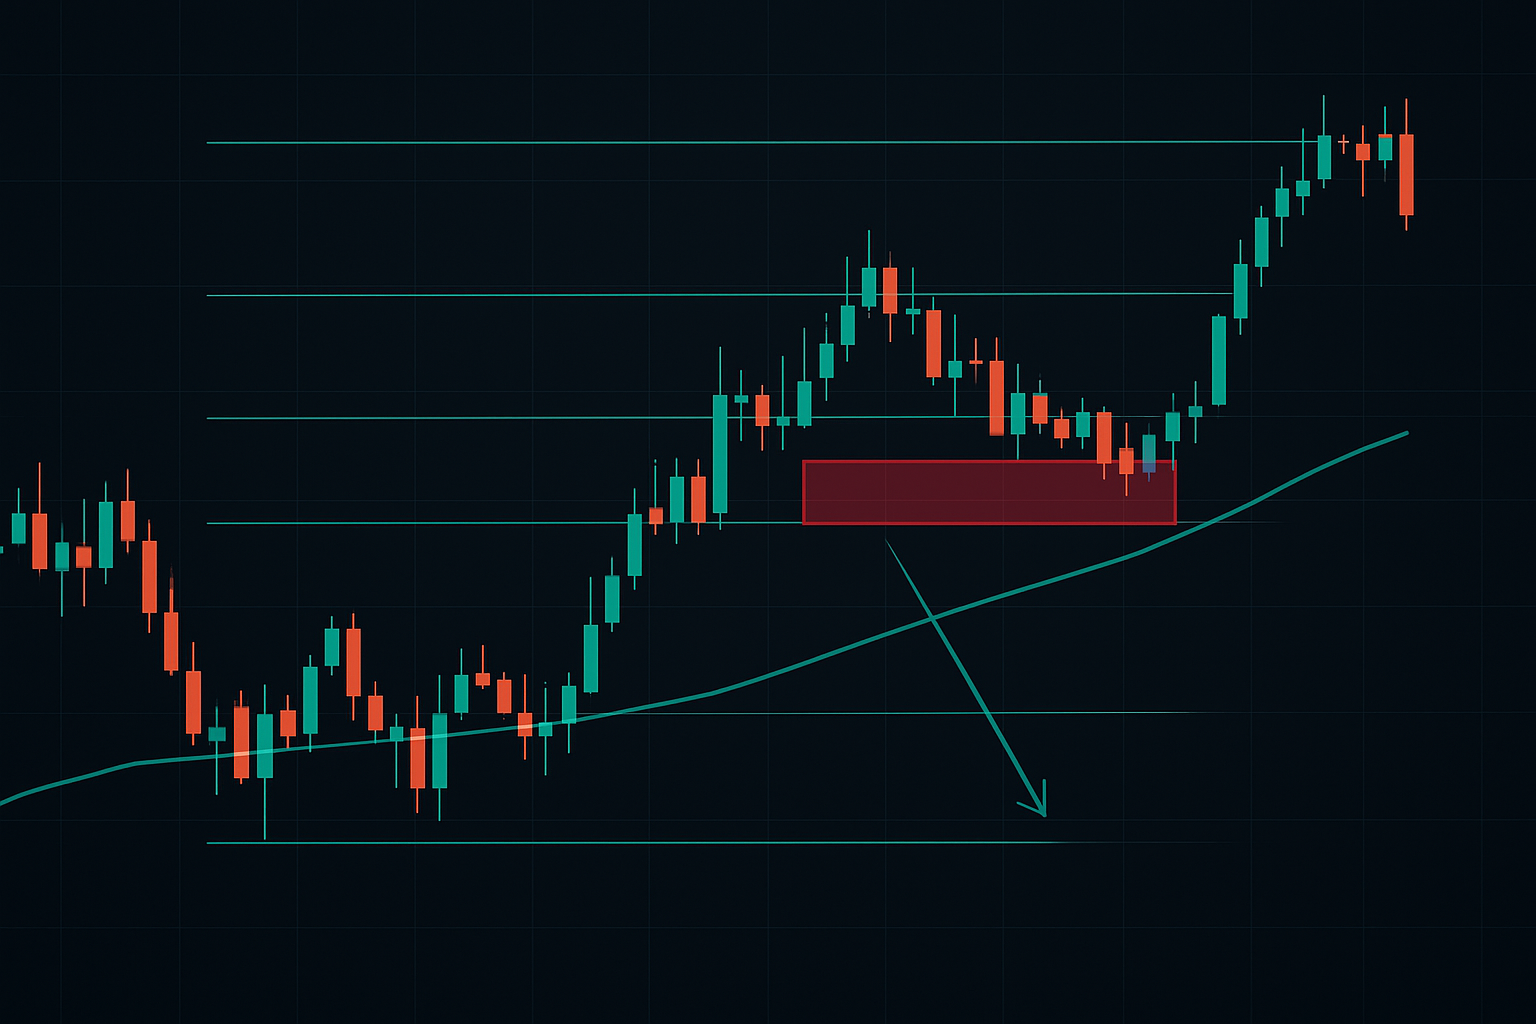
Spotting Liquidity Zones Before They Hit
The key to this system isn't reacting to liquidity hunts — it's anticipating them. Here are the highest-probability zones where stop losses cluster:
Round Numbers and Psychology
Bitcoin at $50,000. EUR/USD at 1.1000. S&P 500 at 4,000. Humans love round numbers, and algorithms know this. Studies show over 45% of retail stop losses cluster within 0.25% of major round numbers. The cleaner the number, the bigger the target.
In January 2024, EUR/USD approached 1.1000 for the first time in months. Retail positioning data showed massive stop loss orders at 1.0995-1.0998. On January 18th, price spiked to 1.0993, cleared the stops, then rallied to 1.1087 within six hours.
Previous Day High/Low
These levels are programmed into thousands of retail trading systems. The after hours trading guide shows how these levels become even more magnetic during low-liquidity sessions. Smart money algorithms specifically target these zones during the first hour of regular trading.
Moving Average Clusters
When the 50, 100, and 200-period moving averages converge within 1% of each other, they create a massive liquidity zone. Retail traders see "confluence" and pile in with tight stops. The October 2024 Apple earnings reaction showcased this perfectly — price dipped through the clustered MAs at $188, grabbed stops, then rallied to $195.
The Fibonacci Connection No One Talks About
Here's where smart money concepts intersect with Fibonacci analysis in ways most traders miss. Institutions don't just hunt stops at random levels — they target zones where multiple methodologies overlap.
The 61.8% Fibonacci retracement is already a high-probability reversal zone. But when it aligns with a round number or previous structure? That's a liquidity goldmine. The Fibonacci retracement trading strategy covers the basic zones, but the smart money twist changes everything.
Take the Bitcoin move from $38,000 to $48,000 in February 2024. The 61.8% retracement sat at $41,824. But the psychological level was $42,000. Guess where the stop hunt occurred? Price spiked to $41,750, cleared both zones of stops, then launched to $52,000.
The key is identifying these confluence zones before the hunt. Plot your Fibonacci levels, then look for nearby:
- Round numbers (within 0.5%)
- Previous week's high/low
- Major moving averages
- High-volume nodes from prior sessions
Building Your Liquidity Hunt Trading Plan
Theory is worthless without execution. Here's how to build a systematic approach to trading liquidity hunts:
Entry Rules — The 3-Confirmation System
- Identify the hunt zone: Mark areas where 3+ liquidity indicators overlap (round number + previous structure + technical level)
- Wait for the sweep: Price must pierce the level by 0.3% to 2% on above-average volume
- Confirm the reclaim: Price must close back above/below the hunted level within 4 candles
The "reclaim" is crucial. A genuine breakout keeps going. A liquidity hunt reverses quickly because the move's only purpose was to grab stops. No reclaim = no trade.
Stop Loss Placement — Beyond the Hunt
Place stops beyond the liquidity hunt spike, not at it. If price swept $41,750 to hunt stops at $42,000, your stop goes at $41,600. This requires wider stops than most retail traders use, which is why position sizing becomes critical.
The risk management plan template provides a framework, but for liquidity hunts, reduce position size by 40-50% compared to normal setups. The wider stops are necessary — getting stopped out at the exact hunt low defeats the entire strategy.
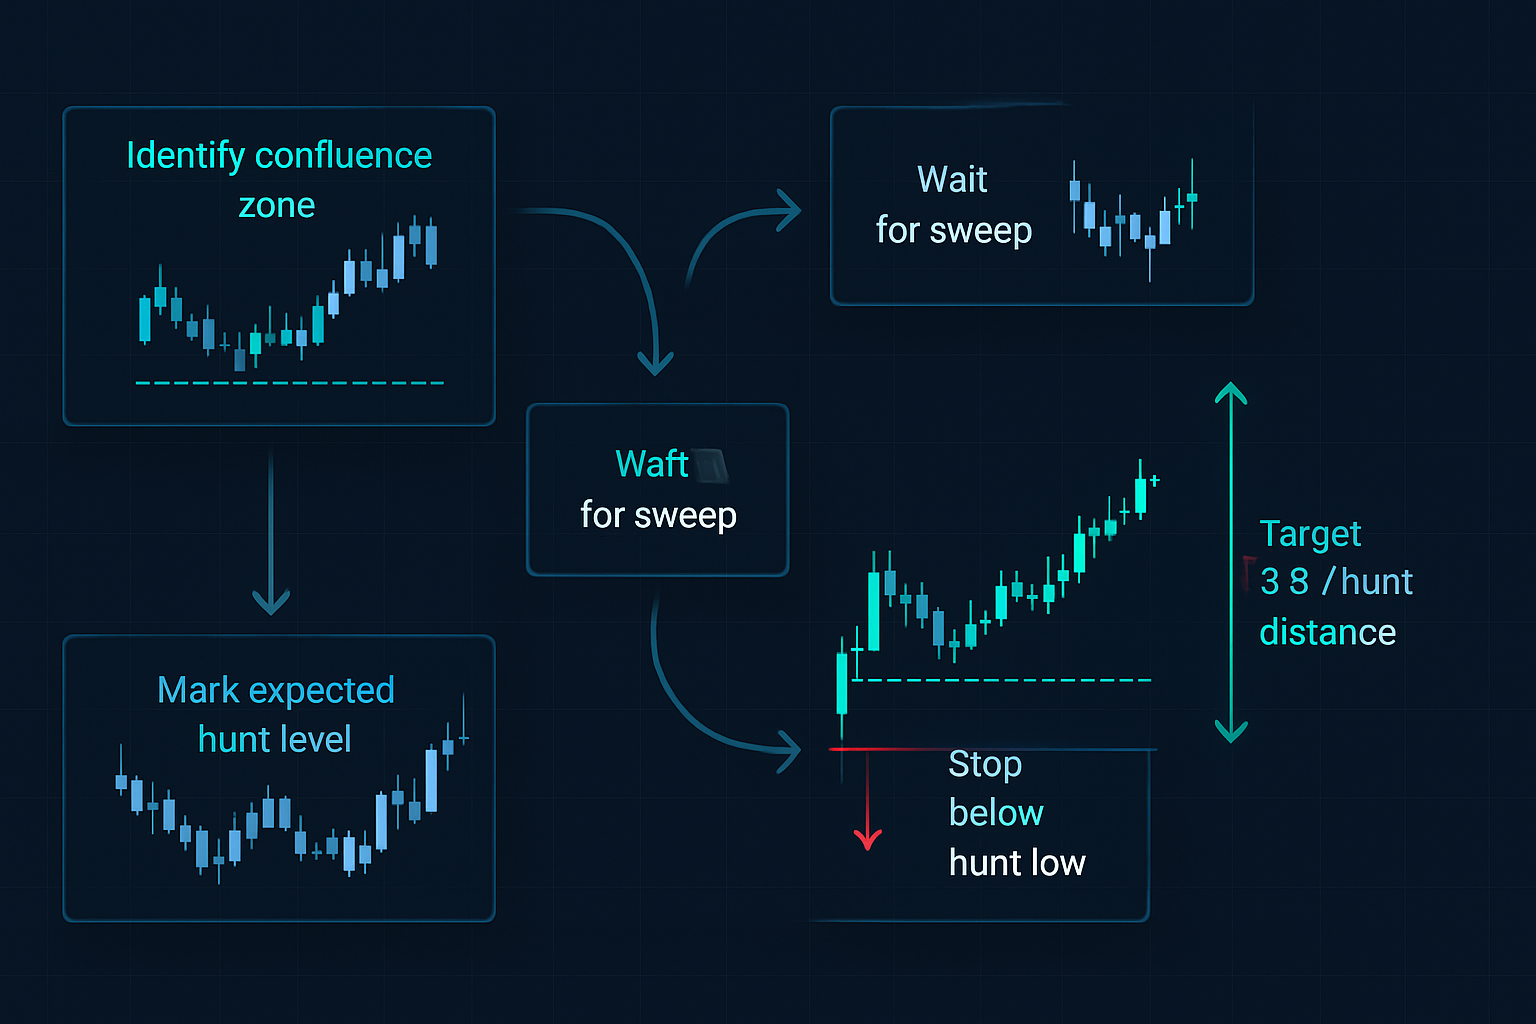
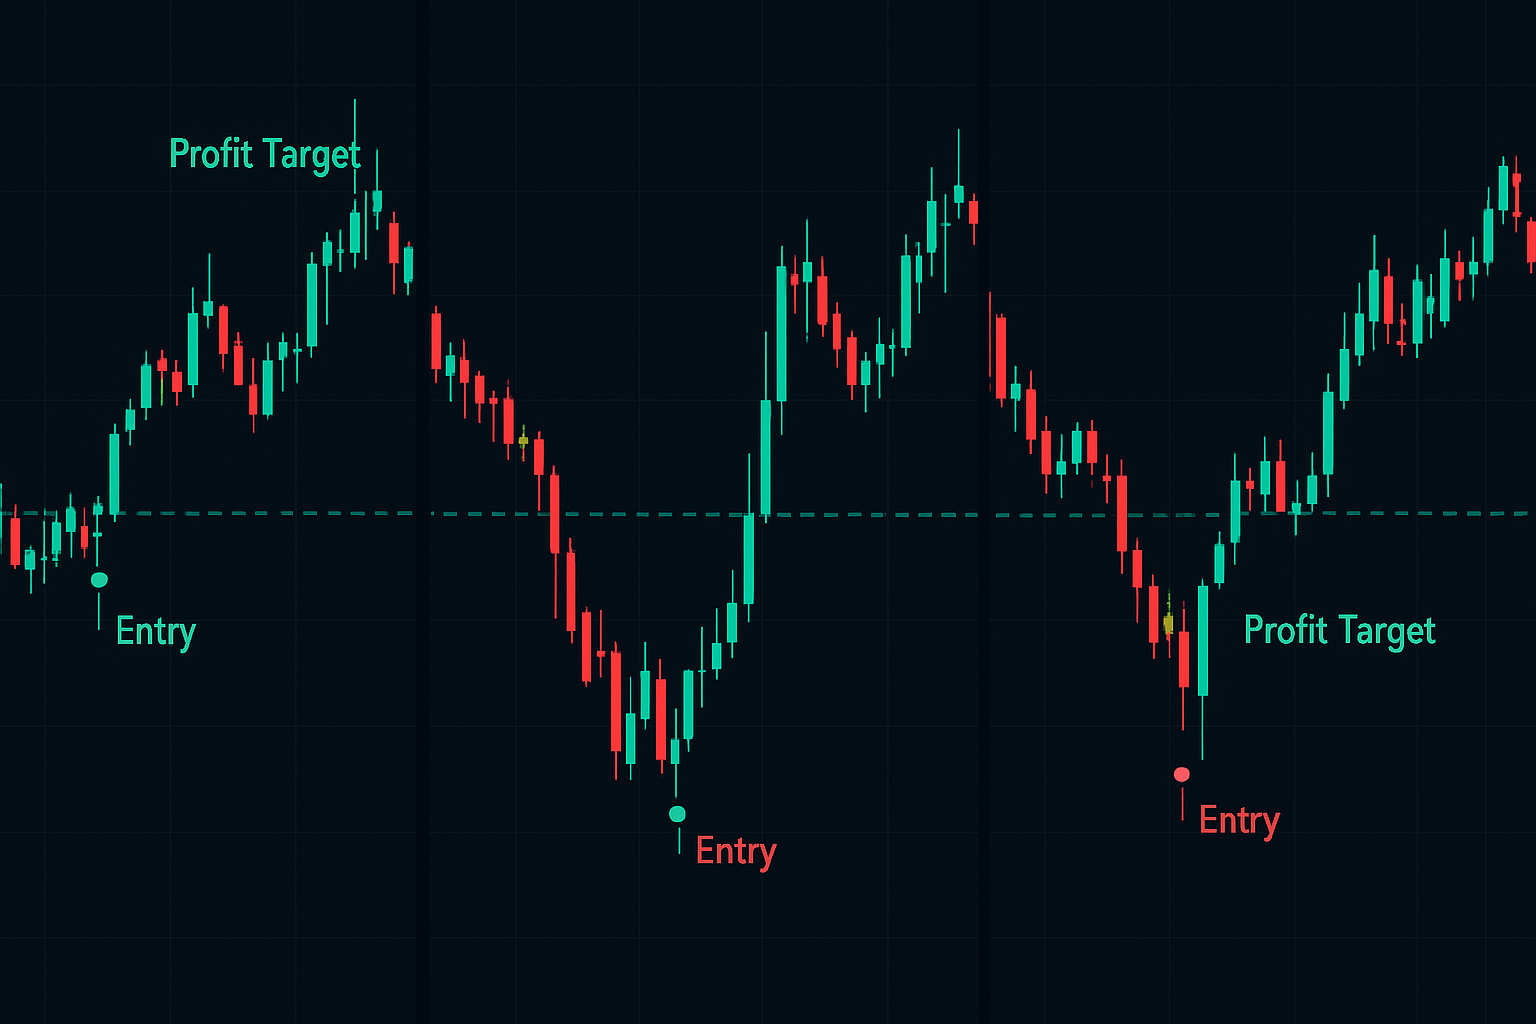
Profit Targets — The Measured Move
Liquidity hunts create explosive moves because they combine stop loss triggers (forced buying/selling) with smart money positioning. The minimum target should be 3x the hunt distance. If price hunted 50 pips below support, target 150 pips above.
But the real edge comes from scaling out. Take 50% profits at 3x, let the remainder run with a trailing stop. Some of the biggest moves in markets start with liquidity hunts — the GameStop squeeze began with a stop hunt below $20 before running to $483.
Advanced Patterns: When Smart Money Hunts Smart Money
As retail traders get savvier about liquidity hunts, the game evolves. Now we see double hunts — smart money hunting both directions before the real move. This happened with EUR/USD on December 4, 2024: hunt below 1.0500, rally to 1.0540, hunt above 1.0550, then the real move down to 1.0420.
The tell? Time. Single hunts resolve within 1-4 candles. Double hunts take 8-16 candles to complete both sweeps. If price is still ranging after the first hunt, expect a second hunt in the opposite direction.
Multi-timeframe confluence adds another layer. A liquidity hunt on the 1-hour chart might barely register on the daily. But when daily, 4-hour, and 1-hour hunt zones align? Those create the violent moves that make financial headlines. The CCI indicator multi-timeframe system can help identify when momentum aligns across timeframes after a hunt.
Common Mistakes That Kill Liquidity Hunt Trades
Mistake 1: Entering Too Early
Seeing price approach a liquidity zone isn't enough. Entering before the hunt means you become the liquidity. Wait for the sweep, wait for the reclaim, then enter. Patience pays multiples here.
Mistake 2: Using Tight Stops
This strategy requires accepting wider stops. If you can't handle 2% risk with reduced position size, liquidity hunt trading isn't for you. The trading journal guide emphasizes tracking your comfort with different stop sizes — this data is crucial for hunt trades.
Mistake 3: Fighting the Post-Hunt Move
Once a successful hunt completes and price starts moving, don't fade it expecting mean reversion. The whole point of hunting stops is to fuel a larger move. Trade with the post-hunt direction, not against it.
Mistake 4: Ignoring Session Context
Asian session hunts often get reversed in London. London hunts tend to stick through New York. Weekend gap hunts in crypto are particularly unreliable. Know which session you're trading and adjust expectations accordingly.
Integrating Smart Money Concepts With Your Current Strategy
You don't need to abandon your existing approach. Smart money concepts enhance other strategies by adding a new dimension of analysis. Here's how to integrate:
With Fibonacci Trading: Instead of buying every 61.8% retracement, wait for a liquidity hunt through the level first. The FibAlgo indicator library includes tools that can alert you when price approaches these confluence zones.
With Indicator Strategies: Divergences become more powerful after liquidity hunts. RSI showing oversold after a stop hunt below support? That's a high-probability reversal setup that combines technical analysis with order flow understanding.
With Pattern Trading: The triangle pattern trading guide shows standard breakout approaches. Add liquidity hunt analysis, and you'll spot the false breakouts that trap retail traders before the real move.
Real Market Examples From 2024-2025
Theory meets reality in these documented examples:
Tesla, September 2024: Strong resistance at $200 tested 4 times. Stops clustered at $202-203. September 19th pre-market spike to $203.50, immediate reversal, dropped to $185 over next three days. Classic distribution after liquidity grab.
Bitcoin, December 2024: Support at $95,000 held for two weeks. December 28th saw a spike to $93,400 in thin holiday trading. Reclaimed $95,000 within 2 hours, rallied to $98,500 by year-end. The crypto bull market strategy specifically mentions watching for these hunts during phase transitions.
GBP/USD, January 2025: Brexit-era low at 1.2000 had massive stop clusters. January 10th London open saw spike to 1.1975, triggering five-year stops. Immediate reversal led to 400-pip rally over the next week. The forex hedging strategy covered how to use correlation during these events.
The Psychology Behind Why This Works
Understanding the mechanics is one thing. Understanding why it works is what creates conviction during execution. Smart money doesn't hunt stops because they're evil — they do it because they have to.
Large institutions face a fundamental problem: size. Buying 10 million shares or $500 million of Bitcoin moves the market. Every purchase pushes price higher, increasing their average cost. The solution? Create liquidity by triggering stop losses, which generates the selling pressure needed to accumulate without moving price.
Retail traders, meanwhile, are taught to use "protective" stops that actually create vulnerability. The tighter and more obvious the stop, the bigger the target. The overtrading circuit breaker method touches on this psychology — the need for control through tight stops often creates worse outcomes.
This dynamic won't change because it can't change. As long as large players need liquidity and retail traders cluster stops at obvious levels, the hunting will continue. The only question is which side you're on.
Building Long-Term Success With Smart Money Concepts
Liquidity hunt trading isn't about catching every move. It's about identifying high-probability setups where institutional behavior is most predictable. Start with one market, one timeframe, and track every potential hunt zone for a month. You'll quickly see which patterns repeat.
The seasonal trading patterns guide shows how institutional behavior follows calendars. Liquidity hunts do too — month-end, quarter-end, and option expiration dates see increased hunting activity as large players adjust positions.
Most importantly, respect the learning curve. Your first trades should be smaller than normal. Track everything in your journal: the setup quality, the hunt depth, the reclaim speed, your emotional state. Data beats opinion when refining any strategy.
Smart money concepts transform how you see price action. Those "false breakouts" that stopped you out before? Now they're entry signals. Those "support failures" that confused you? Now they make perfect sense. The market hasn't changed — your understanding has.
The institutions running these strategies aren't going away. The algorithms hunting stops are only getting more sophisticated. You can either remain the liquidity, or learn to position yourself alongside the hunters. The FibAlgo trading community regularly shares real-time examples of these setups across different markets.
Every professional trader eventually learns this lesson: the market isn't random, it's designed to transfer money from the impatient to the patient, from the obvious to the hidden, from the many to the few. Smart money concepts simply reveal the mechanics behind that transfer. Now you can see it too.
❓Frequently Asked Questions
1What are smart money concepts in trading?
2How do you identify liquidity hunt zones?
3What's the difference between a liquidity hunt and a real breakout?
4Can smart money concepts work in crypto markets?
5How much wider should stops be when trading liquidity hunts?