The Morning I Discovered Markets Have Temperature
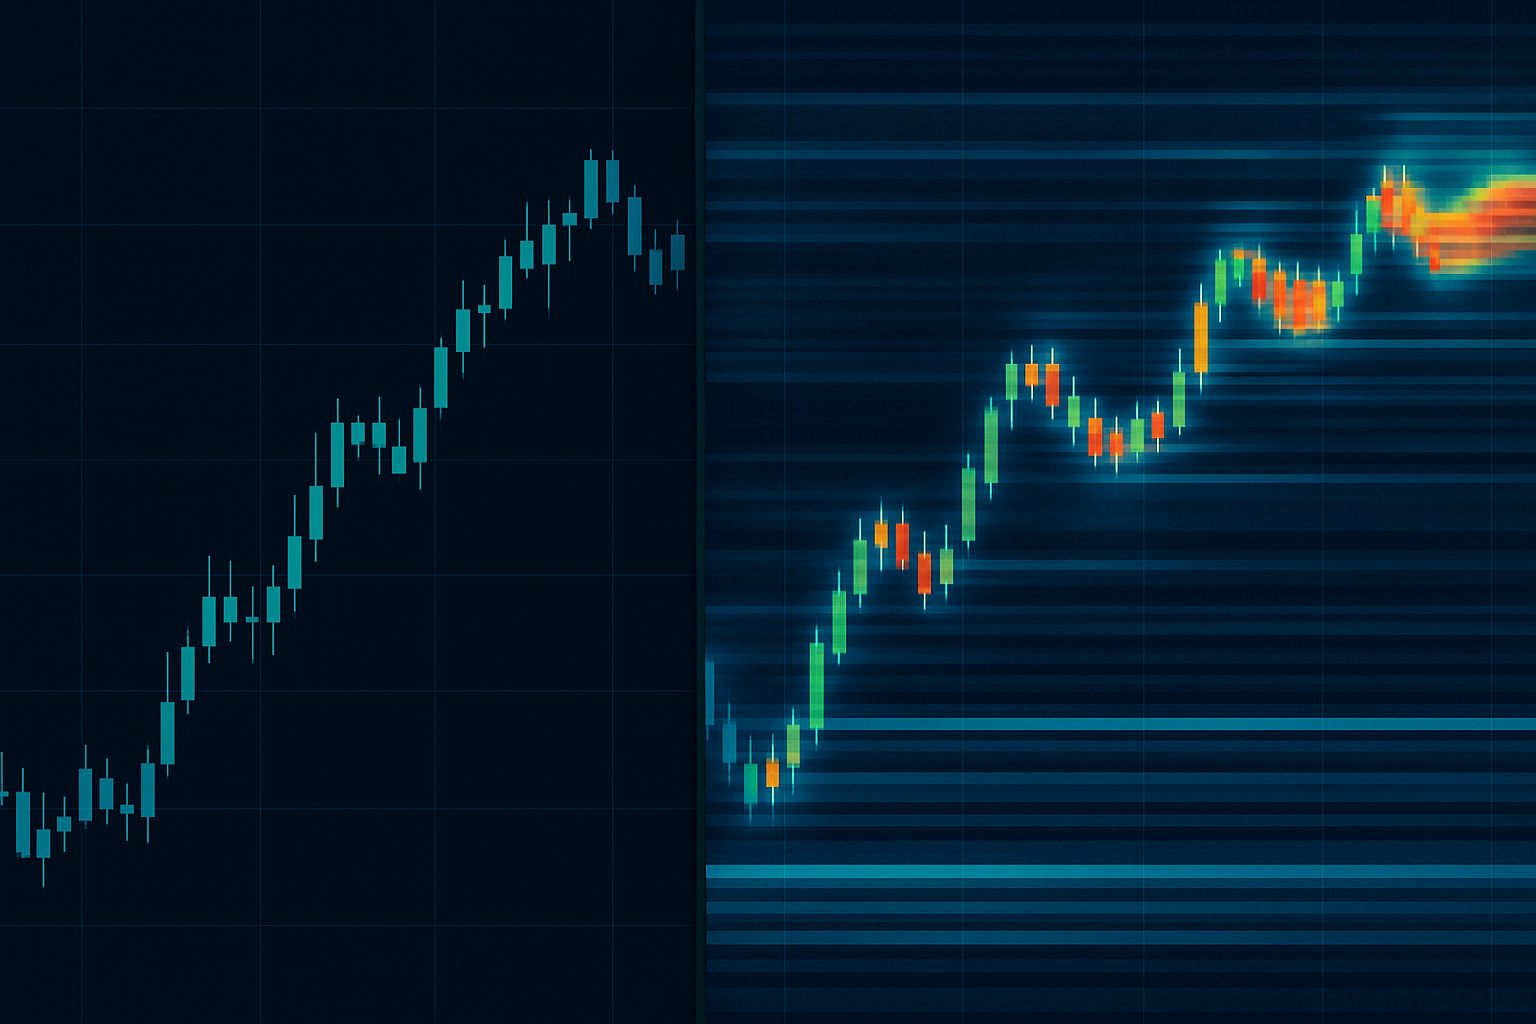
9:31:42 AM, September 17, 2018. SPY gaps up $2.47, then reverses violently, dropping $3.15 in eleven minutes. I'm watching the same candlestick patterns I've stared at for six years, but something clicks. The market isn't moving — liquidity is flowing like heat from cold zones to hot zones.
My mentor Mike at T3 always said "watch where money goes, not where price goes." That morning, I finally understood. Price is just the thermometer. Liquidity is the heat.
After 9 years of pure price action trading, I've mapped exactly how this thermal dynamic controls the first 30 minutes of every trading day. No indicators, no oscillators — just understanding where liquidity wants to flow.
How Liquidity Thermal Dynamics Actually Work
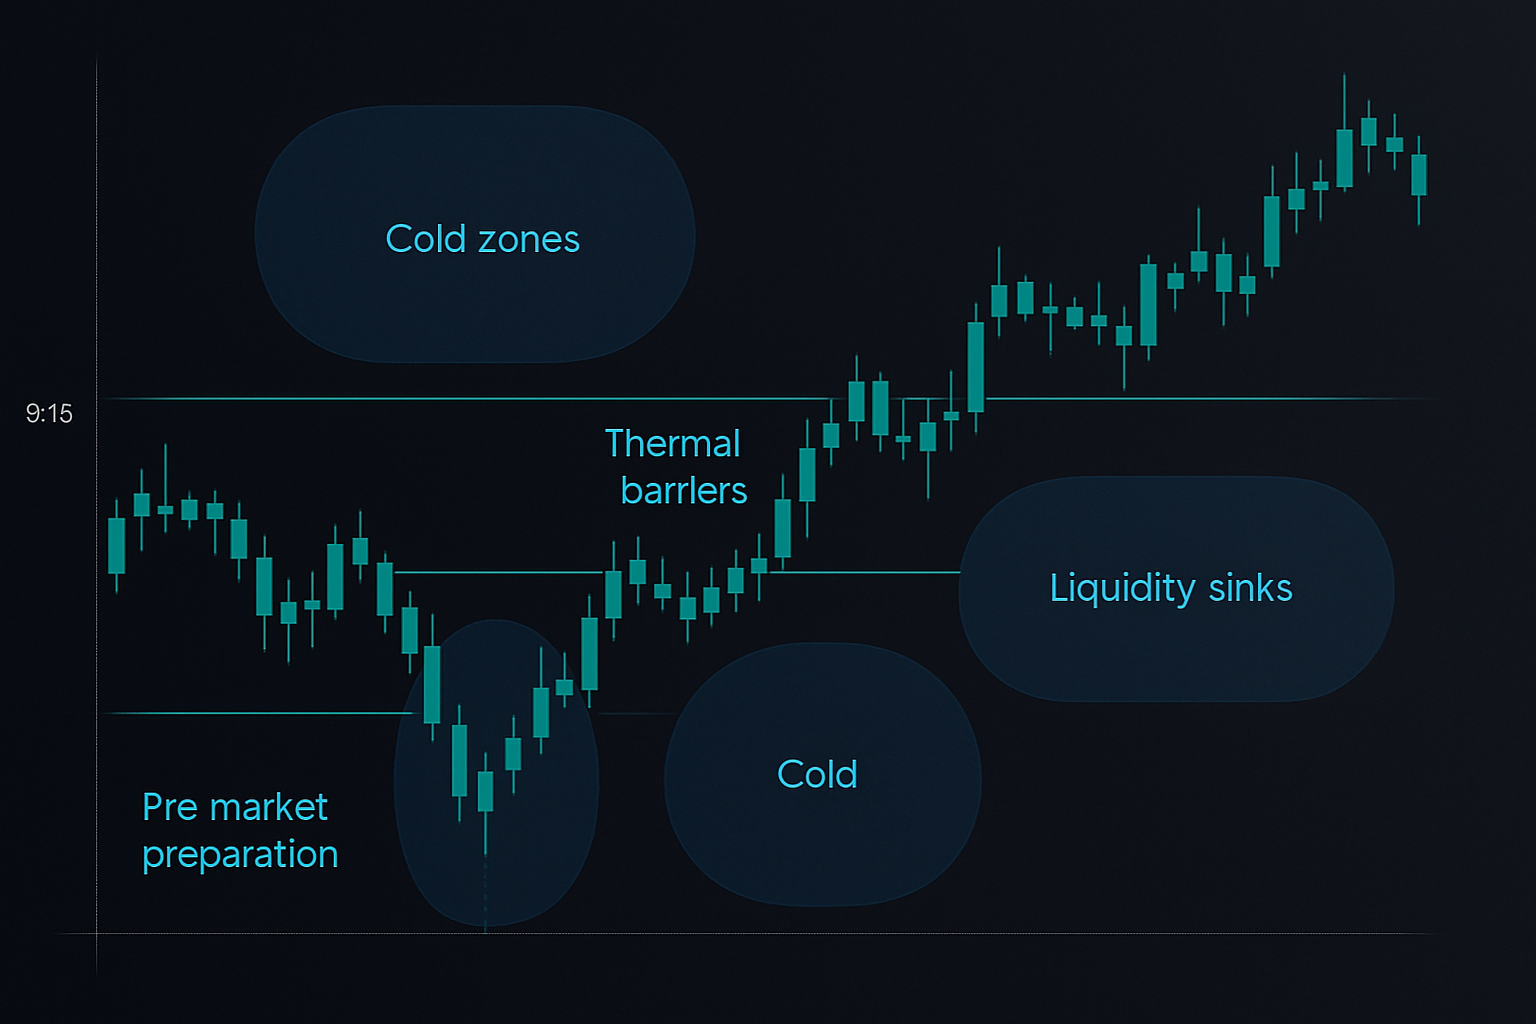
Think of pre-market as a pressure cooker. Orders accumulate at specific price levels, creating "cold zones" of concentrated liquidity. When the market opens, these zones interact like temperature differentials in physics — liquidity flows from high concentration (cold) to low concentration (hot).
Here's what I track every morning at 9:15 AM:
- Pre-market volume nodes (cold zones)
- Gap levels from overnight (thermal barriers)
- Yesterday's high/low (magnetic zones)
- Round numbers (liquidity sinks)
The magic happens when regular trading begins. Institutional algorithms scan for these thermal imbalances and position accordingly. Retail traders see random volatility. I see predictable heat flow.
February 3, 2020. TSLA opens at $786.14 after earnings. The pre-market showed massive cold zones at $780 and $790. Classic thermal sandwich. At 9:30, price bounces between these levels for exactly 7 minutes before heat flows upward, breaking $790. Next stop? $805 — the next cold zone. Thermal dynamics in action.
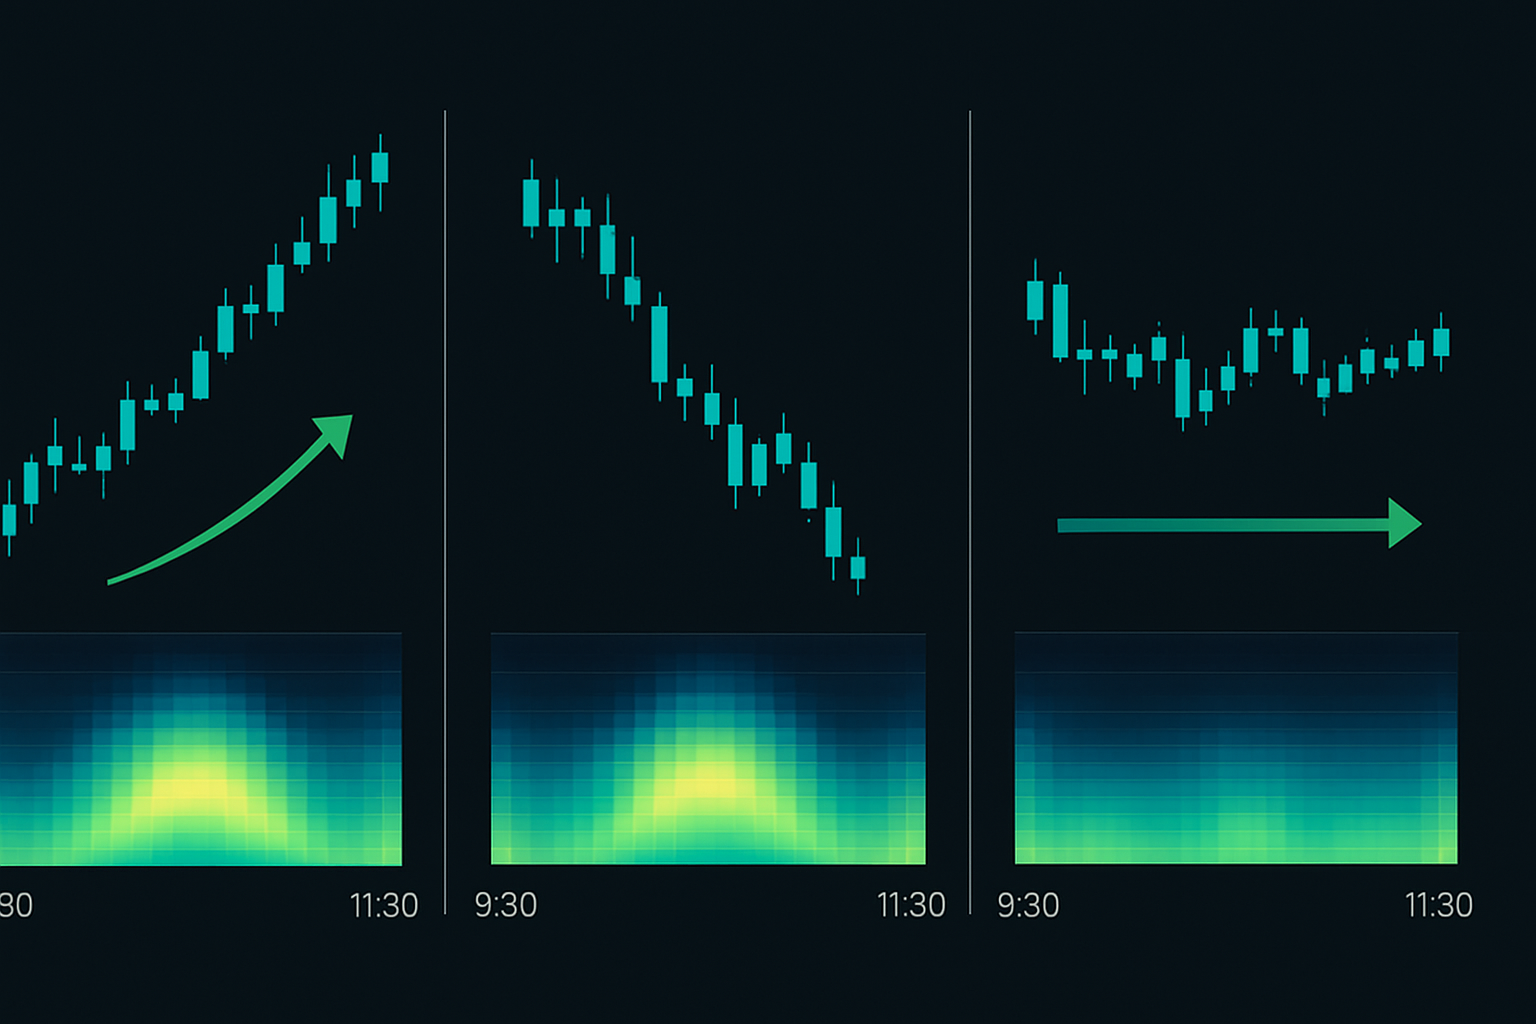
The Three Thermal Patterns That Dominate Opens
Pattern 1: The Equilibrium Melt
Most common pattern (occurs ~40% of opens). Pre-market creates balanced cold zones above and below the opening price. First 5-10 minutes show tight range as heat equalizes. Then — explosive directional move as equilibrium breaks.
October 15, 2021, QQQ opens at $367.82. Cold zones at $367 and $368.50. Eleven minutes of equilibrium, then boom — thermal break to $370.25. If you understand the physics, you're positioned before the move.
Pattern 2: The Vacuum Pull
When overnight action creates a liquidity vacuum (no volume nodes in a price range), the market open acts like a thermal vacuum — price gets pulled violently toward the nearest cold zone.
Real example: March 8, 2022, SPY gaps down to $418.76. Zero volume nodes between $419-421 overnight. At 9:30, thermal vacuum pulls price straight to $421.34 in 8 minutes. No resistance because no liquidity.
Pattern 3: The Cascade Failure
My favorite pattern. Multiple cold zones stacked closely together. When one breaks, thermal cascade triggers, flowing through each level like dominoes.
June 13, 2022, 9:30 AM. SPY has cold zones at $374, $375.50, and $377. First zone breaks at 9:38. By 9:52, all three are breached. Total move: $4.85 in 22 minutes.
Reading Temperature in Real-Time
Forget Level 2, forget DOM — for the first 30 minutes, all I need is:
- Volume at each price level (1-minute bars)
- Speed of price movement between levels
- Time spent at each level
Slow movement between levels = cold liquidity ahead. Fast movement = thermal vacuum. Time consolidating = heat dissipating, preparing next move.
This morning (March 15), ES futures showed classic thermal setup. Cold zones at 4,187 and 4,195. Open at 4,191. Spent 6 minutes in equilibrium, then thermal break north. Hit 4,195 at 9:41 AM. Textbook thermal flow.
The Opening Range Trap
Traditional opening range breakout strategies fail because they ignore thermal dynamics. They wait for price to break yesterday's high or the first 30-minute range. By then, the thermal move is over.
Example: Trader waits for SPY to break above first 30-minute high at $421.50. But thermal analysis showed all cold zones already absorbed by 9:45 AM. The breakout fails because there's no liquidity left to fuel it.
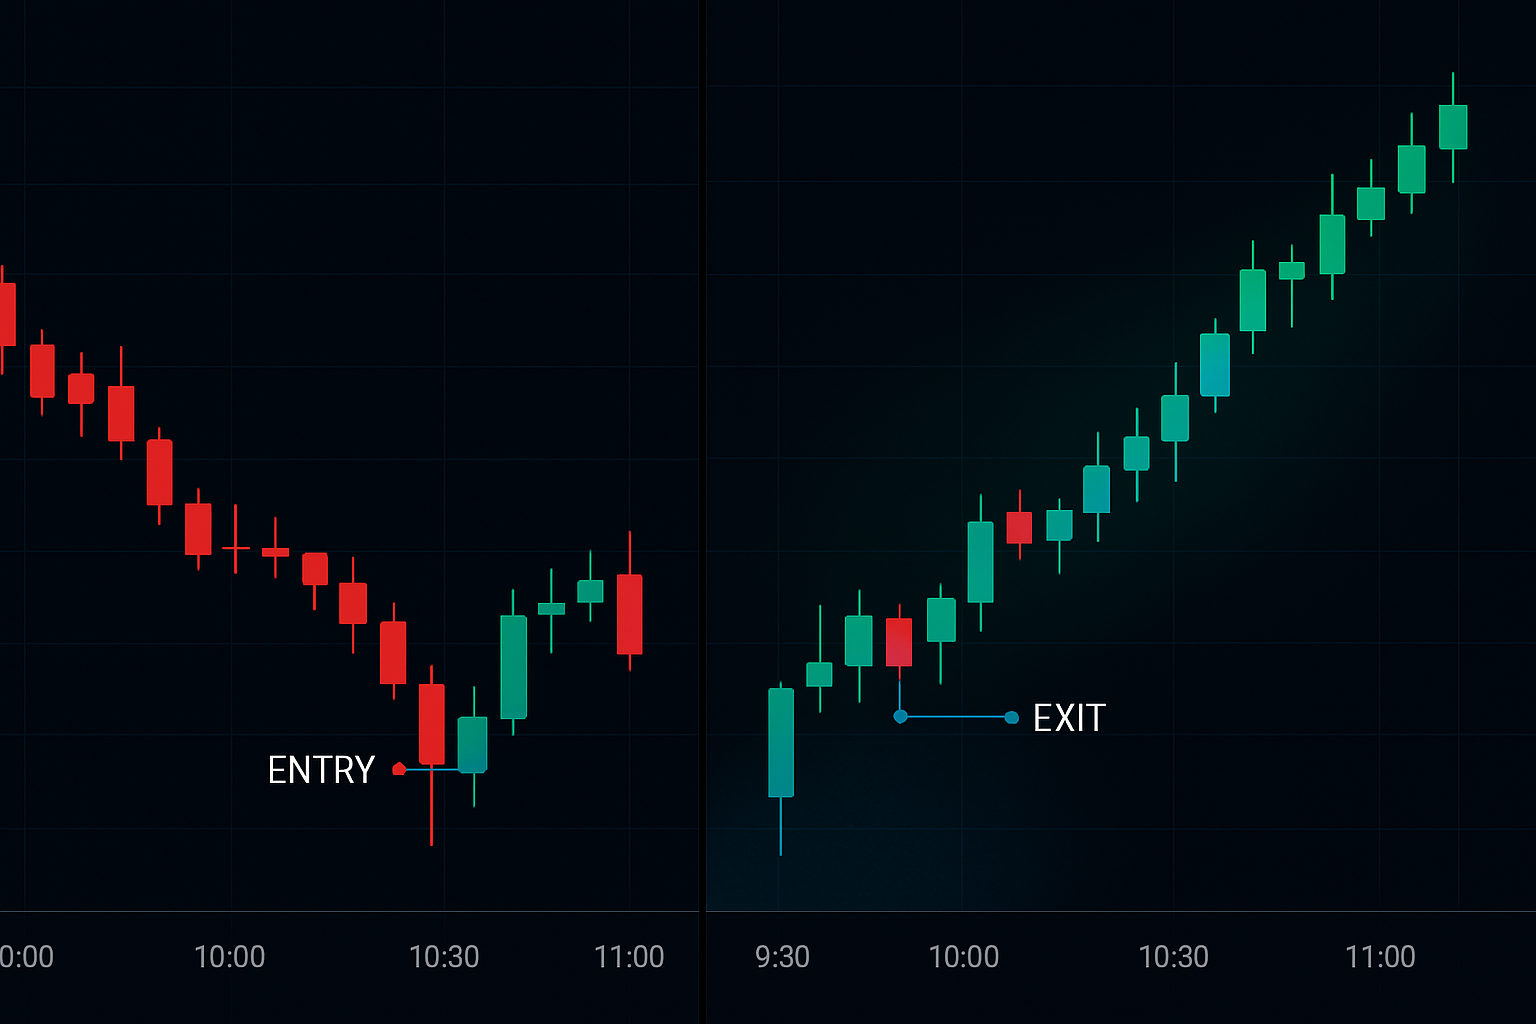
My approach: Trade WITH thermal flow, not after arbitrary time ranges. When liquidity flows from cold to hot zones, I'm already positioned. When traditional ORB traders enter, I'm exiting.
Practical Application: Your Next Market Open
Tomorrow morning, do this:
9:15 AM: Map your cold zones. Look for overnight volume peaks, yesterday's significant levels, round numbers. Mark them on your chart.
9:25 AM: Identify thermal structure. Are cold zones balanced (equilibrium setup)? Is there a vacuum between levels? Are zones stacked (cascade potential)?
9:30 AM: Watch the first 3-5 minutes. Don't trade. Let initial heat dissipate. Identify which pattern is forming.
9:35-9:45 AM: Execute based on thermal flow. Enter when price approaches cold zones with momentum. Exit when heat dissipates (volume drops, movement slows).
Risk management: Stop loss beyond the next cold zone. If thermal flow reverses through your stop level, the pattern failed. Position size for 1% risk — market opens are violent.
Why Most Traders Can't See This
They're watching indicators lag price. RSI, MACD, moving averages — all calculating what already happened. Meanwhile, liquidity thermal dynamics show what's about to happen.
My screens at T3 Trading had 12 monitors. You know what helped most? Turning 11 of them off. One chart, clean candlesticks, volume at price. That's where thermal dynamics live.
The smart money liquidity hunt concepts explain the predatory side. Thermal dynamics explain the physics. Combine them, and market opens become predictable.
Common Thermal Trading Mistakes
After teaching this to dozens of traders, same mistakes appear:
Mistake 1: Trading before thermal equilibrium. Those first 3-5 minutes are chaos. Algorithms fighting for position. Wait for initial heat to settle.
Mistake 2: Ignoring pre-market structure. If you don't map cold zones before the open, you're flying blind. The pre-market gap analysis framework shows how to read overnight action.
Mistake 3: Holding too long. Thermal moves are violent but brief. When movement slows, heat has dissipated. Take profits. First 30 minutes only.
Mistake 4: Using tight stops. Market open liquidity is thick. Spreads are wide. Your stop needs room to breathe. The stop loss placement guide covers this in detail.
Advanced Thermal Concepts
Once you master basic thermal flow, three advanced concepts separate professionals:
Thermal Exhaustion: When price reaches a cold zone but can't penetrate. Volume spikes but price stalls. This signals thermal reversal incoming. Exit longs, prepare for shorts.
Multi-Asset Thermal Correlation: SPY and QQQ often show opposing thermal patterns. When SPY has upward thermal pull but QQQ shows exhaustion, expect sector rotation. The intermarket analysis framework explains these correlations.
News Thermal Disruption: Economic releases at 8:30 AM create artificial cold zones. These act as thermal attractors when market opens. Different dynamics than organic thermal flow.
Integration with Other Strategies
Thermal dynamics enhance any day trading approach. Combine with:
- Volume profile analysis for deeper liquidity understanding
- VWAP strategies after thermal equilibrium (usually post-10 AM)
- Fibonacci retracements to identify thermal target zones
But remember — during the first 30 minutes, thermal dynamics dominate everything else. This is when FibAlgo's real-time liquidity detection really shines, highlighting institutional flow patterns as they develop.
The Reality of Market Open Trading
After 9 years and roughly 2,250 market opens, here's the truth: The first 30 minutes offer the cleanest opportunities IF you understand the physics.
Most traders see chaos. Random gaps, violent swings, wide spreads. They wait for "things to settle down." By then, thermal moves are complete. Opportunity gone.
I see physics. Heat flowing from cold zones to hot zones. Predictable patterns repeating every morning. Same dynamics whether it's SPY, AAPL, or BTCUSD.
The tape reading masters of previous generations understood this intuitively. They called it "feeling the market." Now we can visualize it, map it, trade it systematically.
Your edge isn't in complex indicators or AI predictions. It's in understanding the simple physics of how liquidity behaves when 9:30 AM arrives and millions of orders hit the market simultaneously.
Tomorrow morning, forget everything except this: Find the cold zones. Wait for equilibrium. Trade with thermal flow. Exit when heat dissipates.
That's your market open trading strategy. Everything else is noise.