September 14, 2021: The AAPL Trade That Opened My Eyes
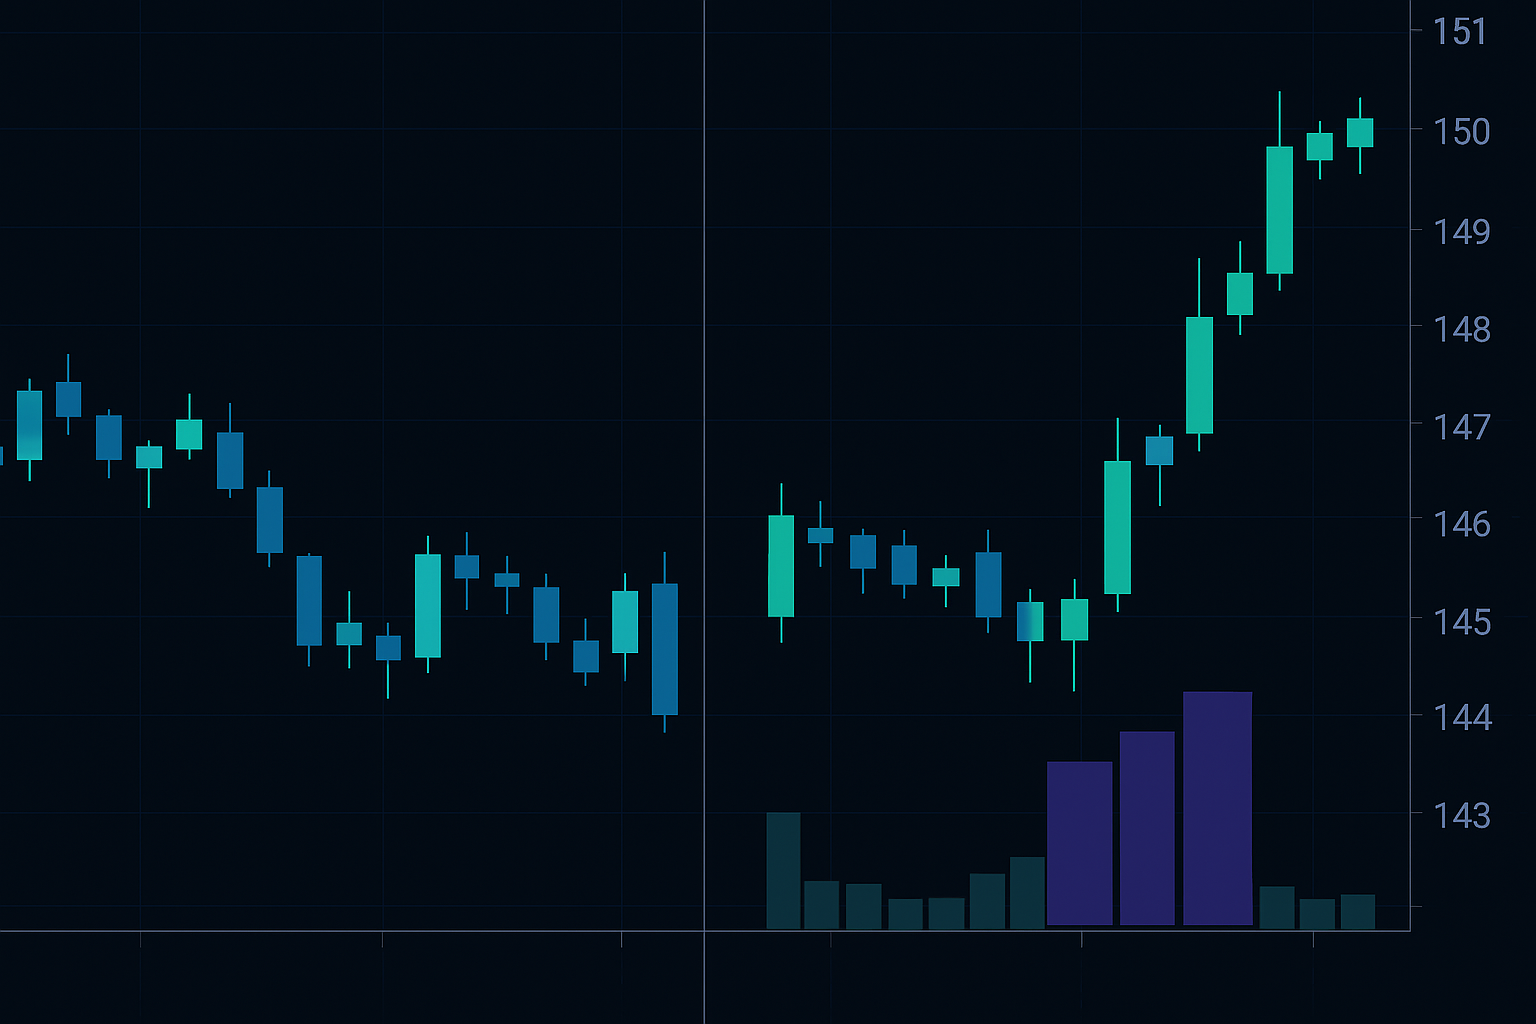
Apple was trading at $148.12, bouncing lazily between support and resistance. The charts looked dead neutral. RSI at 52. No divergences. Volume dying off into the close. Every technical indicator screamed "do nothing."
Then my dark pool scanner lit up like a Christmas tree. $847 million in AAPL prints at $148.75 — all hitting within a 7-minute window between 3:42 and 3:49 PM. Not on the tape. Not moving the price. Complete radio silence on Level 2.
I'd seen this pattern before at JPMorgan. When institutions need to move serious size without alerting the market, they don't slam the bid. They route through dark pools — private exchanges where large blocks trade away from public view. The footprints are there if you know where to look.
AAPL gapped up to $151.30 the next morning. Those dark pool prints weren't random. They were positioning.
What Dark Pools Actually Are (And Why Retail Gets It Wrong)
Let me clear up the conspiracy theories first. Dark pools aren't some shadowy cabal manipulating prices. They're registered Alternative Trading Systems (ATS) designed to facilitate large institutional trades without market impact.
Think about it from an institutional perspective. You're running a $2 billion fund and need to buy 500,000 shares of MSFT. Hit the market with that order and you'll push the price up 50 basis points before you're half filled. Dark pools solve the market impact problem.
Major dark pools include Crossfinder (Credit Suisse), Sigma X (Goldman Sachs), and BIDS Trading. Combined, they handle about 15% of US equity volume — roughly $400 billion daily. That's not manipulation. That's liquidity.
But here's what most retail traders miss: while these trades happen in private, they still leave footprints. Every dark pool execution must be reported to the consolidated tape within 10 seconds. The key is knowing how to interpret these prints in context.
This connects directly with what I covered in my smart money concepts framework — institutions move differently than retail, and dark pools are one of their primary tools.
The Five Dark Pool Indicators I Actually Track
After 14 years of watching institutional flow, I've narrowed it down to five reliable dark pool indicators. Forget the 47 different metrics some platforms push. These five tell you what you need to know.
1. Block Print Size Relative to Average Daily Volume (ADV)
Raw numbers mean nothing without context. A $10 million print in AAPL? Tuesday. A $10 million print in PLTR? Someone knows something.
I track prints that exceed 0.5% of ADV in a single execution. When multiple prints exceed 1% of ADV within a 30-minute window, institutions are building positions. This threshold filters out the noise and highlights genuine accumulation.
2. Print Clustering Patterns
Single prints can be hedging, rebalancing, anything. But when I see 3+ large prints within 30 minutes, all executed within 0.2% of each other? That's coordinated accumulation. Institutions splitting orders across multiple dark pools to mask their true size.
3. Price Relative to VWAP
This is crucial. Dark pool prints above VWAP suggest urgent buying — institutions willing to pay up. Prints below VWAP often indicate distribution or short positioning. The relationship changes everything about how you interpret the flow. I explored this concept deeper in my VWAP trading strategy guide.
4. Time of Day Analysis
Institutional behavior follows patterns. Accumulation typically happens 9:30-11:00 AM and 2:30-3:30 PM. Distribution often occurs 11:30 AM-1:00 PM and final 30 minutes. Dark pool prints outside these windows — especially pre-market or after-hours — usually signal something significant.
5. Cross-Asset Dark Pool Correlation
When I see dark pool accumulation in XLF (financials) coinciding with selling in TLT (bonds), that's sector rotation. These cross-asset flows often precede major moves by 24-48 hours.
Reading the Prints: Context Is Everything
Here's where most dark pool traders fail. They see a big print and immediately go long. That's like buying every time you see volume spike. Context determines whether that print is accumulation, distribution, hedging, or arbitrage.
Let me walk you through a recent example. February 5, 2026, NVDA trading at $987. Dark pool scanner shows a $450 million print at $988.50. Bullish, right?
Not so fast. Check the context: - Print occurred at 3:47 PM (late day) - Price was extended 8% above the 20-day moving average - On-balance volume showing distribution for three days - VIX rising despite market grinding higher
That wasn't accumulation. That was distribution into strength. NVDA dropped 5.2% over the next three sessions.
Compare that to MSFT on January 28, 2026. $70 million print at $412, representing 1.1% of ADV. But this time: - Print at 10:15 AM (prime accumulation window) - Price consolidating at 50-day MA after pullback - Three similar prints in the previous 48 hours - Sector rotation into tech visible in XLK dark pools
Classic accumulation pattern. MSFT ran to $428 within a week.
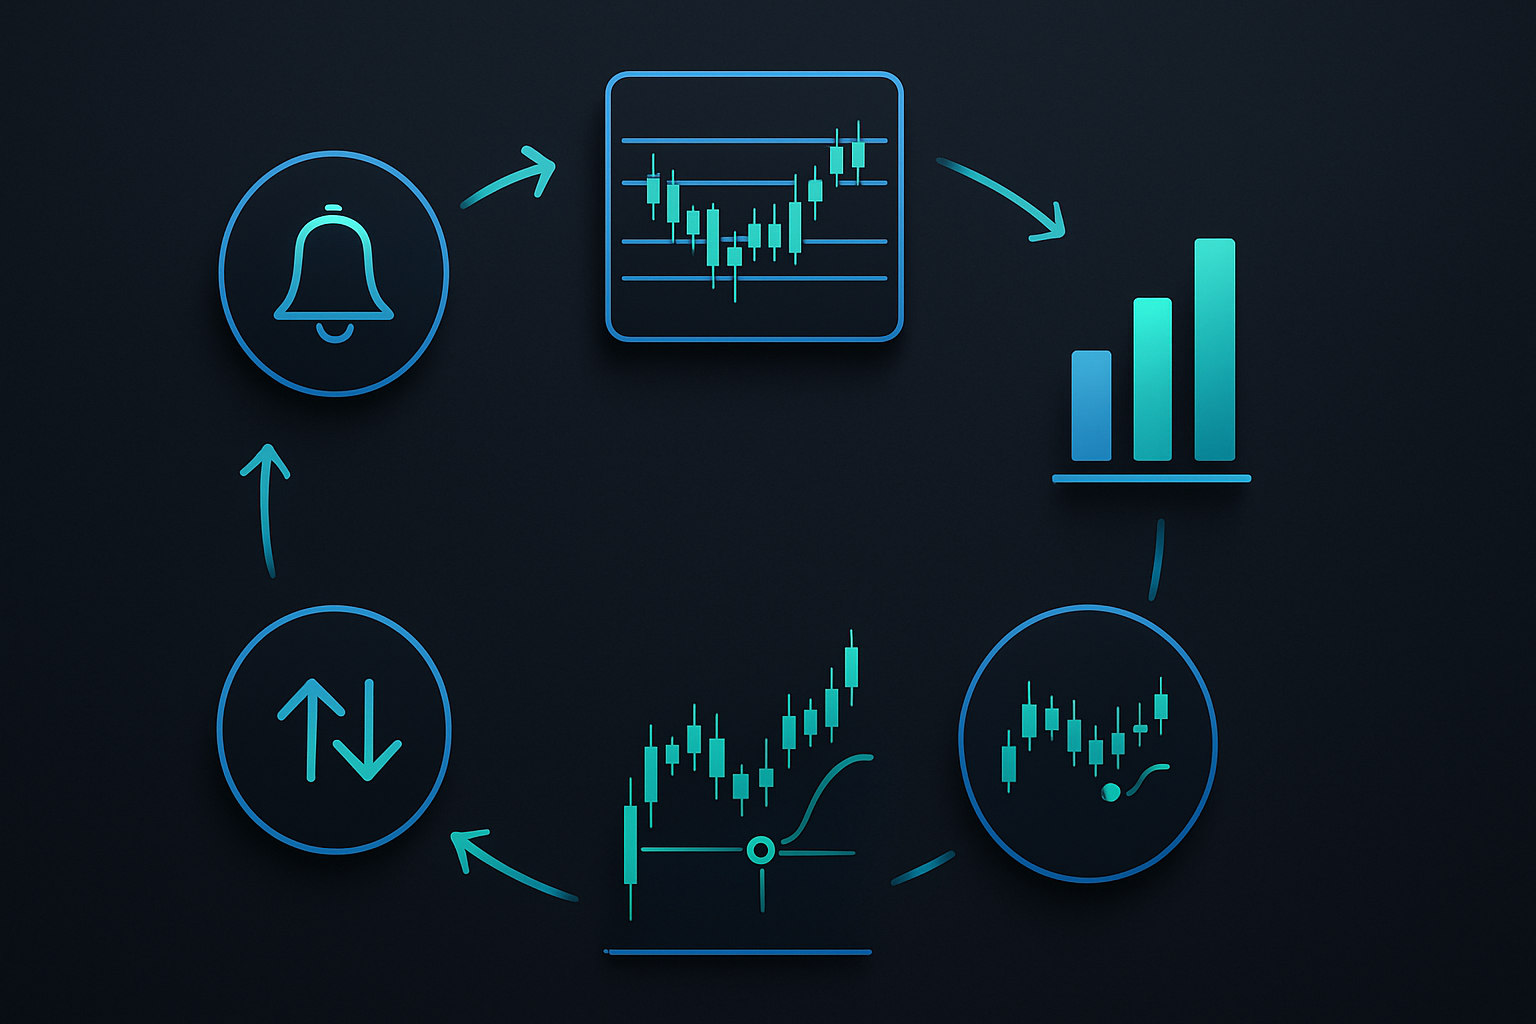
The Integration Framework: Dark Pools + Price Action
Dark pool data is powerful but incomplete. I never trade it in isolation. Here's my integration framework that's kept me profitable through three market regimes.
Step 1: Identify Significant Dark Pool Activity
Prints exceeding 1% ADV or clustered prints totaling 2%+ ADV. Flag these for deeper analysis.
Step 2: Assess Market Structure
Where is price relative to key levels? I use Fibonacci retracements and market profile to identify whether we're at logical accumulation or distribution zones.
Step 3: Confirm with Traditional Volume
Dark pool buying should eventually show up in regular volume. If I see dark pool accumulation but declining on-exchange volume for multiple days, something's off.
Step 4: Time Your Entry
I don't chase dark pool prints. I wait for price to return to VWAP or a key support level, then enter with stops below the dark pool print price. This approach has saved me countless bad entries.
Step 5: Manage Based on Flow Continuation
If dark pool activity continues in my direction, I add. If it reverses, I'm out. No ego, just flow.
Common Dark Pool Misinterpretations
I see these mistakes constantly, even from experienced traders. Let me save you some tuition.
Mistake 1: Assuming All Large Prints Are Directional
Not every dark pool print represents a directional bet. Market makers hedge options flow through dark pools. Index funds rebalance through dark pools. Merger arbitrage, pairs trades, portfolio insurance — all create large prints that mean nothing for direction.
I filter for this by checking options flow concurrently. If I see massive call buying alongside dark pool prints, that's directional. Dark pool prints with balanced options flow? Probably hedging.
Mistake 2: Ignoring the Spread
Dark pool executions at the bid suggest selling pressure, even if the raw number is large. Prints at the ask indicate buying. Prints at the midpoint? Often just crossed internal orders with no directional bias. This nuance matters.
Mistake 3: Trading Every Print
Information overload kills accounts. I see traders with 15 different dark pool scanners, alerts every 30 seconds, trying to trade every print over $5 million. That's not trading — that's gambling with extra steps.
Focus on prints that exceed 1% ADV in liquid names. Quality over quantity. As I discussed in my overtrading prevention guide, discipline beats activity every time.
Mistake 4: Neglecting Sector Context
A $100 million dark pool print in JPM might be bullish for the bank. But if you're seeing simultaneous selling in BAC, WFC, and C, that JPM print could be sector rotation, not broad accumulation. Always check correlated names.
Current Market Application: February 2026 Dark Pool Signals
With the Crypto Fear & Greed Index at 7 and extreme fear dominating markets, dark pool activity has shifted dramatically. Here's what I'm seeing right now:
Technology Sector: Massive distribution above $1 million per print in growth names. ARKK components seeing 3-5% of ADV in dark pool selling daily. But here's the contrarian signal — defensive tech (MSFT, AAPL) showing steady accumulation below current prices.
Cryptocurrency-Linked Equities: COIN, MARA, RIOT all showing dark pool accumulation despite the fear. Prints coming in 2-3% below current prices, suggesting institutions are building positions for the next cycle. This aligns with the accumulation patterns I've observed in previous crypto winters.
Fixed Income: Unusual dark pool activity in TLT and IEF. Large prints at the ask despite rising yields. Someone's betting on a flight to quality or expecting the Fed to pause.
Technology Stack for Dark Pool Analysis
You don't need a Bloomberg Terminal to track dark pools effectively. Here's my setup:
Primary Platform: FlowAlgo for real-time dark pool alerts. Costs $149/month but pays for itself with one good trade. Set filters for >$10 million prints and >1% ADV to reduce noise.
Confirmation Tools: TradingView for charting with FibAlgo indicators to identify key levels where dark pool activity matters most. The multi-timeframe confluence alerts help spot when dark pool accumulation aligns with technical setups.
Options Flow: Unusual Whales for concurrent options activity. Dark pools + unusual options = highest conviction setups.
Sector Analysis: Koyfin for tracking cross-sector dark pool flows. Free version sufficient for most traders.
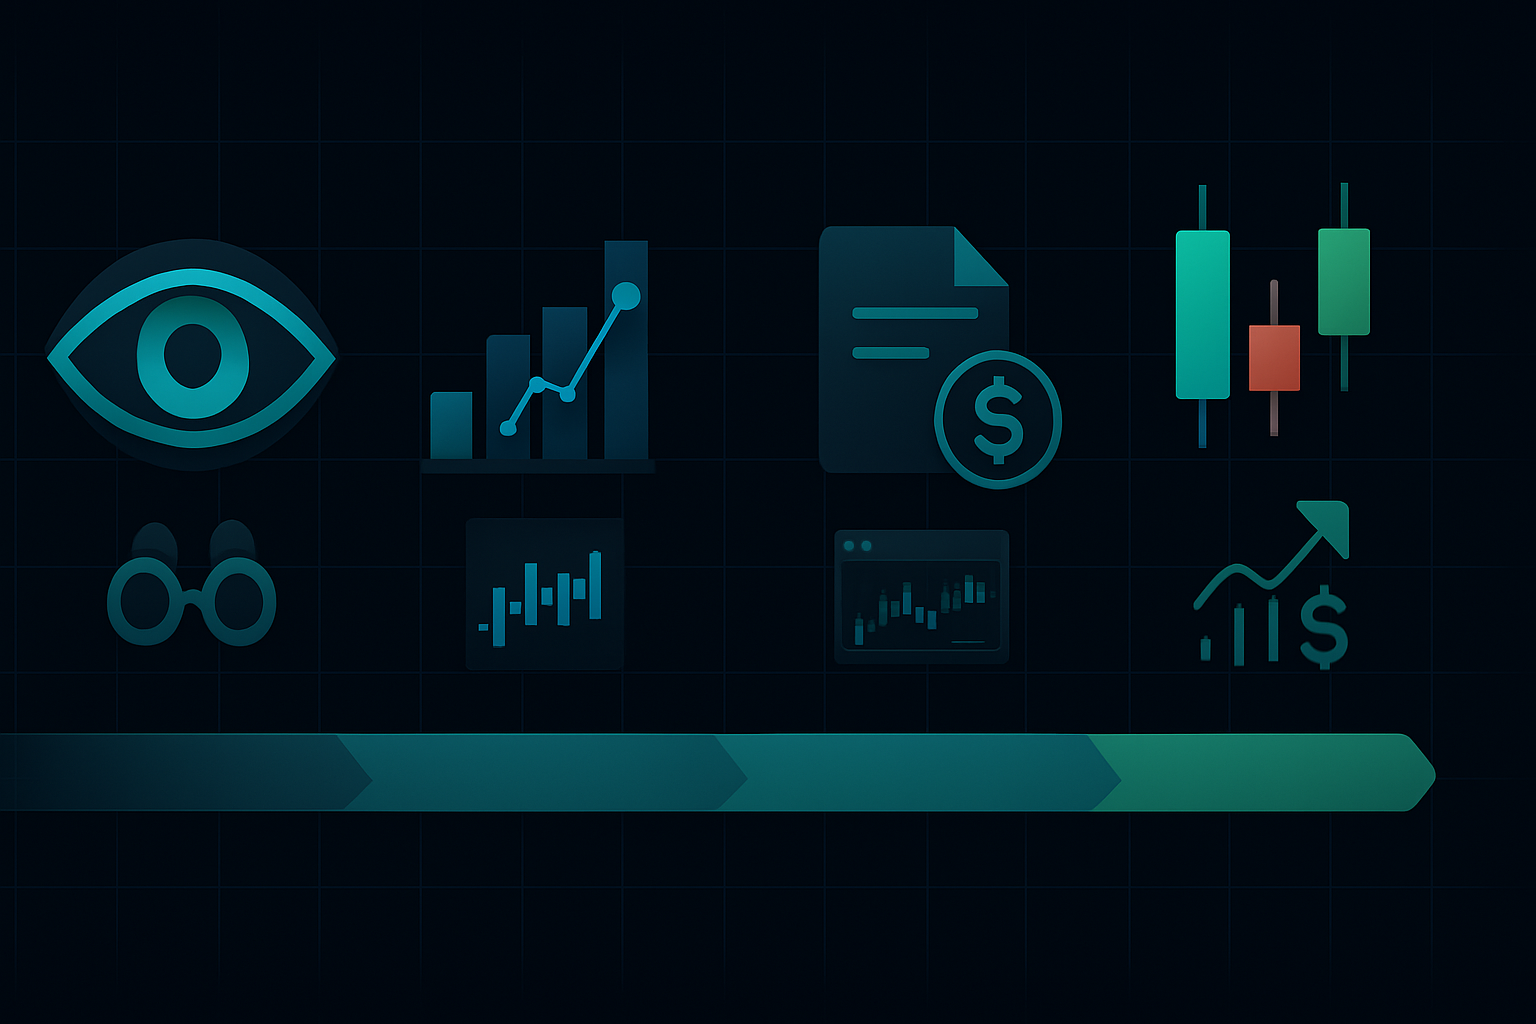
Building Your Dark Pool Trading System
Don't try to master everything at once. Start with these steps:
Week 1-2: Focus solely on observing. Track dark pool prints in 5 liquid names you know well. Note print size, time, price relative to VWAP. Don't trade — just observe patterns.
Week 3-4: Begin correlating dark pool activity with next-day price action. Which prints led to moves? Which were noise? Build your personal threshold levels.
Week 5-6: Paper trade using dark pool signals combined with your existing strategy. Never let dark pools override risk management as outlined in my position sizing framework.
Week 7+: Live trading with small size. One dark pool-influenced trade per day maximum until you prove consistency.
The Reality of Dark Pool Trading
After 14 years watching institutional flow, here's the truth: dark pool indicators are confirmation tools, not crystal balls. They show you what smart money did, not what it will do.
The edge comes from understanding the context, filtering the noise, and integrating dark pool data with solid technical analysis. When a $500 million dark pool print aligns with a key Fibonacci level, strong market profile point of control, and sector rotation — that's when you have something worth trading.
But remember: institutions use dark pools precisely because they don't want to impact price. By the time you see the print, the smart money has already positioned. Your job is to determine whether there's more to come or if you're seeing the end of the move.
Start small. Track five liquid names. Build pattern recognition before risking capital. And never forget — the best dark pool signal is the one that confirms what price action is already suggesting.
The institutions aren't hiding. They're just speaking a different language. Time to become fluent.


