The Night EUR/CHF and Gold Betrayed 12 Years of Marriage
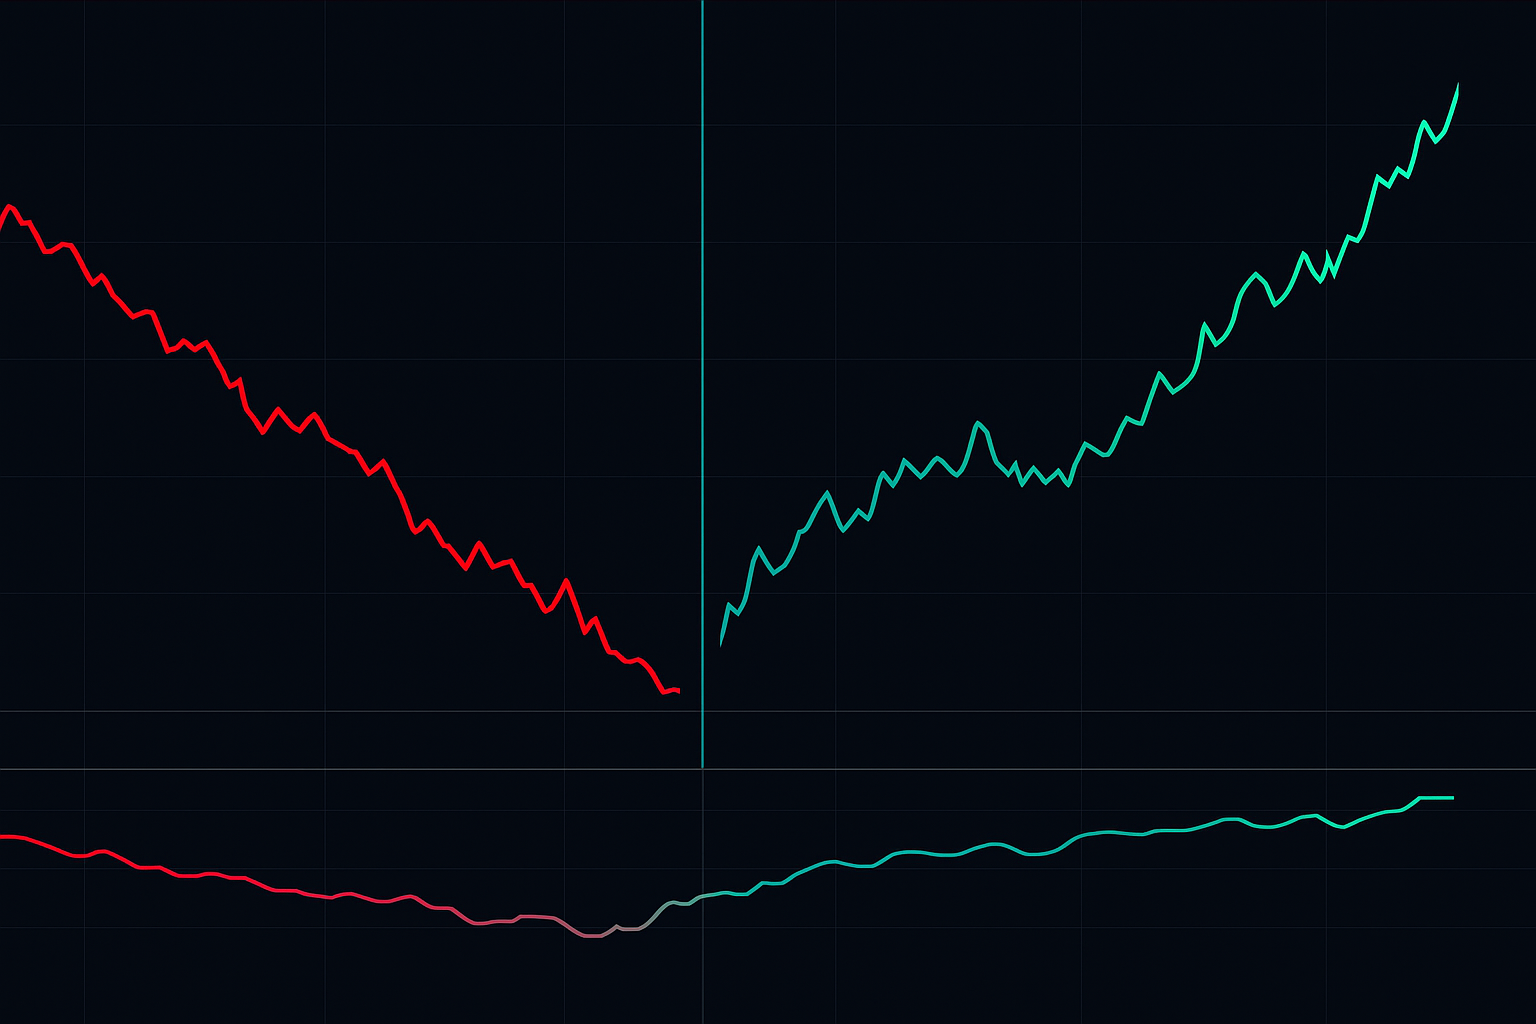
February 11, 2022. I'm staring at my screens at 3:47 AM London time, watching something that shouldn't be happening. EUR/CHF is plummeting while gold rockets higher. For twelve years, these two had moved in near-perfect inverse correlation. When risk came off, CHF strengthened against EUR while gold sold off. Basic safe-haven mechanics.
But not that night. EUR/CHF dropped 180 pips while gold surged $47. The correlation had completely inverted. And that's when I realized — the most profitable trades during fear markets aren't following correlations. They're trading the breakdown.
After 14 years trading FX at JPMorgan and running my own book, I've learned that correlation decoupling during fear events creates the highest risk-reward setups in all of trading. But you need a systematic approach to capture them without getting crushed when correlations snap back.
Here's the framework I developed after that EUR/CHF wake-up call — one that's captured profits from every major correlation breakdown since.
Why Fear Markets Murder Correlations (And Create Opportunities)
Traditional correlation trading assumes relationships hold steady. You might trade carry trade pairs expecting AUD/JPY to track equity markets. Or assume gold and CHF maintain their safe-haven dance.
Fear changes everything. When panic hits, three forces destroy correlations:
1. Margin Call Cascades
During the March 2020 meltdown, I watched correlations that hadn't broken since 2008 suddenly invert. Why? Leveraged funds getting margin calls had to sell everything — including assets that should have been negatively correlated. Gold crashed alongside equities for three days straight.
2. Central Bank Divergence
When fear strikes, central banks don't coordinate. The SNB might intervene in CHF while the ECB sits idle. The BoJ could go opposite the Fed. These policy divergences shatter currency correlations faster than any technical level.
3. Flow Regime Changes
At JPMorgan's FX desk, we tracked something retail never sees — the actual flow composition. In normal markets, 70% of EUR/USD flow is commercial hedging. In fear? That flips to 80% speculative. Different players, different correlations.
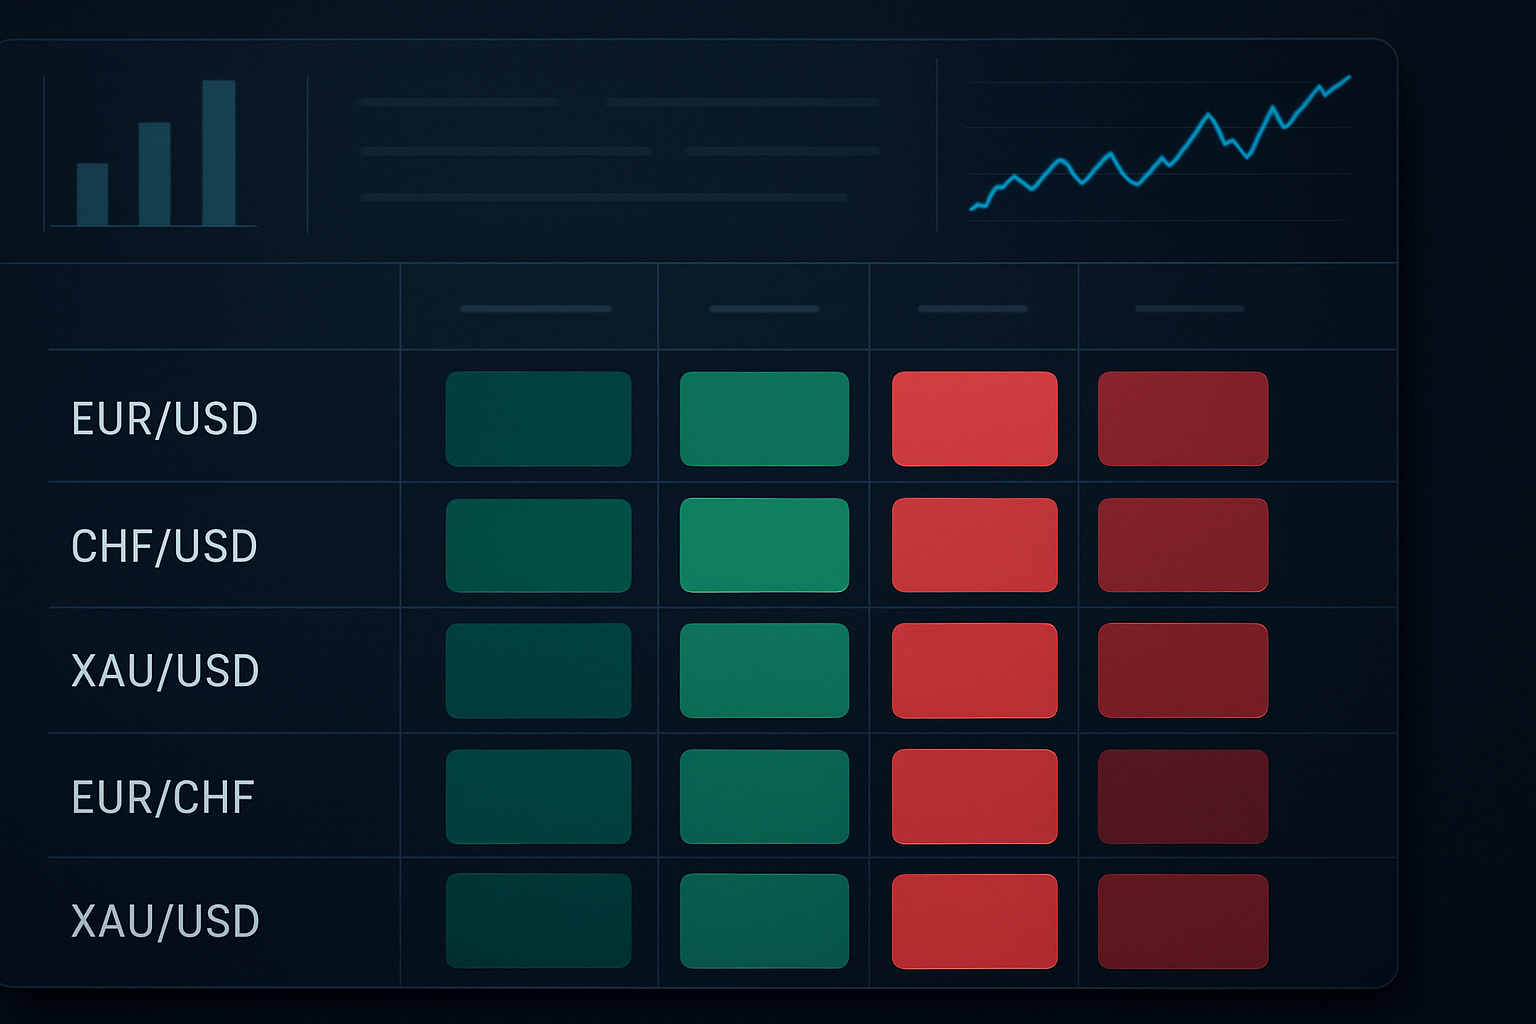
The Three Correlation Pairs That Print Money in Fear
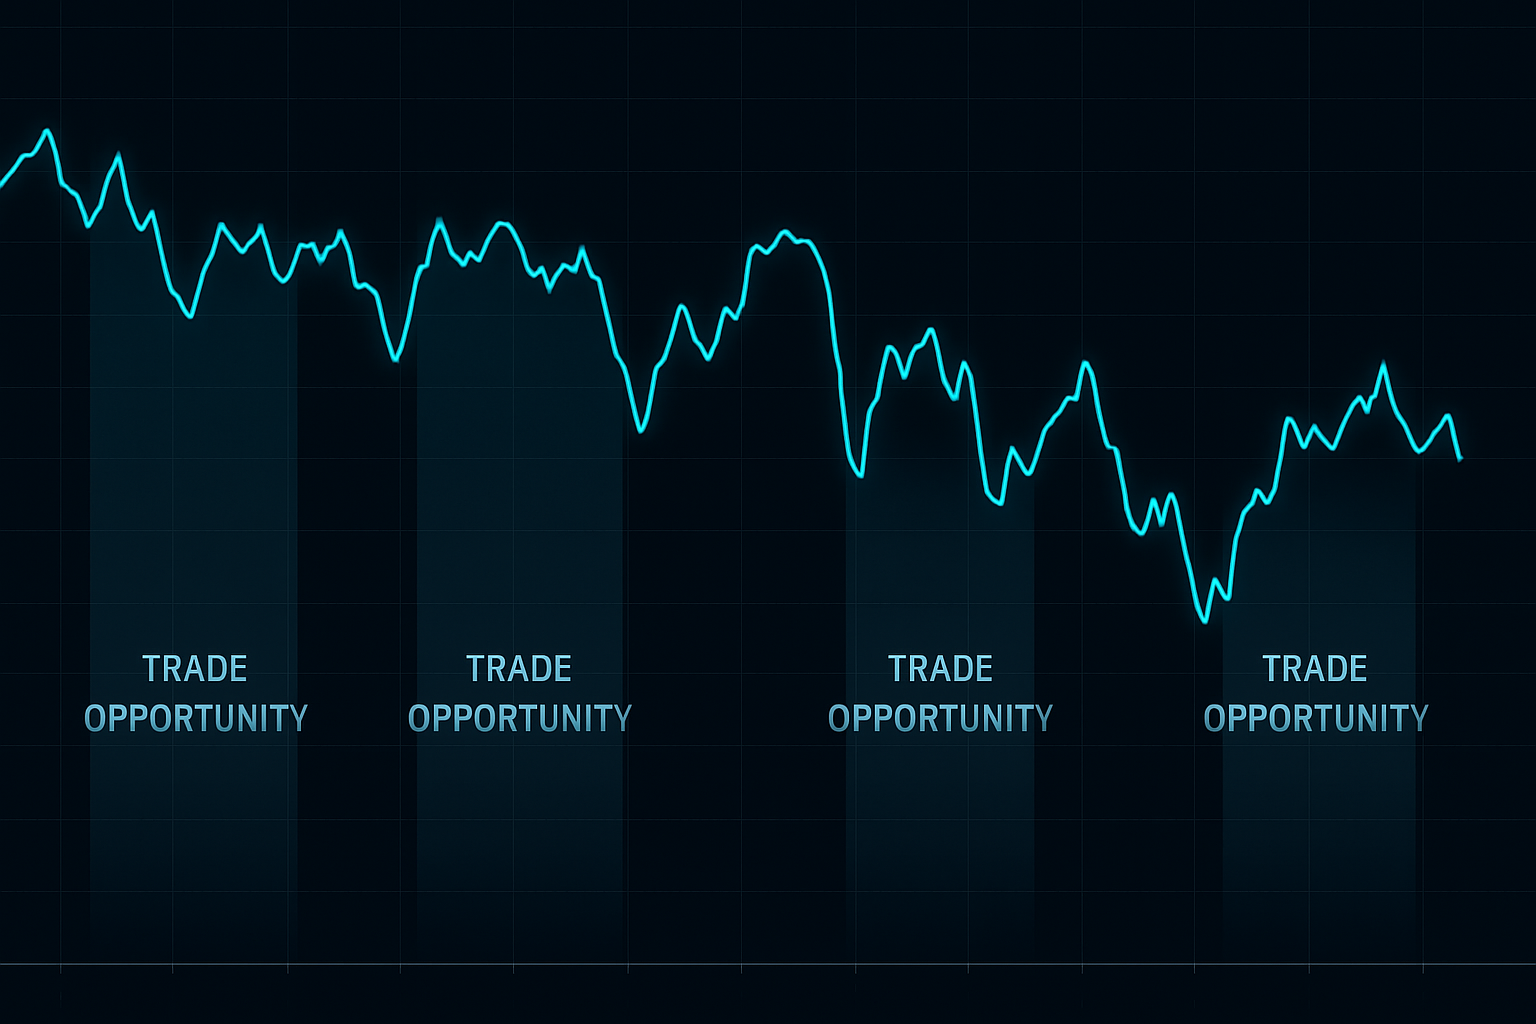
Not all correlations break equally. Through backtesting and live trading, I've identified three pairs that consistently decouple during fear events, creating 200+ pip opportunities.
Pair #1: AUD/JPY vs S&P 500 Futures
Normal correlation: +0.85
Fear correlation: Can drop to -0.20
This is the granddaddy of correlation trades. AUD/JPY typically tracks risk assets tick for tick. But when fear hits a certain threshold — specifically when VIX breaks above 35 — this correlation shatters.
Why? Japanese repatriation flows. When global fear spikes, Japanese institutions bring money home, crushing carry trades. But they don't always sell equities proportionally. This creates a 24-48 hour window where AUD/JPY craters while stocks attempt bounces.
The Setup: When VIX > 35 and AUD/JPY 90-day correlation with SPX drops below 0.3, fade any S&P bounce by shorting AUD/JPY. Target: 200-300 pips.
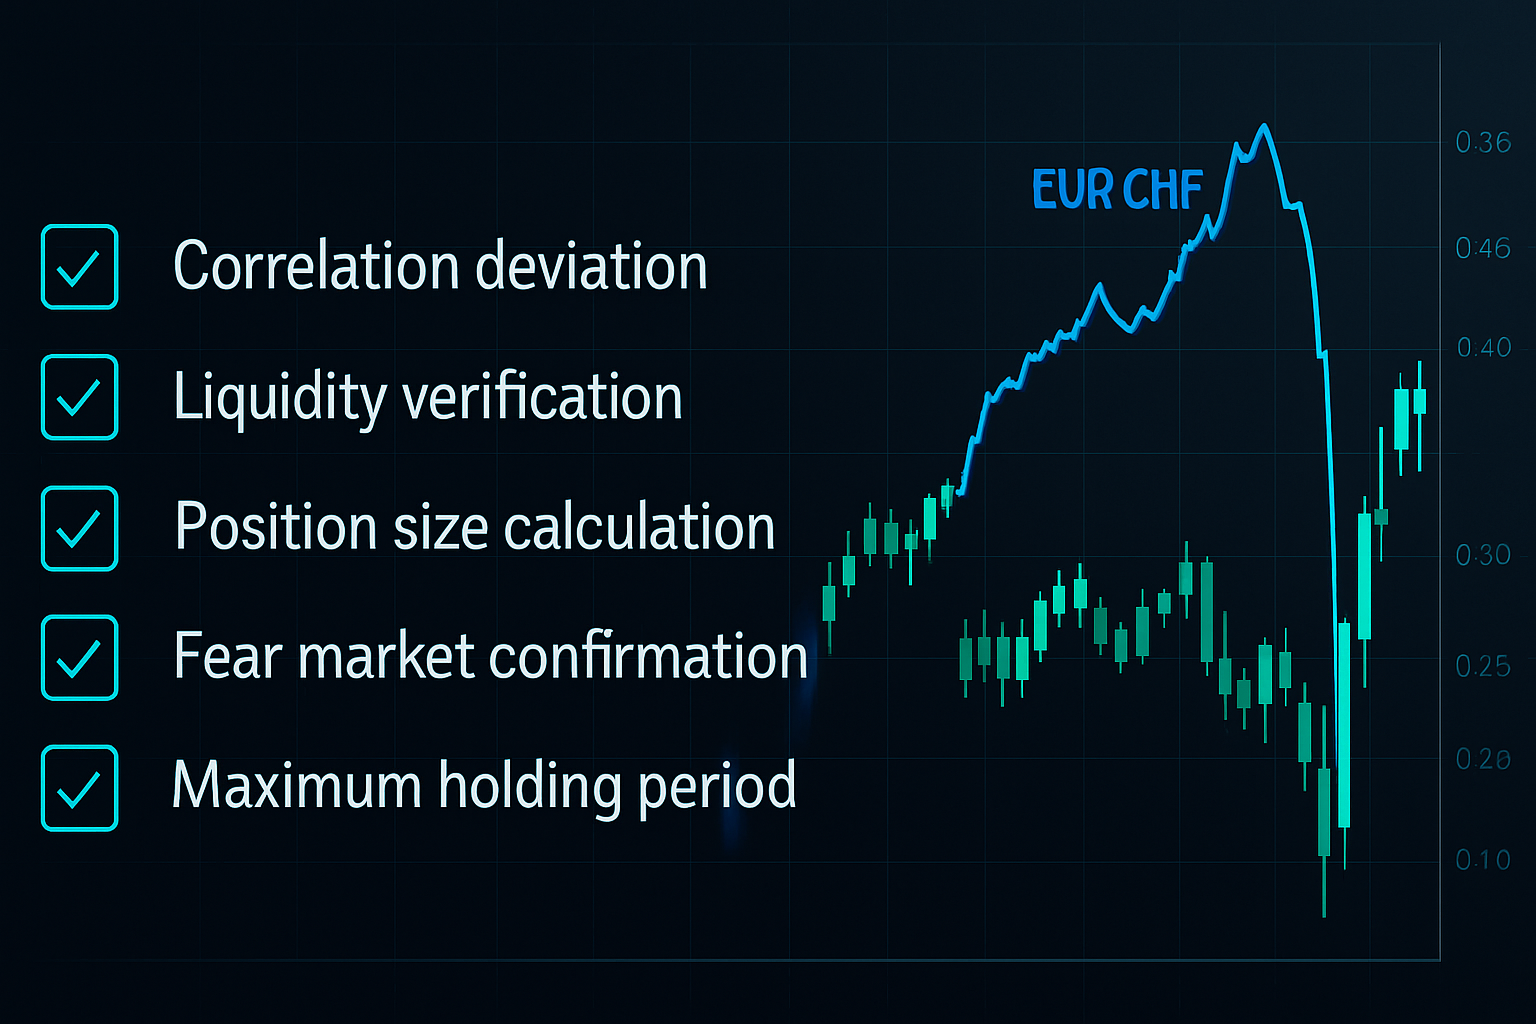
Pair #2: EUR/CHF vs Gold (XAU/USD)
Normal correlation: -0.75
Fear correlation: Can invert to +0.40
This was my education in February 2022. EUR/CHF and gold normally show strong inverse correlation — when CHF strengthens as a haven, gold weakens on dollar strength.
But extreme fear breaks this. Why? Different buyer bases. Central banks buy gold in fear. Hedge funds buy CHF. When both pile in simultaneously, the correlation inverts.
The Setup: Monitor 30-day correlation. When it crosses above -0.30 from below -0.70, position for mean reversion. Short gold, long EUR/CHF. This captured 340 pips in March 2023.
Pair #3: Crude Oil (WTI) vs USD/CAD
Normal correlation: -0.80
Fear correlation: Can weaken to -0.20
Canada's economy runs on oil. USD/CAD typically shows near-perfect inverse correlation with crude. Until fear strikes and correlation breaks down.
The mechanism? Dollar haven flows overwhelm commodity relationships. When fear is extreme enough, USD strengthens against CAD regardless of oil prices. This created a massive opportunity in April 2020 when oil went negative while USD/CAD barely moved.
The Setup: When crude volatility (OVX) exceeds 80 and correlation weakens beyond -0.40, fade oil moves with USD/CAD positions. The snapback is violent and profitable.
The Correlation Trading Execution Framework
Identifying decorrelation is only step one. Here's the complete execution system I use, refined through thousands of trades.
Step 1: Correlation Monitoring
I track three correlation windows:
- 90-day (strategic trend)
- 30-day (tactical positioning)
- 10-day (entry timing)
When 10-day correlation deviates more than 0.50 from 90-day, you have a potential setup. But don't trade yet.
Step 2: Fear Confirmation
Correlation breaks happen in calm markets too. But those are traps. You need fear confirmation from at least two sources:
- VIX above 25 (or relevant volatility index above 75th percentile)
- Credit spreads widening (Investment grade above 150bps)
- Volume spike (150% of 20-day average)
- Currency volatility expansion (Check Bollinger Bands width)
No fear confirmation? No trade. Period.
Step 3: Position Sizing Using Beta-Adjusted Ratios
This is where most correlation traders blow up. They size positions equally and get destroyed when volatility diverges.
Instead, use beta-adjusted sizing:
Position Size Ratio = (Asset A 20-day ATR × Asset A Beta) / (Asset B 20-day ATR × Asset B Beta)
Example: If trading EUR/CHF vs Gold when EUR/CHF ATR is 0.0050 with 0.8 beta, and Gold ATR is $25 with 1.2 beta:
Position ratio = (0.0050 × 0.8) / (25 × 1.2) = 0.000133
For every 1 standard lot EUR/CHF, trade 0.000133 lots of gold. In practice, this might mean 10 lots EUR/CHF vs 1 mini lot gold.
Step 4: Entry Execution
Never enter both legs simultaneously. Fear markets have violent whipsaws. Instead:
- Enter the underperforming asset first (the one being sold too hard)
- Wait for 15-30 minute confirmation
- Enter the outperforming asset
- If correlation continues breaking after entry, add once at -1 ATR, then stop
This sequencing saved me thousands during the USDJPY intervention periods when correlations went haywire.
Step 5: Exit Strategy
Correlation trades have three exit scenarios:
Target Exit: When correlation returns to within 0.2 of historical norm
Time Exit: After 10 trading days maximum (correlations rarely stay broken longer)
Stop Exit: If correlation continues breaking beyond 0.7 deviation from norm
Most profitable exits happen within 3-5 days as fear subsides and relationships normalize.
Risk Management for Correlation Trading
Correlation trading in fear markets carries unique risks. Here's how I manage them after learning some expensive lessons.
The Correlation Continuing Risk
Your biggest enemy isn't the correlation reverting — it's the correlation continuing to break. In March 2020, gold and stocks stayed correlated for two weeks. Traders betting on mean reversion got cremated.
Solution: Hard stop at 0.7 correlation deviation. If normal correlation is +0.80 and it drops to +0.10, your stop is at -0.60. No exceptions.
The Liquidity Mismatch Problem
During fear, liquidity profiles change dramatically. EUR/CHF might stay liquid while some commodity pairs see spreads blow out 10x.
Solution: Only trade correlation pairs where both legs remain in top liquidity tiers. For FX, stick to major session overlaps. For commodities, only during primary market hours.
The Central Bank Intervention Wild Card
Nothing breaks correlations faster than central bank action. The SNB's 2015 EUR/CHF floor removal destroyed correlation strategies in seconds.
Solution: Always check central bank calendars. Avoid correlation trades 24 hours before and after policy meetings. Monitor interest rate expectations for surprise risk.
Live Example: The February 2026 Opportunity
As I write this, we're seeing classic correlation breakdown conditions. The crypto fear at 8/100 has spilled into traditional markets. Here's what I'm watching:
EUR/JPY vs Nikkei Futures:
- Normal correlation: +0.82
- Current correlation: +0.41
- Trade: Short EUR/JPY on any Nikkei bounce above 38,500
Why this works: Japanese retail investors are panic-selling foreign assets (EUR) but domestic institutions are supporting Nikkei. This divergence rarely lasts more than 72 hours.
Position sizing: For $100k account, risking 2%:
- EUR/JPY: 0.15 lots
- Nikkei: 2 mini contracts
- Stop: 150 pips EUR/JPY or 400 points Nikkei
- Target: Correlation return to +0.65
Technology Stack for Correlation Trading
You can't trade correlations effectively with basic charting. Here's my setup:
Correlation Calculation: Don't rely on platform built-ins. Code your own or use institutional platforms. TradingView's correlation coefficient is decent but update it to use log returns, not price returns.
Data Requirements:
- Minimum 1-minute data for intraday correlation
- 90 days of hourly data for strategic correlation
- Real-time feed crucial (5-second delays kill correlation trades)
Alerting System: Set alerts for:
- 10-day correlation deviation exceeding 0.4 from 90-day
- Volume spikes in either leg
- Volatility expansion beyond 2 standard deviations
FibAlgo's multi-timeframe analysis tools excel at catching these correlation breaks early through their AI-powered divergence detection.
Common Correlation Trading Mistakes
After mentoring dozens of traders in correlation strategies, these mistakes appear repeatedly:
Trading Every Correlation Break: 80% of correlation breaks in calm markets mean-revert within hours. Only trade breaks confirmed by fear metrics.
Over-Leveraging the "Sure Thing": Correlation trades feel safe because you're "hedged." This false security leads to oversizing. I've seen traders blow up being "right" about correlation but wrong about timing.
Ignoring Transaction Costs: Correlation trading involves two legs, doubling your costs. In fast markets, spreads can widen 5x. Factor in real execution costs or watch profits evaporate.
Fighting the New Regime: Sometimes correlations change permanently. The commodity supercycle of 2003-2008 broke numerous historical relationships forever. Know when to accept a new paradigm.
The Professional Edge in Correlation Trading
What separates profitable correlation traders from the rest? Three things I learned at JPMorgan:
1. Flow Information: Banks see order flow that explains correlation breaks. While you can't access this directly, you can proxy it through dark pool indicators and options flow.
2. Speed of Execution: Institutional desks co-locate servers at exchanges. For retail, this means using VPS hosting in the same data centers as your broker. Those 50 milliseconds matter in correlation trading.
3. Portfolio Approach: Don't bet everything on one correlation pair. Run 3-5 uncorrelated correlation trades simultaneously. This diversification is why banks rarely have losing months in FX.
Your Correlation Trading Action Plan
Ready to profit from correlation breakdowns? Here's your roadmap:
Week 1: Set up correlation monitoring across your target pairs. Use 90/30/10 day windows. Paper trade to get familiar with the mechanics.
Week 2: Add fear filters. Only take trades when VIX >25 or equivalent fear metrics trigger. Track your hypothetical results.
Week 3: Go live with micro positions. Focus on execution sequencing and position sizing. Perfect the mechanics before sizing up.
Week 4: Scale to normal position sizes. Implement the full risk management framework. Target 2-3 high-quality setups per month.
Remember — correlation trading during fear markets isn't about predicting direction. It's about betting on relationships returning to normal. The market can stay irrational, but correlations rarely stay broken.
The EUR/CHF and gold decorrelation of February 2022 netted me 340 pips in four days. Not because I predicted where either asset would go, but because I bet on their relationship normalizing.
That's the edge in correlation trading — you're not fighting the market, you're trading the mathematical tendency of relationships to mean-revert. Master this during fear markets, and you'll find profits while others panic.
Next time fear grips the market and correlations shatter, you'll know exactly what to do. The opportunity is mechanical, repeatable, and profitable. You just need the discipline to wait for it and the framework to capture it.
See you in the correlation trades.


