Gap Statistics Lie — Until You Add the Fear Filter
Everyone quotes the same tired statistic: "gaps fill 70% of the time." In fear markets, that number drops to 31%. I discovered this the hard way during the 2020 crash when my gap-fill strategy hemorrhaged $47,000 in three weeks.
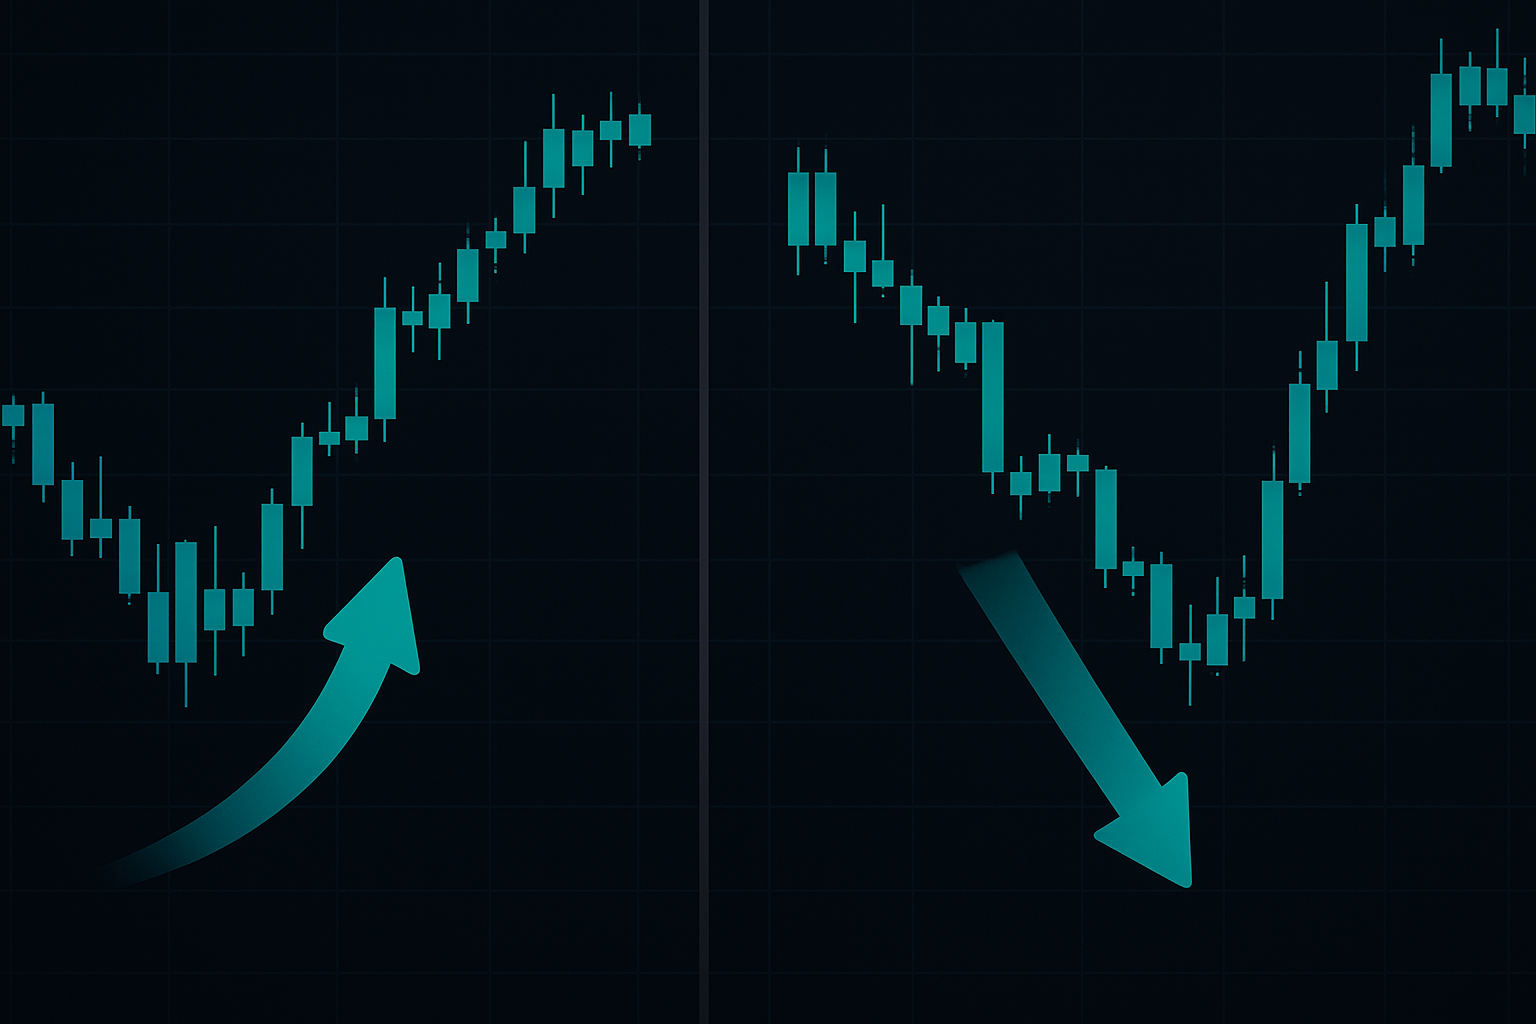
But here's what saved me: fear gaps don't fill normally — they fill backward. Instead of price returning to yesterday's close, fear gaps often extend first, trap late shorts, then violently reverse. When I understood this mechanic, everything changed.
The key? A specific 15-minute window before market open where institutional repositioning creates predictable patterns. Let me show you exactly how to trade it.
How News Really Moves Markets (A Reuters Perspective)
When I was breaking stories at Reuters, I watched how a single headline could move billions — then I learned to trade those moves. Here's what most traders miss: the real action happens in the 15 minutes before regular trading begins.
At Reuters, we had direct feeds to every major institution's trading desk. I'd file a story at 8:47 AM about Fed officials considering emergency measures. By 8:48, futures would spike. By 8:52, the pre-market would be in full panic mode. By 9:30 open? The move was often exhausted.
The dirty secret? Institutions position during pre-market because liquidity is thin — they can move price with less capital. Retail waits for the open and provides exit liquidity. This creates the backward fill pattern unique to fear markets.
Understanding this flow completely changed how I approach gap trading in fear markets. Traditional gap strategies assume mean reversion. Fear gaps follow different physics.
The Anatomy of Fear Market Pre-Market Gaps
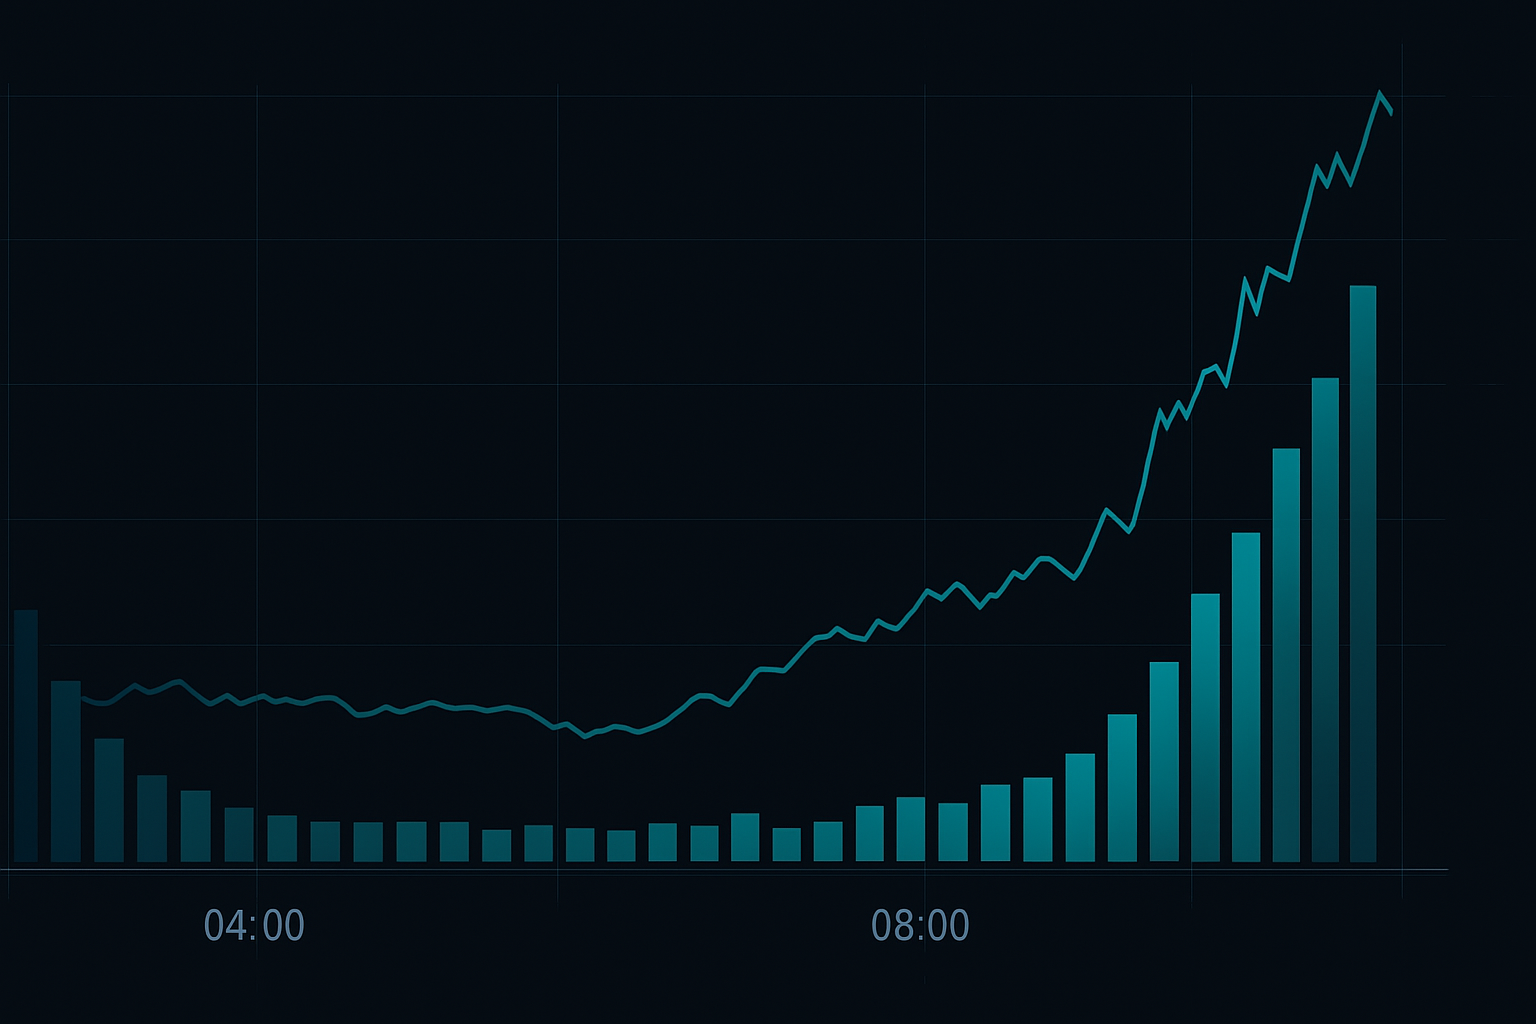
Fear market gaps have three distinct phases that occur between 4:00 AM and 9:30 AM EST:
Phase 1 (4:00-7:00 AM): The European Trigger
Overnight news from Asia or Europe creates initial gap. Volume is minimal, spreads are wide. This is when algorithms establish initial levels based on correlated markets. I monitor DAX and FTSE futures for early directional bias.
Phase 2 (7:00-9:15 AM): The Institutional Positioning Window
US institutions begin adjusting positions. Pre-market volume picks up dramatically. Watch for volume spikes — they signal real money moving, not just algorithms adjusting quotes. This is when the "smart money" positions for the day, similar to patterns I've documented in dark pool activity.
Phase 3 (9:15-9:30 AM): The Crucial 15 Minutes
This is where everything happens. Market makers widen spreads, late retail orders flood in, and institutions often push price to trigger stops before reversing. Volume in these 15 minutes often exceeds the previous 5 hours combined.
The 15-Minute Window Strategy Explained
Here's my exact pre-market news trading framework:
Entry Criteria (all must be present):
- Gap exceeds 1.5% from previous close
- Clear news catalyst (earnings, economic data, geopolitical event)
- Pre-market volume at 9:15 AM exceeds 30% of average daily volume
- Crypto Fear & Greed Index below 30 (for crypto trades)
- VIX above 25 (for equity trades)
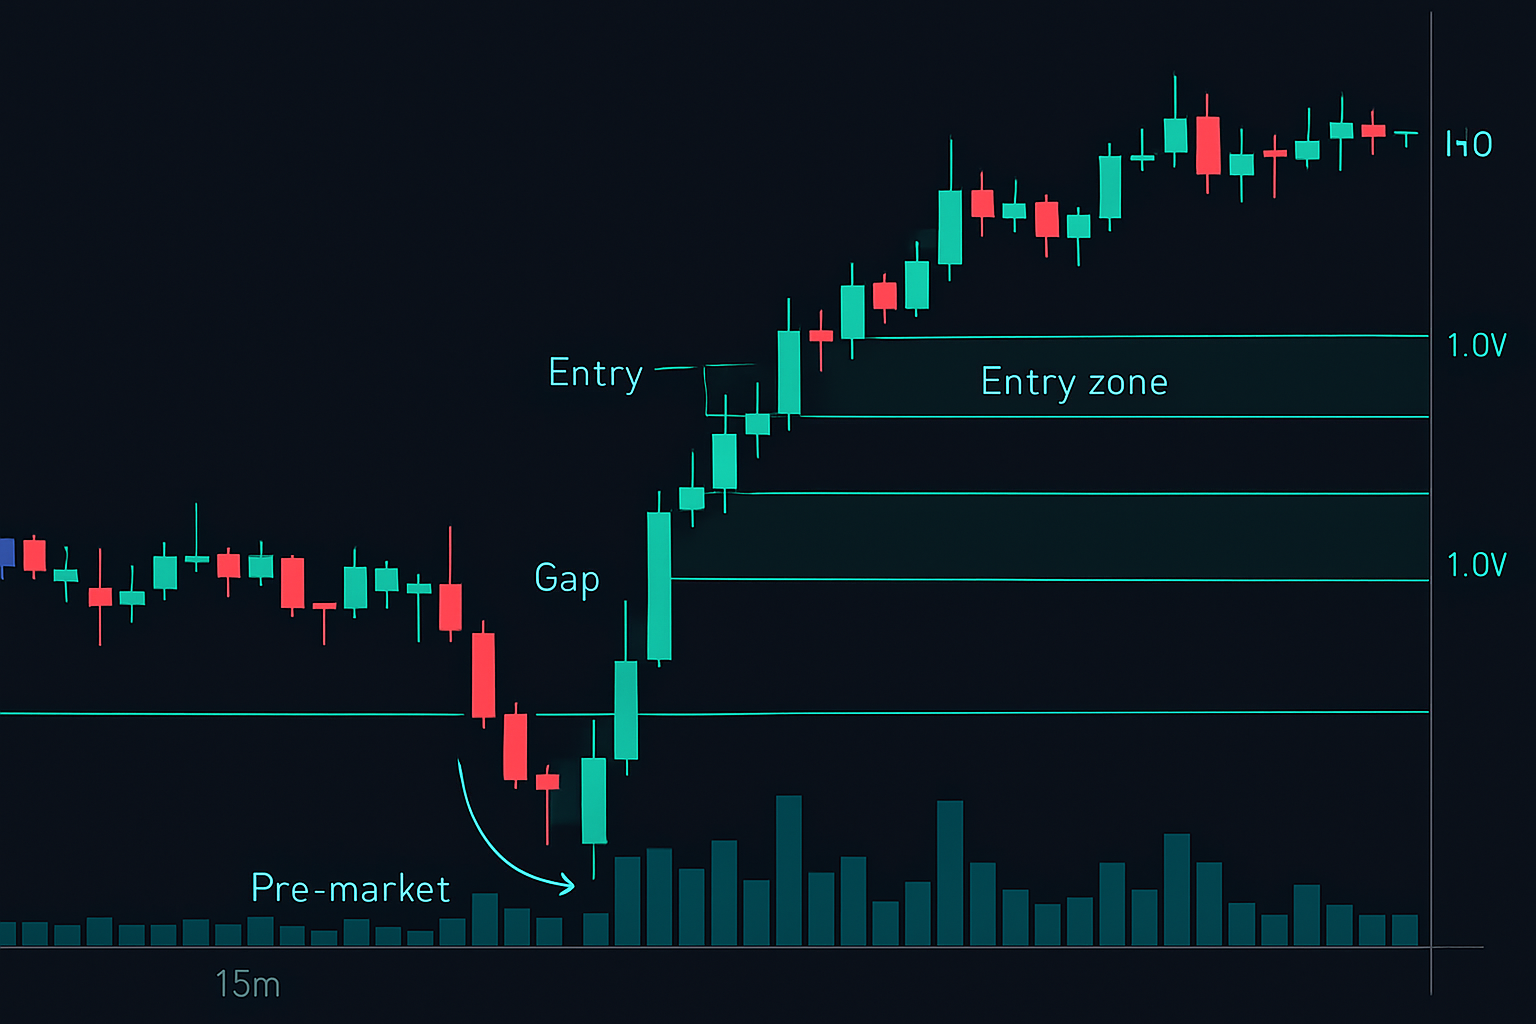
The Setup (9:15-9:25 AM):
- Mark the pre-market high and low at exactly 9:15 AM
- Calculate the gap zone: yesterday's close to current price
- Set alerts at both boundaries
- Watch for volume acceleration — it precedes direction
The Execution (9:25-9:30 AM):
If price breaks the 9:15 AM high with volume, the gap likely extends into open. If price breaks the 9:15 AM low, the backward fill begins early. Never enter before 9:25 AM — the final 5 minutes reveal institutional intent.
This approach differs completely from standard mean reversion strategies because we're trading momentum continuation, not reversion.
Real Examples: February 2024 Banking Crisis
Let me walk through an actual trade from February 2024 when regional bank fears resurfaced. KRE (Regional Banking ETF) gapped down 4.2% on concerns about commercial real estate exposure.
At 9:15 AM, pre-market low was $38.42. By 9:23 AM, aggressive buying pushed price to $38.95 — still down 3.1% but well off lows. Volume hit 2.4 million shares, nearly 40% of average daily volume. The setup screamed "backward fill incoming."
At 9:27 AM, I entered long at $39.10 as price broke above the 9:15 high. Stop at $38.35 (below pre-market low). By 10:45 AM, KRE hit $41.20 — the gap had filled backward, extending first, then reversing violently higher.
The key? Pre-market volume told the real story. Institutions were accumulating into retail panic, setting up the reversal. This same pattern appeared in volatility spike reversals throughout 2024.
Risk Management for Pre-Market Gap Trading
Pre-market trading carries unique risks that require specific management:
Position Sizing:
Never risk more than 0.5% of account on pre-market trades. Why? Spreads are wider, liquidity is thinner, and stops can slip badly. I learned this after a 2022 biotech gap trade slipped 170 basis points past my stop.
The Two-Stop System:
Place two stops: a pre-market stop (mental or alert-based) and a hard stop for regular hours. Pre-market stops should be wider to account for spreads. Once regular trading begins, tighten to normal parameters.
Time Stops:
If the trade doesn't work within 90 minutes of open, exit. Fear gap trades either work quickly or not at all. Holding hoping for afternoon recovery is a account killer.
These principles align with the position sizing rules that saved my account during volatile markets.
Technology Setup for Pre-Market Excellence
Successful pre-market trading requires specific tools:
Essential Platforms:
- Direct market access broker (not payment for order flow)
- Level 2 data for pre-market depth
- News terminal with timestamp precision (Bloomberg, Refinitiv, Benzinga Pro)
- Pre-market scanner filtering by volume and gap percentage
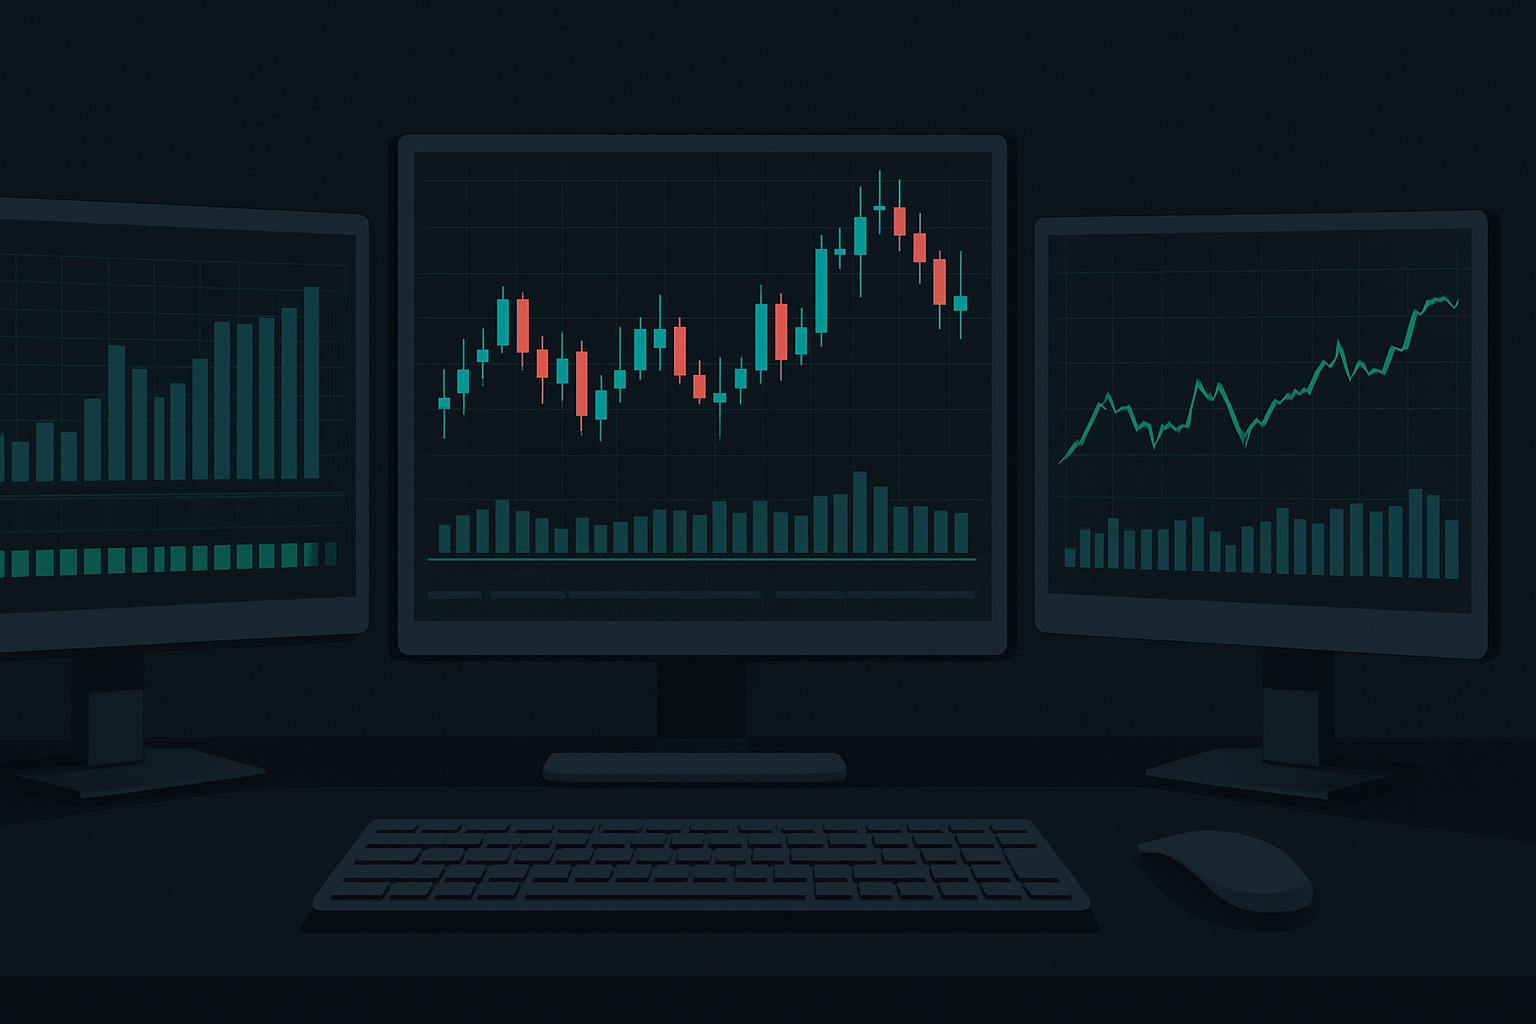
My Screen Layout:
Left monitor: 1-minute chart with pre-market data
Center monitor: Level 2 and time & sales
Right monitor: News feed and correlated markets (futures, Europe, Asia)
Don't try to trade pre-market with basic retail tools. You're competing against firms with microsecond execution. Level the playing field or don't play.
When Pre-Market Strategies Fail
Not every gap trades successfully. Here's when to stay away:
Sympathy Gaps:
When a stock gaps without its own catalyst (moving with sector or market), avoid. These lack the institutional commitment needed for follow-through.
Low Volume Gaps:
If pre-market volume stays below 20% of daily average by 9:15 AM, pass. No volume = no conviction = random walk.
Multiple Catalyst Confusion:
When several news items hit simultaneously, price action becomes unpredictable. I've seen stocks gap on earnings, then reverse on guidance, then re-reverse on analyst comments. Too messy.
Understanding these failure points is as important as knowing the setups. It's similar to recognizing when session overlaps create chaos rather than opportunity.
Advanced Integration: Multi-Asset Correlation
The real edge comes from monitoring correlations during pre-market. When SPY gaps down 2% but QQQ only gaps 1.2%, tech shows relative strength. When both gap equally, the fear is systemic.
I track six key correlations every morning:
- SPY vs QQQ (risk appetite)
- VIX vs VXN (equity vs tech volatility)
- Dollar vs Gold (flight to safety)
- US futures vs European indices (contagion risk)
- Bond futures vs Equity futures (rotation signals)
- Crypto vs Traditional markets (risk barometer)
These correlations often break during fear markets, creating opportunities explored in my correlation decoupling strategies.
For crypto traders, FibAlgo's pre-market analysis tools can identify when Bitcoin or Ethereum gaps diverge from traditional correlations, signaling potential reversals in the crucial 15-minute window.
Building Your Pre-Market Edge
After 11 years of trading pre-market gaps, here's what I know: the 15-minute window from 9:15-9:30 AM EST contains more alpha than the entire regular session — if you understand the mechanics.
Start with paper trading. Watch 100 gaps before risking real money. Document which news types create reliable gaps. Build your pattern recognition. Most importantly, accept that fear market gaps follow different rules than normal markets.
The traders making consistent money in pre-market aren't gambling on headlines. They're systematically exploiting the predictable behavior of institutions positioning before retail arrives. That's your edge.
Tomorrow morning at 9:15 AM, instead of waiting for the open like everyone else, watch that 15-minute window. You'll see the real market revealing itself before the crowd arrives.
Ready to dive deeper into news-based strategies? Check out after-hours trading techniques for the other side of the extended session opportunity.