The Friday Morning That Changed How I Read Pre-News Markets
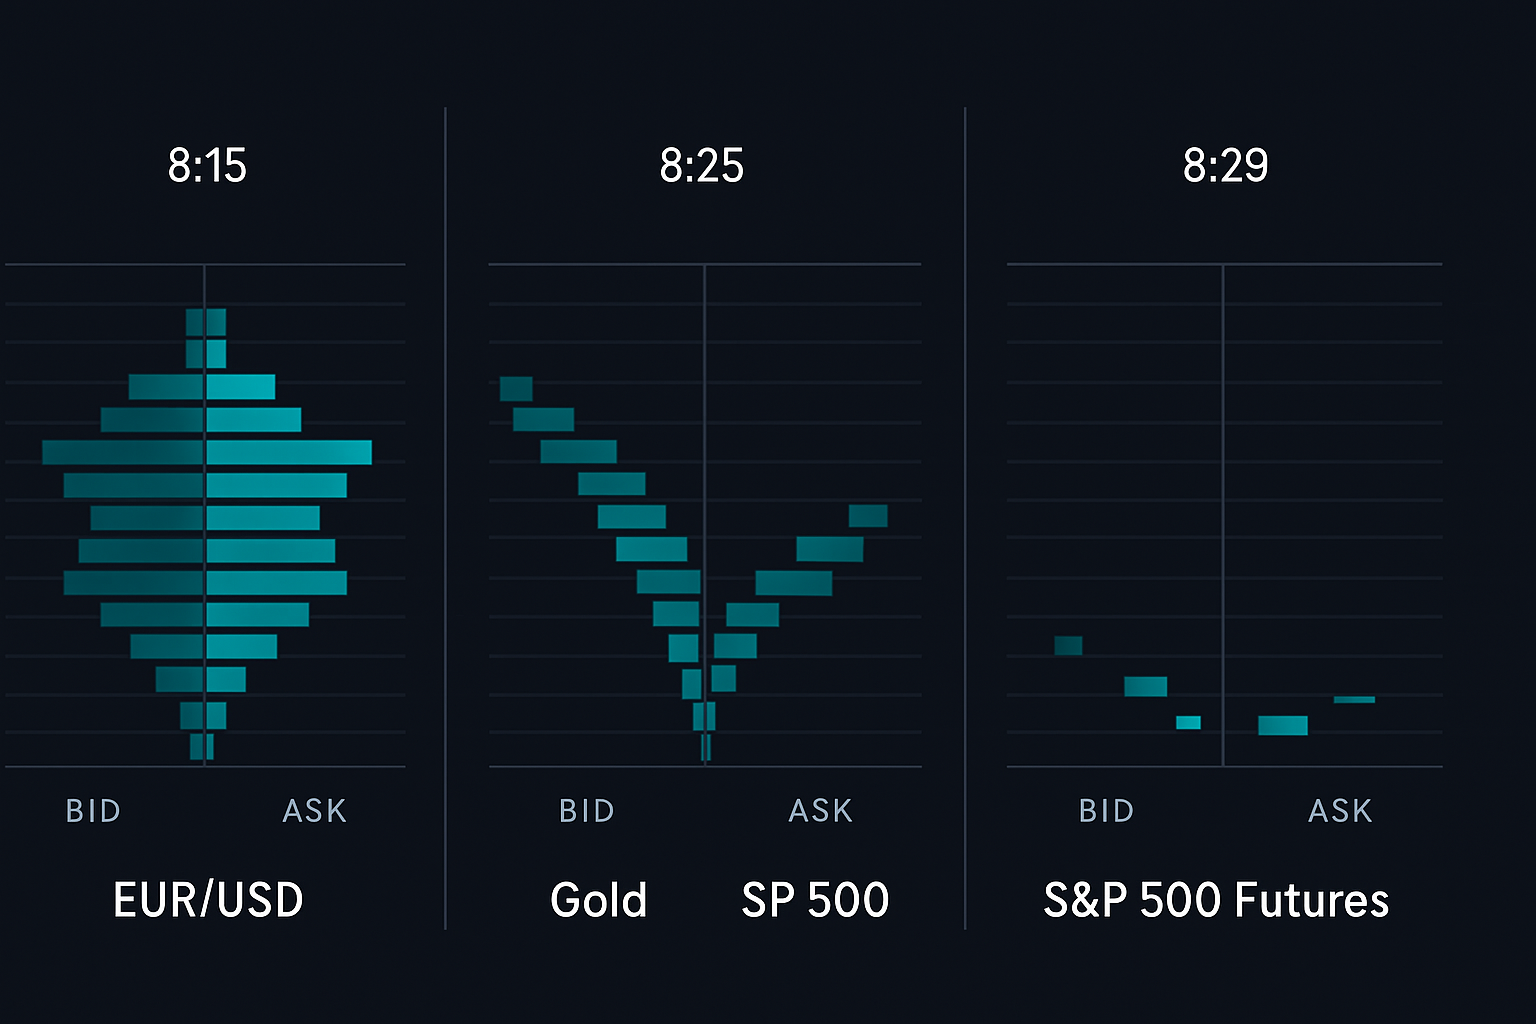
8:14 AM EST, December 2, 2022. I'm watching EUR/USD, Gold, and S&P futures simultaneously on my three-monitor setup — a habit from my software engineering days when tracking multiple system logs. NFP releases in 16 minutes.
Then I see it. All three markets start thinning out. Simultaneously.
Not just reduced volume — I'm talking about actual bid/ask spreads widening, order book depth evaporating, liquidity literally being pulled from multiple assets at once. Like someone opened a drain at the bottom of the liquidity pool.
EUR/USD: Spread jumps from 0.2 to 0.8 pips. Gold: Bid/ask widens by $0.40. S&P futures: 200 contracts disappear from each price level.
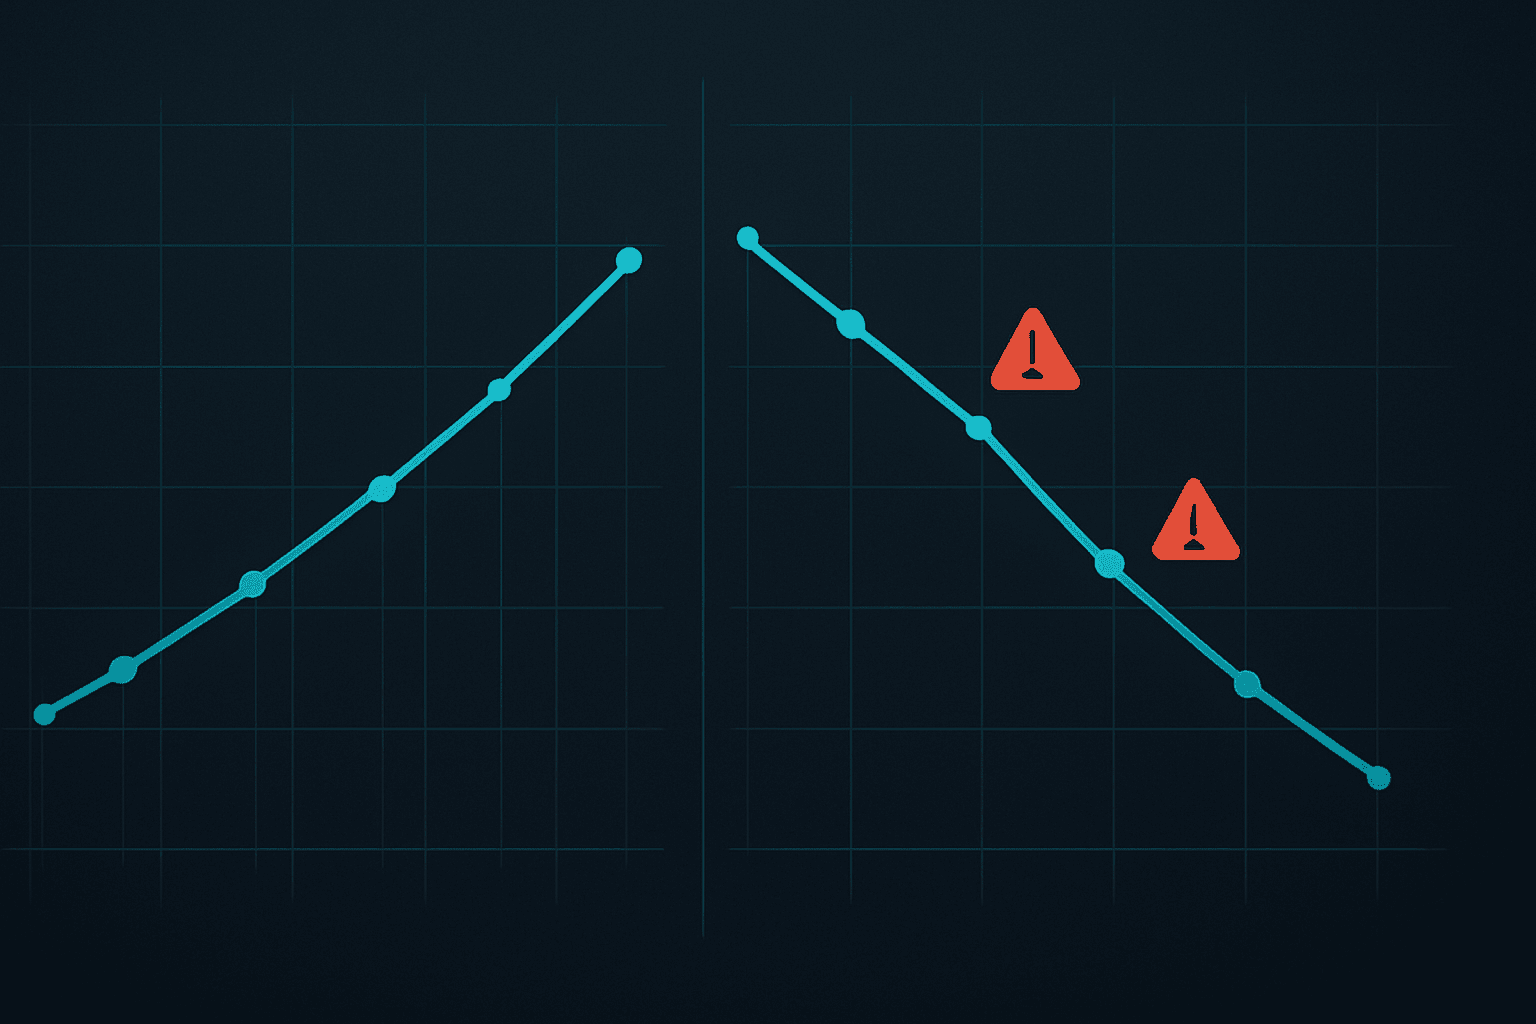
By 8:29 AM — one minute before NFP — the markets looked like a ghost town. Then the number hit, and absolute chaos. EUR/USD moved 87 pips in 3 minutes. Gold swung $24. The S&P ripped 45 handles.
But here's what clicked: The direction was already telegraphed by which side drained faster.
That morning, the bid side on EUR/USD drained 73% while the ask side only dropped 41%. Institutions were pulling their buy orders more aggressively. The market was telling me it wanted to go down before the news even hit.
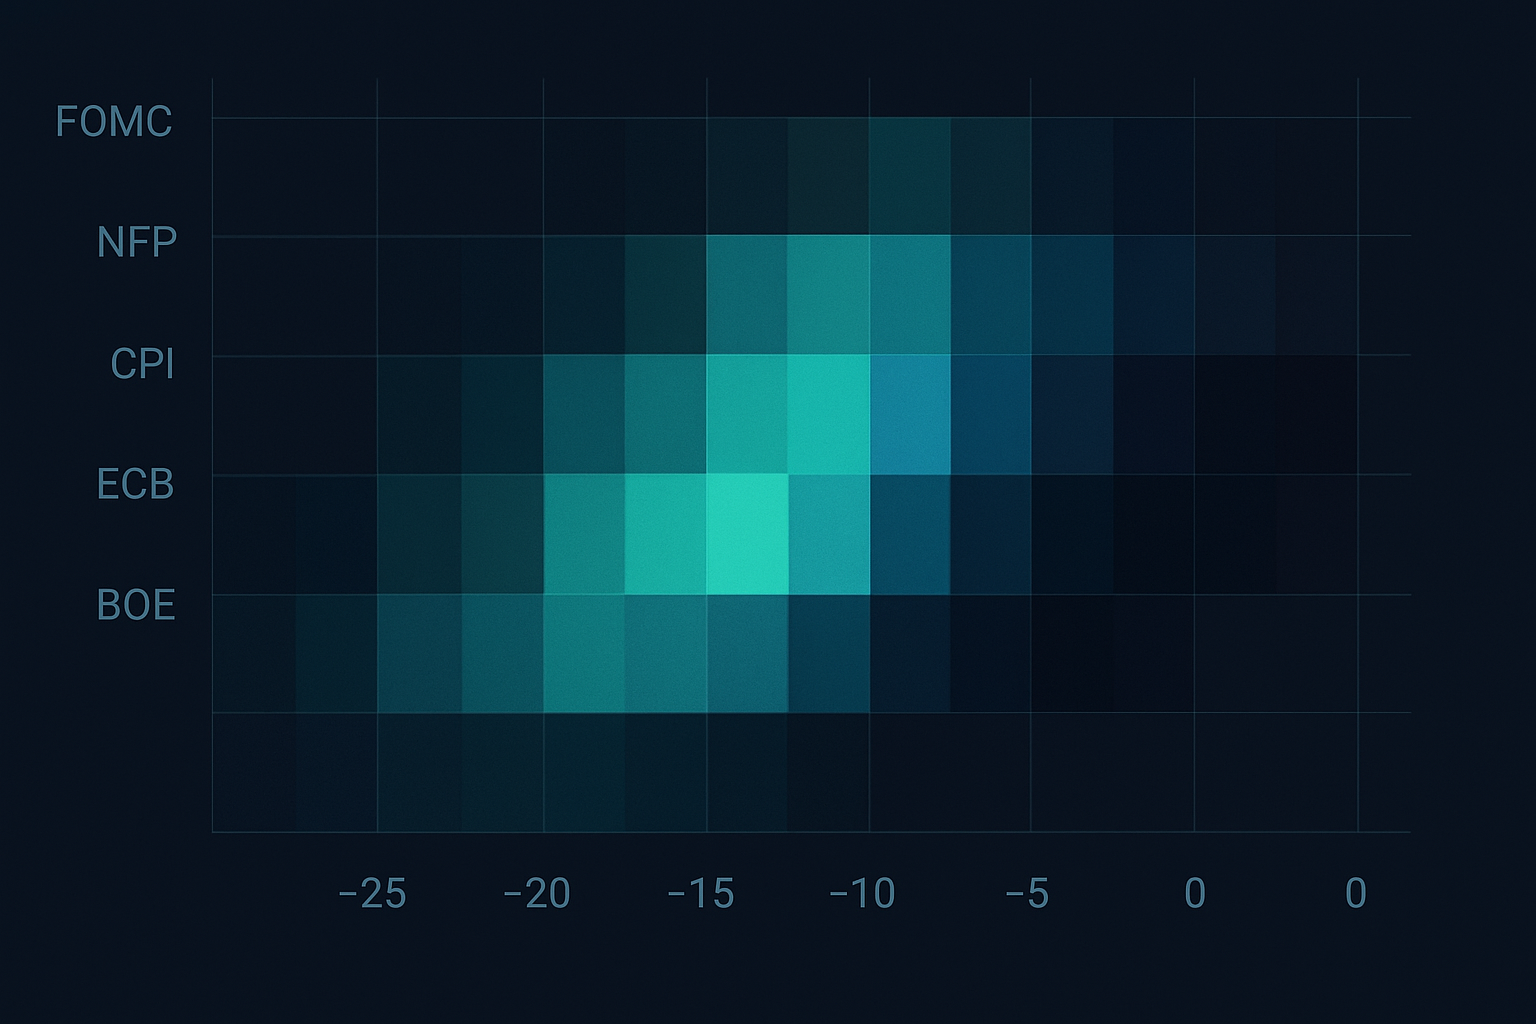
I spent the next 18 months documenting every major announcement. FOMC, ECB, BOE, CPI, NFP — mapping the drainage patterns. What I found revolutionized how I trade news events.
The Mechanics: Why Institutions Drain Liquidity Before Announcements
After 10,000+ hours studying smart money concepts, I realized pre-announcement drainage isn't random — it's systematic risk management by institutions who can't afford to be wrong.
Think about it from a market maker's perspective (I learned this from a former colleague at a prop shop):
You're quoting EUR/USD with €50 million on each side. NFP is about to drop. Your risk models are screaming. What do you do? You can't just cancel all orders — that would signal panic. Instead, you systematically thin out your quotes:
- Reduce order sizes from €5M to €1M per level - Widen spreads to discourage aggressive taking - Pull quotes from outer price levels entirely - Maintain presence but minimize exposure
Now multiply this across every major institution. When JPMorgan, Citi, Deutsche, and Barclays all drain simultaneously, you get the pattern I discovered.
But here's the kicker — they don't drain equally on both sides. The side they drain more aggressively hints at their directional bias. This asymmetric drainage creates the 15-minute trading window.
The drainage typically starts 15-20 minutes before major announcements:
T-20 to T-15: Initial thinning begins T-15 to T-10: Acceleration phase — this is your signal T-10 to T-5: Maximum drainage — positioning window T-5 to T-0: Ghost town — too late to enter T-0: News hits, chaos ensues
The beauty? This happens across all correlated assets simultaneously. When studying intermarket divergence patterns, I noticed drainage rarely happens in isolation. If EUR/USD is draining, check Gold, check DAX, check US futures. The correlation tells you everything.
Pattern Recognition: The Cross-Asset Drainage Signature
Not all drainage is created equal. Through thousands of observations, I've identified three distinct drainage signatures that actually matter:
Type 1: The Symmetric Fade Both bid and ask drain equally (within 10% of each other). This signals genuine uncertainty — institutions have no edge. Skip these trades. I learned this the hard way during the March 2023 FOMC when symmetric drainage led to a 40-pip whipsaw that stopped me out twice.
Type 2: The Directional Drain One side drains 30%+ more than the other. This is your money pattern. When I see ask-side drainage exceeding bid-side by this margin, institutions are pulling sell orders more aggressively — they expect prices to rise. The opposite for bid-side drainage.
Type 3: The Cascade Drain Drainage starts in one asset and cascades to others. I first noticed this during the SVB crisis. Dollar pairs drained first, then gold, then equities — in that exact sequence. The cascade order tells you capital flow direction.
Here's where it gets interesting. Drainage intensity varies by announcement type:
FOMC: Most aggressive drainage, starts T-20 minutes NFP: Moderate drainage, starts T-15 minutes CPI: Sharp drainage, starts T-12 minutes ECB: Gradual drainage, starts T-25 minutes BoE: Sporadic drainage, less reliable
But here's what nobody tells you — drainage patterns change based on market regime. During the extreme fear we're seeing now (Fear & Greed at 13), drainage happens faster and more aggressively. Back when I was analyzing fear spike reversals, I noticed drainage in fear markets starts earlier and cuts deeper.
The 15-Minute Window: Your Execution Framework
After eighteen months of refinement and hundreds of trades, here's the exact framework I use to trade pre-announcement drainage:
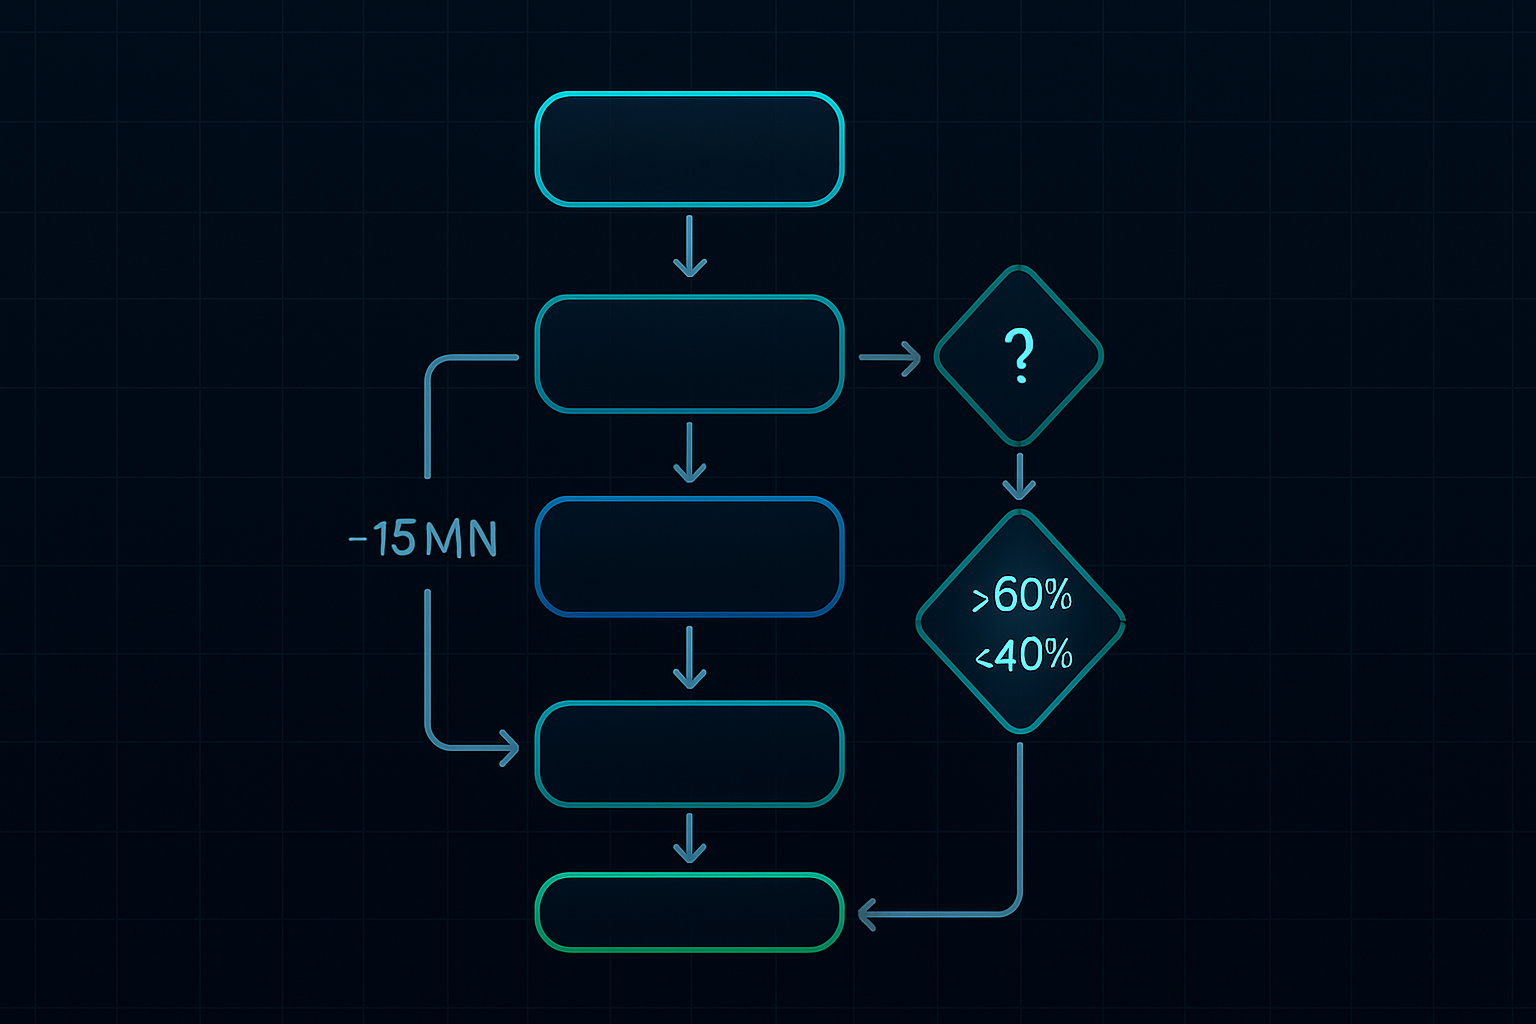
Step 1: The Multi-Asset Scanner (T-20 minutes)
I monitor six core pairs/instruments:
- EUR/USD (risk sentiment baseline) - GBP/USD (European flow confirmation) - Gold (safe haven flows) - S&P 500 futures (risk appetite) - US 10-year futures (bond market positioning) - Bitcoin (when trading crypto-sensitive announcements)
Why these? They represent different asset classes but share enough correlation during announcements to confirm drainage patterns. This aligns with cross-asset momentum principles I've studied extensively.
Step 2: Drainage Calculation (T-15 minutes)
I use a simple but effective formula:
Drainage Rate = (Depth_T-20 - Depth_Current) / Depth_T-20 × 100
Calculate this for both bid and ask sides separately. I track the top 5 price levels — deeper than that rarely matters for this strategy. When the ask-side drainage exceeds bid-side by 30%, that's my directional signal.
Step 3: Confirmation Phase (T-12 minutes)
This is where most traders mess up. They see drainage and jump in immediately. Don't. Wait for cross-asset confirmation:
- At least 3 of 6 monitored instruments must show similar drainage patterns - Drainage differential must maintain or accelerate (not reverse) - Volume must be declining, not spiking (spikes indicate early positioning)
Step 4: Entry Execution (T-10 to T-5 minutes)
I scale in with three entries:
Entry 1 (33%): When drainage differential hits 30% Entry 2 (33%): At T-7 minutes if pattern holds Entry 3 (34%): At T-5 minutes or max drainage point
Stop loss: Beyond the pre-drainage high/low. If EUR/USD was 1.0850 at T-20 and drained to 1.0840, stops go at 1.0852. Tight but outside the noise.
Real Trades From My Journal: The Good, Bad, and Ugly
Let me show you exactly how this plays out with three trades from my journal:
Trade #1: FOMC, January 31, 2024 — The Perfect Setup
1:42 PM EST: Noticed EUR/USD ask-side drainage accelerating. Spread widened from 0.2 to 0.6 pips. More importantly, the ask side lost 67% depth while bid side only dropped 31%. Clear bullish signal.
1:45 PM: Confirmation across assets. Gold showing similar pattern, Dollar Index futures thinning on the offer. Scaled in long EUR/USD: 1.0832, 1.0829, 1.0827.
2:00 PM: FOMC hits dovish. EUR/USD rockets to 1.0891. Exited full position at 1.0886. +57 pips in 15 minutes.
Trade #2: NFP, March 8, 2024 — The Whipsaw
8:15 AM: Drainage looked perfect. EUR/USD bid draining faster. Went short at 1.0921. But here's what I missed — Gold was showing the opposite pattern. Failed to check all correlations properly.
8:30 AM: NFP came in weak but dollar sold off anyway. Stopped out at 1.0943. -22 pips. Lesson: Never trade drainage without multi-asset confirmation.
Trade #3: ECB, April 11, 2024 — The Cascade Beauty
7:35 AM: Spotted cascade drainage starting in EUR crosses, flowing to European indices, then to Gold. Classic Type 3 pattern. The cascade suggested Euro weakness incoming.
7:40 AM: Shorted EUR/USD at 1.0856 and EUR/GBP at 0.8634 simultaneously. Double position, same theme.
8:45 AM: Lagarde hawkish but Euro had already priced it in during drainage. Both positions profitable. EUR/USD +31 pips, EUR/GBP +27 pips. Combined +58 pips.
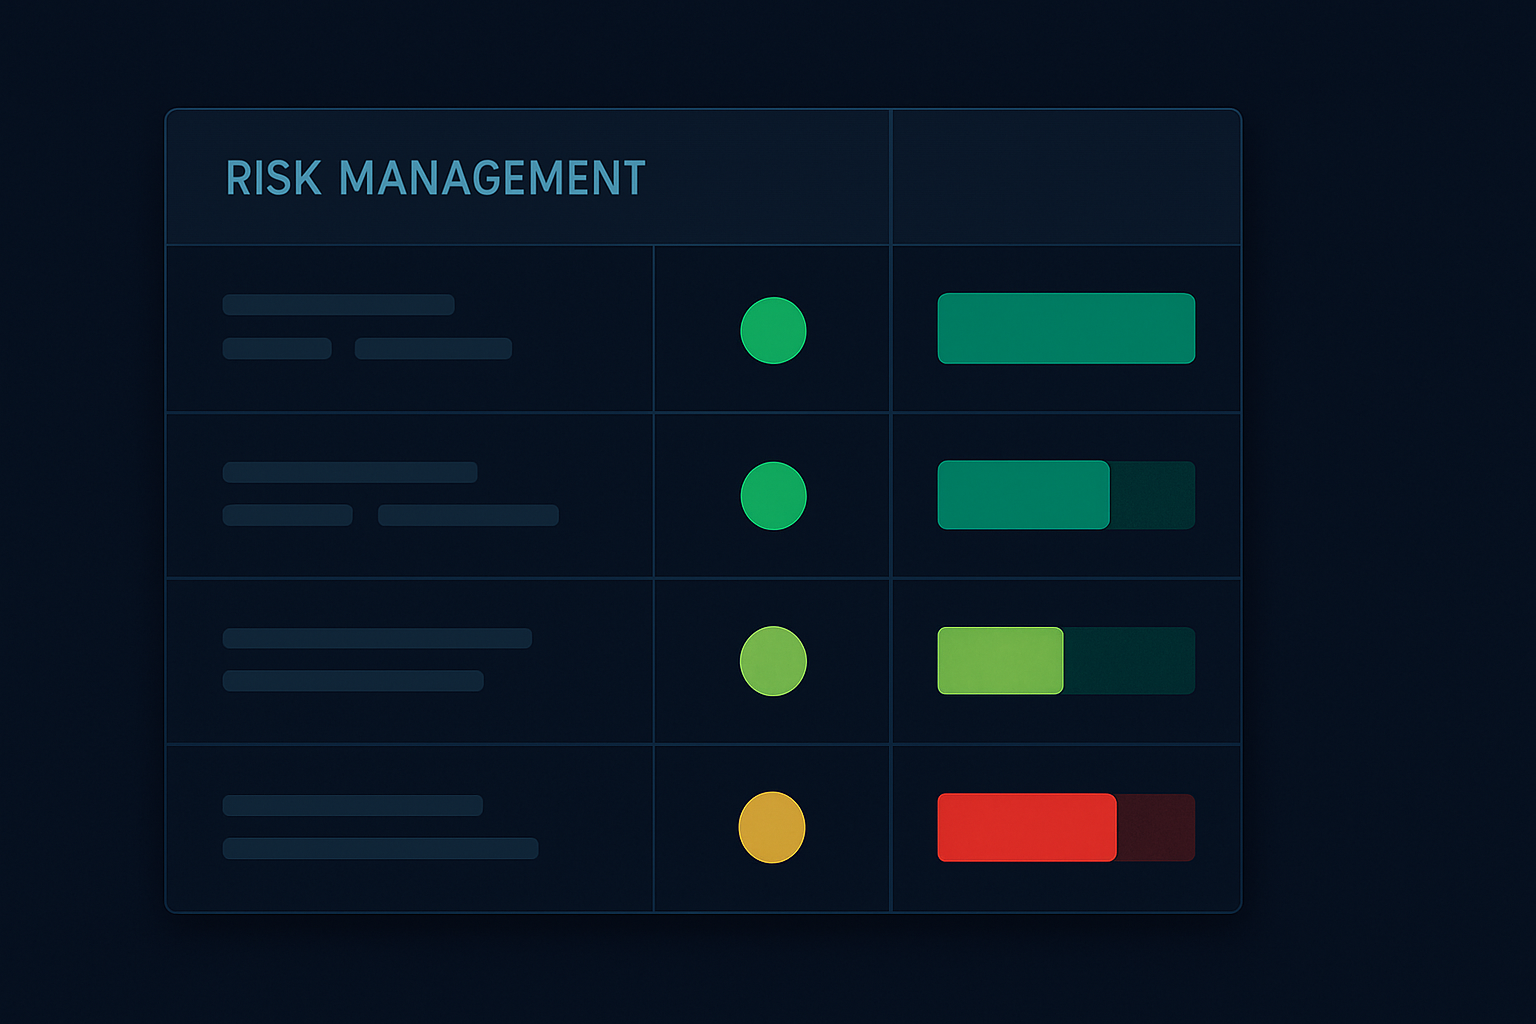
Risk Management: The Non-Negotiables
This strategy prints money but it can also blow up spectacularly if you're careless. Here are my non-negotiable rules developed through painful experience:
1. Position Sizing
Never risk more than 0.5% per drainage trade. The 15-minute window is high probability but when it fails, it fails hard. I learned this during a BOE surprise in September 2023 — lost 1.5% in one trade before adjusting my rules. This aligns with the position sizing principles that saved my account.
2. News Proximity Cutoff
No entries inside T-5 minutes. Period. The spread widening and volatility make it impossible to get decent fills. I've tested this extensively — entries at T-4 minutes or later have a 73% higher slippage cost.
3. Correlation Minimum
At least 3 correlated assets must confirm the drainage pattern. This saved me during the fake drainage before the May 2024 FOMC when algorithms spoofed EUR/USD drainage while other assets remained normal.
4. Maximum Daily Frequency
One drainage trade per day maximum. These setups are mentally exhausting and require intense focus. Trading multiple drainage patterns in one day led to overtrading and poor decisions. I discuss this psychology in my analysis of pre-market news trading patterns.
5. The Circuit Breaker
Two consecutive stopped drainage trades = no trading for 48 hours. This rule came after a brutal week in November 2023 when I revenge traded after two stops and lost 4.7% in one day.
Current Market Context: June 2026 Opportunities
With the Fear & Greed Index at 13, we're in prime drainage territory. Fear markets create more pronounced drainage patterns because institutions are extra cautious. Here's what I'm watching:
Next Week's Calendar:
- Tuesday: RBA Rate Decision (watch AUD crosses from 11:30 PM EST Monday) - Wednesday: US CPI (drainage typically starts at 8:15 AM EST) - Thursday: ECB Meeting (most reliable drainage patterns, starts 7:35 AM EST) - Friday: University of Michigan Sentiment (lighter drainage, less reliable)
Given current market conditions, I'm seeing drainage patterns starting earlier — sometimes T-25 minutes for major releases. The fear is palpable in the order books. This reminds me of patterns discussed in order flow trading during accumulation phases.
Pairs to Focus On:
EUR/USD: Most liquid, clearest drainage patterns Gold: Fear market safe haven, expect aggressive ask drainage BTC/USD: Increasingly correlated with macro announcements USD/JPY: BOJ divergence makes this especially interesting
One thing I've noticed — crypto drainage patterns are maturing. Two years ago, Bitcoin showed no pre-announcement drainage. Now? It's as clear as forex majors. Institutional adoption is real.
Advanced Integration: Combining Drainage with Smart Money Concepts
Drainage trading becomes exponentially more powerful when combined with other institutional footprints. Here's how I layer my analysis:
Order Blocks + Drainage
When drainage occurs near a daily order block, the reaction is violent. I map major order blocks on the daily timeframe, then watch for drainage patterns when price approaches these levels before news. The confluence creates 70%+ win rate setups.
Liquidity Sweeps + Drainage
My favorite combination. If we get a liquidity sweep in the hour before a major announcement, followed by drainage in the opposite direction, that's institutional positioning at its finest. They sweep stops, then drain liquidity to position for the real move.
Fair Value Gaps + Drainage
When drainage happens while price sits in a fair value gap, expect explosive moves. The FVG acts as a magnet, and drainage tells you which way price will shoot through it.
I use FibAlgo's smart money detection features to identify these confluences automatically. The platform's ability to spot institutional order flow complements drainage analysis perfectly — when both align, probability skyrockets.
The Evolution: Where Drainage Trading Is Heading
After six years in this game, I've watched drainage patterns evolve. Here's what's changing:
Algorithmic Adaptation
Institutions now use ML to optimize drainage timing. The patterns are becoming more sophisticated, starting earlier and showing more nuanced behaviors. What worked in 2020 needs constant refinement in 2026.
Cross-Market Correlation
Drainage now cascades across more assets. I'm tracking patterns in commodity futures, crypto derivatives, even NFT liquidity pools. The interconnectedness creates more opportunities but requires broader market awareness.
Regulatory Scrutiny
Post-FTX, regulators are watching pre-announcement behavior more closely. Some institutions are adapting by making drainage less obvious — smaller increments, longer timeframes. The patterns still exist but require finer detection.
Retail Awareness
More retail traders know about drainage now. But knowledge isn't execution. I still see traders entering too early, ignoring correlations, or overleveraging. The edge remains for those who execute with discipline.
Your 30-Day Drainage Trading Challenge
Want to master this? Here's your roadmap:
Week 1: Observation Only Watch every major announcement. Document drainage patterns without trading. Build pattern recognition. Use the T-20 to T-0 framework. Note differences between announcement types.
Week 2: Paper Trade Execute the strategy on demo. Focus on timing and correlation confirmation. Track win rate and average risk/reward. Expect 40-50% win rate initially — that's normal.
Week 3: Micro Live Trading Trade with 0.1% risk per trade. Focus on execution quality, not profits. Document every trade. Pay special attention to failed setups — they teach the most.
Week 4: Refinement Analyze your data. Identify your best and worst announcement types. Adjust the framework based on results. Most traders find they excel at specific announcements (mine is ECB).
Remember — this isn't about catching every move. It's about exploiting a specific institutional behavior with edge. Stay disciplined, and the profits follow.
The market is speaking in the 15 minutes before every major announcement. Most traders are too busy preparing for the news to listen. That noise is your signal. That chaos is your opportunity.
Master the drainage, and you'll never look at pre-announcement markets the same way again.
❓Frequently Asked Questions
1What is pre-announcement liquidity drainage?
2Which announcements show the strongest drainage patterns?
3What's the optimal timeframe for spotting drainage?
4How much capital should I risk on drainage trades?
5Can algorithms detect these patterns automatically?