Everyone's Watching Price While Structure Screams "Get Out"
Market structure speaks a language most traders never learn to read. They watch price bars going up and down, maybe throw on some moving averages, and completely miss the skeletal framework that's literally falling apart beneath the surface.
I learned this the expensive way. My mentor Mike at T3 Trading used to stand behind my desk during the 2007 top, pointing at my screens: "Elena, zoom out. What's the monthly chart telling you that the daily isn't?" I was too busy scalping ES futures to listen. Six months later, watching my swing account evaporate in the 2008 crash, his words haunted me.
Since then, I've spent 9 years perfecting a system to read market structure breakdowns that signal major bear trends 3-6 months before price finally rolls over. No indicators. Just raw price structure speaking its truth.

This isn't about calling tops — that's a fool's game. This is about recognizing when the market's internal scaffolding starts buckling under its own weight, giving you months to adjust positions before the real damage begins.
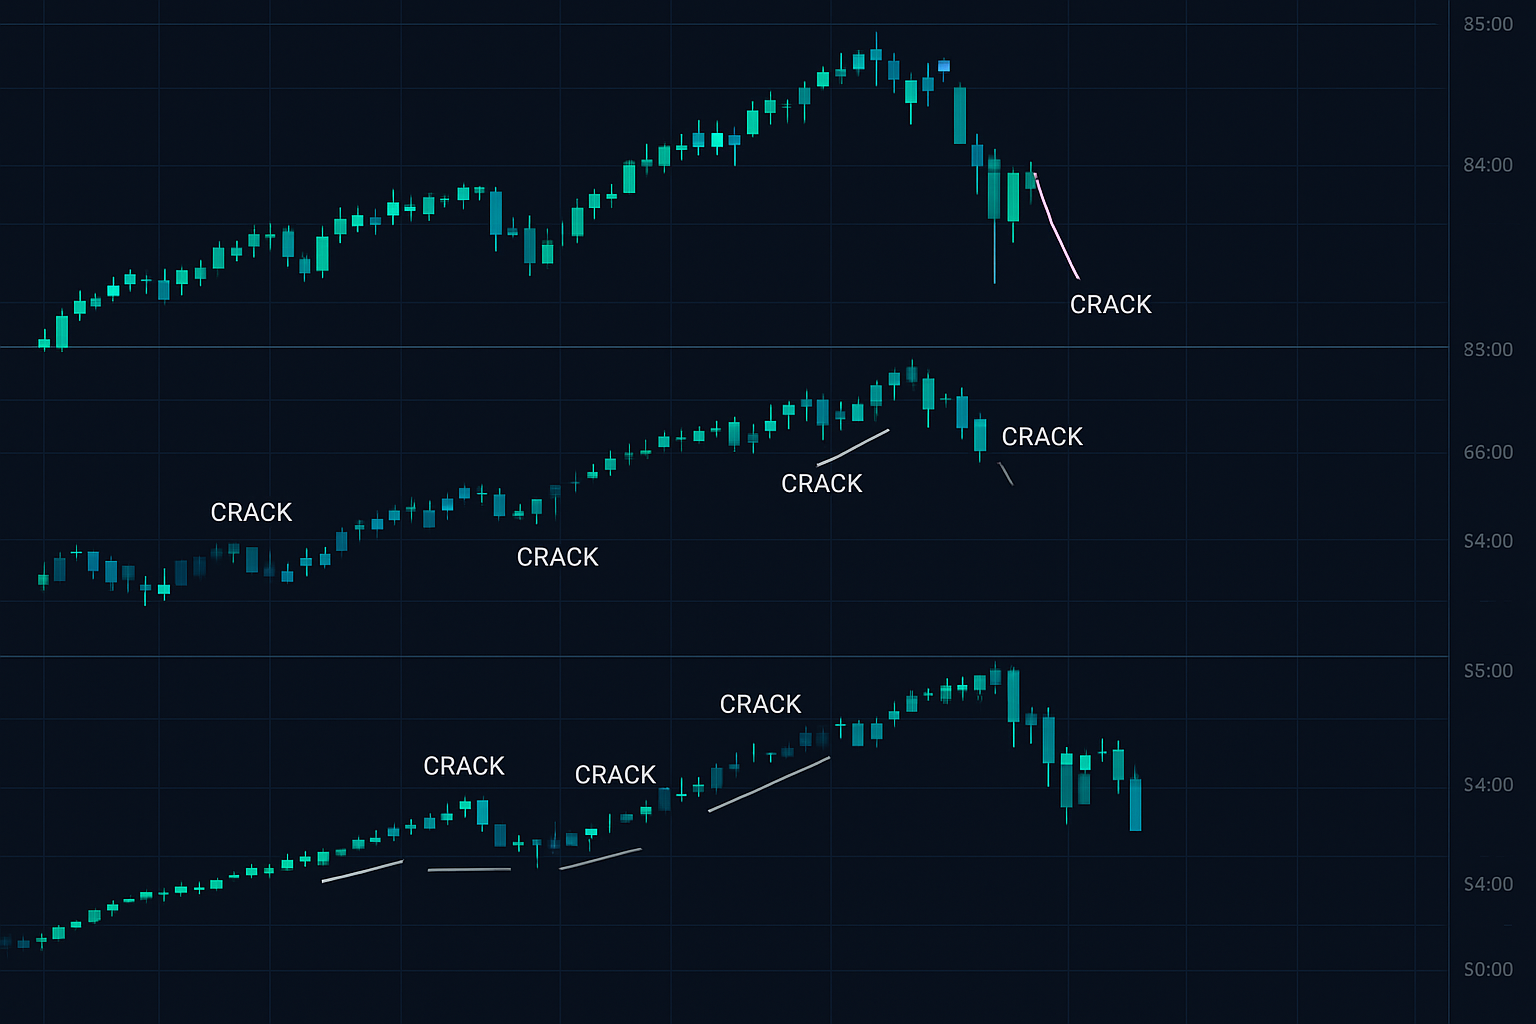
The Three Cracks That Always Appear First
After analyzing every major bear market since 1987, the same three structural cracks appear in sequence. Miss one, you might survive. Miss all three, and you're riding the full drawdown.
Crack #1: The Monthly Swing Failure
This is where it starts. On a monthly chart, price makes a new high but can't hold it. The monthly candle closes below the previous month's high, creating what I call a "rejection wick." But here's what everyone misses — it's not about that one candle. It's about what happens next.
Watch for the retest. Markets always retest. When SPX hit 4818 in January 2022, it wasn't the rejection that mattered. It was the failed retest at 4637 in March that confirmed the structure crack. A 3.7% failure to reclaim a high on a monthly timeframe is a massive red flag.
Most traders are too zoomed in on the hourly chart to even notice. They're buying the "dip" while monthly structure is screaming distribution.
Crack #2: The Breadth Divergence Breakdown
Here's where my order book training pays off. Market breadth isn't about some indicator — it's about counting. Literally counting.
In October 2021, SPX was making new highs. But only 42% of S&P 500 stocks were above their 50-day moving average. By December, with SPX still near highs, that number dropped to 31%. The generals were marching forward while the troops retreated.
I track this manually. Every weekend, I count. How many stocks in the index are in confirmed uptrends (higher highs, higher lows)? When that percentage drops below 40% while the index floats near highs, crack #2 is confirmed.
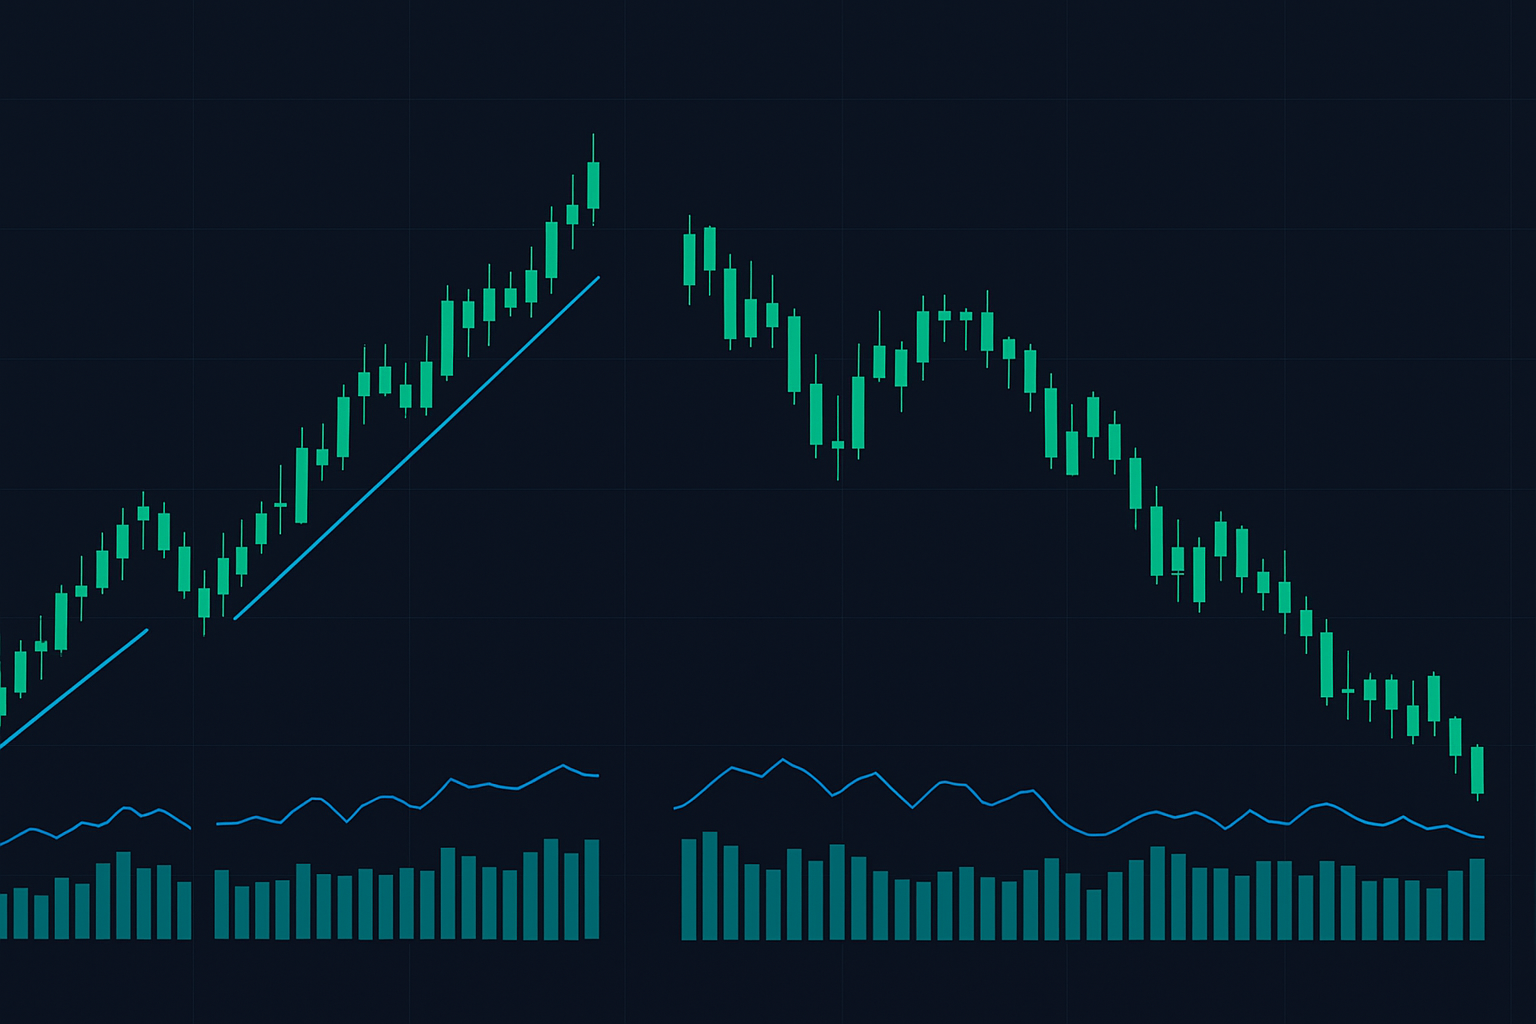
Crack #3: The Failed Reaccumulation
This is the killer. After cracks #1 and #2, the market always attempts one more push higher. It looks like accumulation — a beautiful bull flag or ascending triangle on the daily chart. Retail piles in.
But zoom out to the weekly. That "bull flag" is actually a lower high. The "breakout" fails to exceed the rejection wick from crack #1. Volume is lower. The range is tighter.
November 2007: SPX built a gorgeous ascending triangle from August to October. Daily structure looked perfect. Weekly structure? Lower high at 1576 vs July's 1555. The October "breakout" to 1576 failed within days. Eight months later, SPX was trading at 666.

The Timeline: Your 6-Month Early Warning System
Here's what 9 years of tracking these patterns taught me — they unfold like clockwork:
Month 1-2: Crack #1 appears. The monthly rejection wick. Most dismiss it as "healthy consolidation."
Month 3-4: Crack #2 becomes obvious. Breadth deteriorates while price goes sideways. Rotation into fewer and fewer leaders. The sector rotation everyone counts on starts breaking down.
Month 5-6: Crack #3 forms. The failed reaccumulation. This is when smart money distributes to retail buying the "breakout."
Month 7+: Price finally breaks down. By now, the monthly chart shows a clear lower low. The bear market is "official" but you've had 6 months warning.
January 2000: Crack #1 appeared with NASDAQ's monthly rejection at 5132. By March, breadth was crumbling (crack #2). The April-May consolidation (crack #3) looked bullish on dailies but was clearly a lower high on weeklies. The real breakdown didn't start until September. Nine months of warning if you could read structure.
The 2018 Case Study That Validated Everything
October 3, 2018, 2:47 PM. I'm watching SPX test 2940 for the third time. My screens are clean — just candlesticks. The daily chart shows a perfect ascending triangle. Bullish setup, right?
Wrong. Pull up the monthly chart and the story changes completely.
September's monthly candle: massive rejection wick from 2940. That's crack #1.
I check my breadth spreadsheet: only 38% of SPX stocks above their 50-day MA despite the index near highs. Crack #2 confirmed.
The October retest of 2940? Lower high on the weekly timeframe. Crack #3.
I didn't short it — I'm a day trader, not a position trader. But I did close all swing longs and warned every trader I knew. SPX dropped 20% over the next three months while everyone wondered "what happened?"
Structure told us. Six months early.
The Scan That's Saved Me Millions
Every Sunday, I run the same routine. Takes 2 hours, no indicators needed:
- Monthly Chart Review: Pull up monthly charts for SPX, NDX, RUT, DJI. Look for rejection wicks at highs. Mark any that close below the previous month's high.
- Breadth Count: Manually review all 11 sectors. Count what percentage of stocks are in confirmed uptrends. When 3+ sectors drop below 40%, overall market breadth is breaking.
- Weekly Structure Check: For any index showing monthly rejection, drop to weekly. Is the current consolidation making higher highs? Or is it contained below the monthly rejection level?
- Volume Analysis: Compare volume on up weeks vs down weeks. In healthy markets, up weeks have higher volume. When down weeks start showing heavier volume, distribution is happening.
This process identified the 2020 February top (though COVID accelerated the timeline), the 2022 January top, and most recently, flagged warning signs in several sectors that I'm watching carefully in this current fear environment.
Why This Works When Everything Else Fails
Indicators lag. Moving averages lag. Even volume lags. But structure? Structure is the market's skeleton. When bones start breaking, the body follows.
Think about it: what creates a lower high? Sellers overwhelming buyers at a lower level than before. What creates breadth divergence? Money flowing out of the majority into a minority. What creates failed reaccumulation? Distribution disguised as consolidation.
These aren't lagging indicators. They're real-time evidence of supply overwhelming demand at the institutional level.
My mentor Mike used to say: "Elena, price can lie for a day, maybe a week. Structure can't lie for a month." After watching structure save my capital through multiple bear markets, I finally understand what he meant.
The Integration Edge for 2026
While I keep my charts clean, I'm not stubborn about using tools that enhance what my eyes see. Fibonacci extensions can help project the depth of structure breaks.
When crack #3 forms (the failed reaccumulation), I'll use a Fib extension from the swing low to the rejection high. The 161.8% extension often marks the first major support in the coming bear trend. This is where tools like FibAlgo's automated level detection can save hours of manual charting while maintaining price action purity.
But remember — the tool doesn't make the trade. Understanding structure does.
Common Blind Spots That Cost Traders Everything
After teaching this method to hundreds of traders, the same mistakes appear:
Blind Spot #1: Timeframe Myopia
"But Elena, the 4-hour chart shows a perfect bull flag!" Sure it does. While the monthly shows distribution. Guess which one wins?
Blind Spot #2: Waiting for "Confirmation"
If you wait for price to break down, you've missed the entire point. Structure breaks down first, price follows. By the time price confirms, the easy money is gone.
Blind Spot #3: Ignoring Breadth
"The index is up so the market is healthy." Tell that to 2000 when 5 tech stocks carried NASDAQ while 80% of stocks were already in bear markets.
Blind Spot #4: Fighting the Timeline
These patterns take months to unfold. If you're checking every day for the "crash," you'll drive yourself insane and probably buy the top out of frustration.
Blind Spot #5: Permabear Syndrome
This system identifies major bear markets, not every 5% pullback. In 9 years, I've seen this full 3-crack setup maybe 4-5 times. Don't force it.
Your Bear Market Early Warning Action Plan
Here's exactly what to do starting this weekend:
- Set Up Your Structure Dashboard
Create a simple spreadsheet. Four columns: Index, Monthly Structure (Intact/Cracked), Breadth %, Weekly Trend. Update it every Sunday. Takes 20 minutes once you know what to look for. - Mark Your Levels
On monthly charts, mark the most recent rejection wick high for each major index. These become your line-in-the-sand levels. Price reclaiming them negates the bearish structure. - Track Breadth Manually
Yes, manually. Scrolling through charts forces you to see what automated scans miss. Start with sector ETFs if reviewing all 500 stocks seems daunting. - Create Structure Alerts
Set alerts for monthly closes below key highs. Set alerts for sectors breaking below 40% stocks in uptrends. Let the market tell you when to pay attention. - Practice on History
Pull up 2000, 2007, 2018, 2022 on monthly charts. Find the three cracks. Train your eyes to see what others miss.
This isn't about predicting. It's about recognizing. When the market's skeleton starts breaking, you'll see it months before the crowd. That's your edge.
The Reality No One Wants to Hear
This system works. I've proven it through multiple market cycles. But here's what it won't do:
It won't call the exact top. It won't make you rich overnight. It won't work if you check it daily instead of monthly. It won't save you if you ignore it because "this time is different."
What it will do: give you 3-6 months warning before major bear markets. In a world where most traders ride full drawdowns, that's worth more than any indicator you can buy.
The bear market rallies that trap 80% of traders? You'll see them forming in crack #3. The liquidity hunts that stop everyone out? They happen at the rejection wick levels from crack #1.
Everything connects when you understand structure.
Mike was right all those years ago. The monthly chart was screaming while I was buried in 5-minute candles. Now I listen. The market always warns those who know its language.
Structure doesn't lie. It can't. That's why after 9 years and thousands of trades, it's still the only thing on my screen.
Learn to read it, and you'll never ride another bear market to the bottom again.