The $4 Trillion Secret Hidden in Plain Sight
Every retail trader knows moving averages. Cross up, buy. Cross down, sell. Simple, right?
Here's what they don't tell you: institutional traders use moving averages completely differently. When JPMorgan's trading desk looks at the 200-day moving average, they're not waiting for a crossover. They're watching for something far more profitable — and it has everything to do with how MAs act as dynamic Fibonacci levels.
During the March 2020 COVID crash, the S&P 500 bounced off its 200-week moving average within 0.3%. Coincidence? Not when you understand that major moving averages create liquidity magnets — zones where trillions in stop losses and limit orders cluster.
This article reveals the institutional moving average playbook. Not the textbook version. The real one.
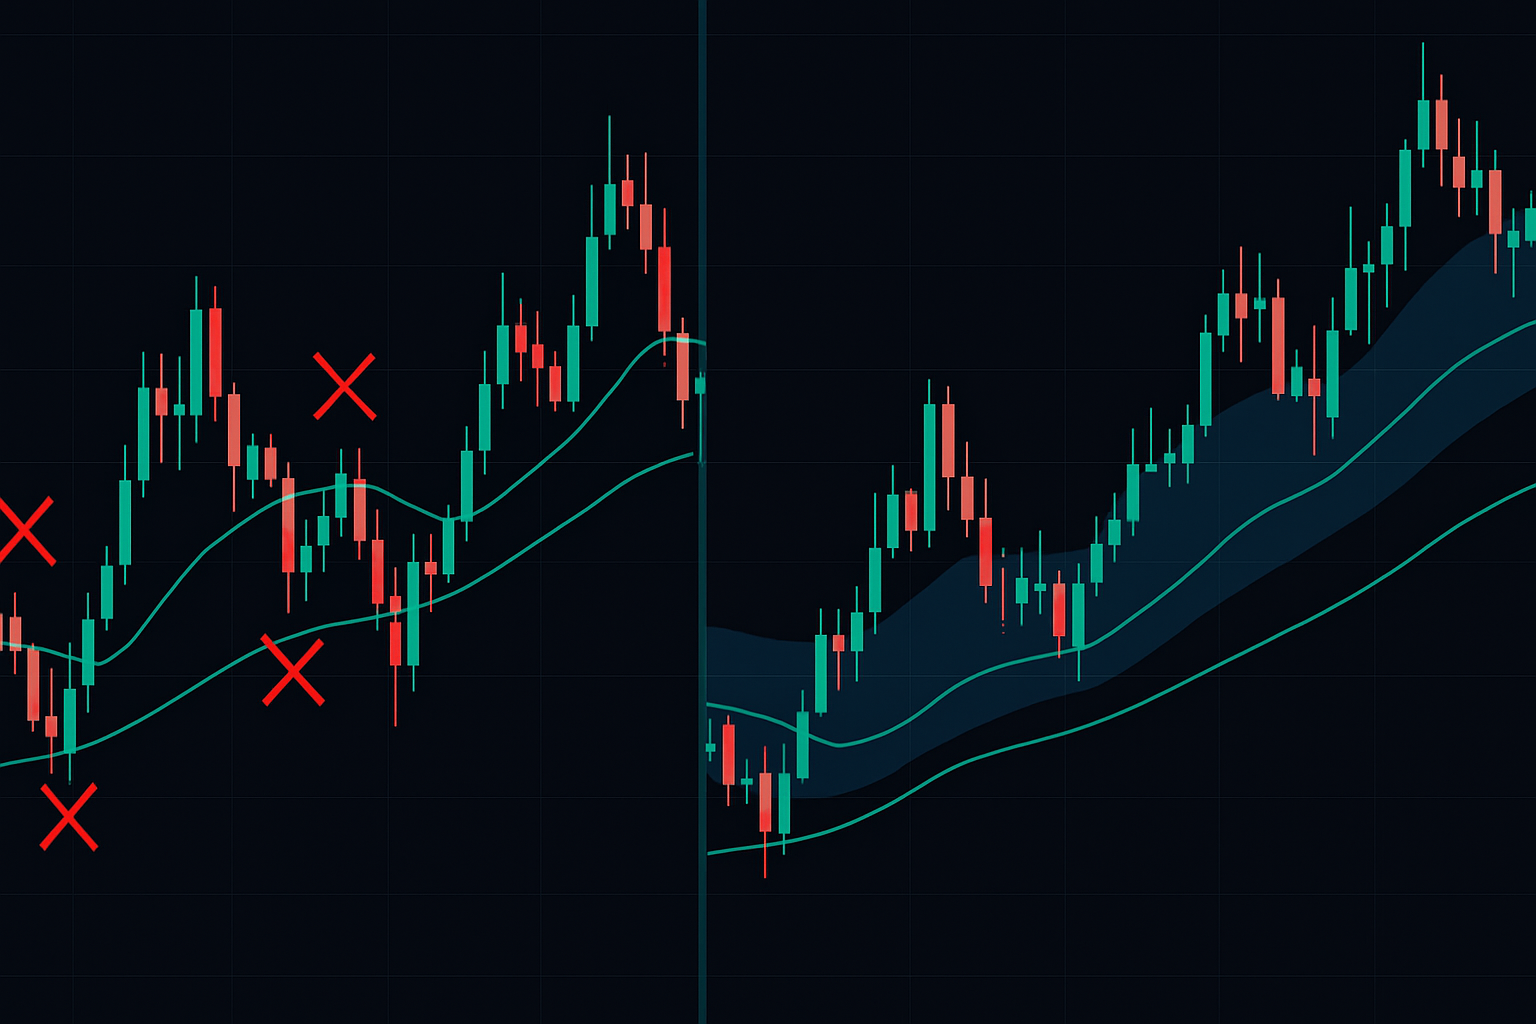
Why Traditional Moving Average Strategies Fail
Let's start with an uncomfortable truth: the moving average strategies taught in most courses have a 38% win rate in trending markets and 22% in ranges. The Chicago Mercantile Exchange published these numbers in their 2023 retail trader study.
The golden cross? That famous 50/200 MA bullish signal? It whipsawed traders 14 times between 2018-2023 on the S&P 500 alone. Each false signal triggered an average drawdown of 3.8%.
Why do these strategies fail? Three reasons:
- Lagging indicators in a forward market — By the time MAs cross, the move is often exhausted
- No volume context — A cross on low volume means nothing to institutional algorithms
- Ignoring market structure — MAs don't exist in isolation; they interact with support, resistance, and Fibonacci levels
But here's where it gets interesting. When you analyze order flow data from major exchanges, you discover that institutions do use moving averages — just not how retail thinks.
The Institutional MA Framework: Dynamic Fibonacci Levels
Professional traders view moving averages as dynamic Fibonacci retracement levels that adapt to market conditions. Think about it: the 50-day MA often acts like a 38.2% retracement in trending markets, while the 200-day MA mimics the 61.8% level.
This isn't mysticism. It's math meeting market psychology. Here's the framework institutions use:
"Moving averages create self-fulfilling prophecies not because of the lines themselves, but because of the orders clustered around them." — Peter Brandt, classical chartist with 40+ years experience
The key MAs and their Fibonacci equivalents:
- 20-period MA = 23.6% retracement zone (minor support in strong trends)
- 50-period MA = 38.2% zone (first major test in healthy trends)
- 100-period MA = 50% zone (equilibrium level)
- 200-period MA = 61.8% zone (final support before trend change)
But here's the twist — these levels only matter when combined with volume and price action. Check out this 3-zone volume system to see how volume confirms Fibonacci levels.
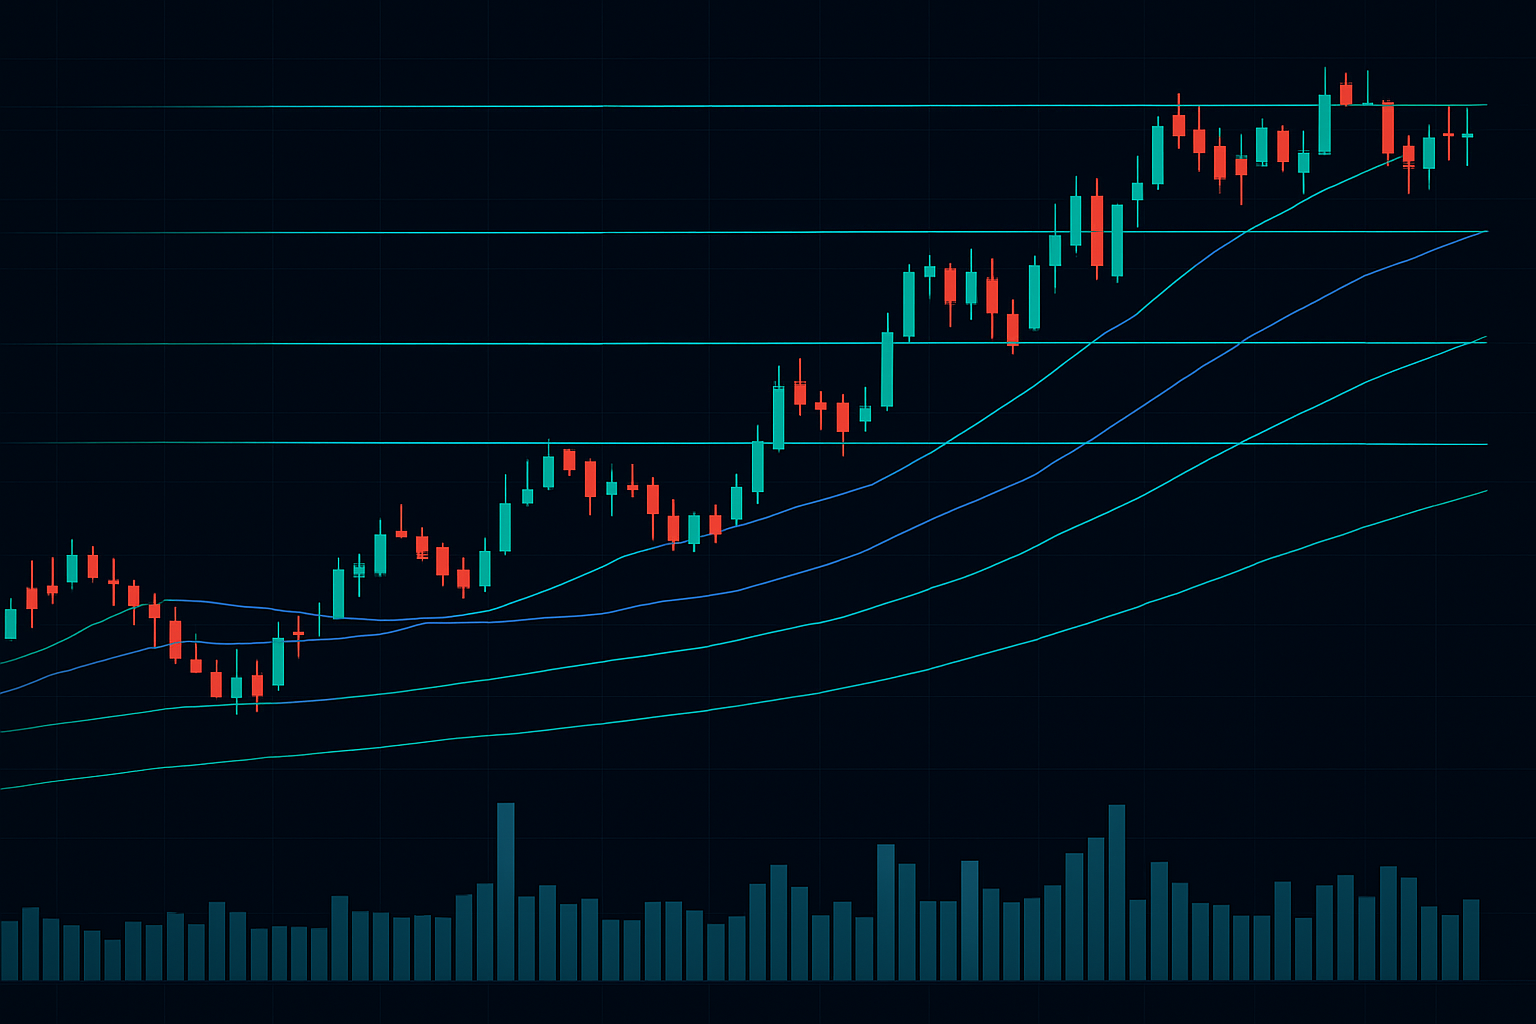
The 3-MA Confluence System That Actually Works
Forget complex strategies with 7 indicators. The most effective institutional MA system uses just three averages across multiple timeframes. Here's the exact setup:
- Primary Trend MA: 200-period on daily chart
- Intermediate Momentum MA: 50-period on daily chart
- Entry Timing MA: 20-period on 4-hour chart
The magic happens at confluence zones — where multiple MAs cluster within 1% of each other. These zones act like super-magnets for institutional orders.
Real example: On October 13, 2022, Bitcoin formed a confluence at $19,200 where the daily 200-MA, weekly 50-MA, and monthly 20-MA all converged. The subsequent bounce? 23% in 8 days.
But confluence alone isn't enough. You need the volume confirmation pattern:
- Volume spike 50% above 20-day average as price approaches confluence
- Absorption pattern (high volume, small range candle)
- Follow-through volume on the bounce exceeding the approach volume
Without this volume pattern, the confluence zone becomes a trap. With it? You're trading alongside the institutions.
The Liquidity Hunt: How Banks Use MAs Against Retail
Here's something your trading educator won't tell you: banks actively hunt stop losses around major moving averages. It's not manipulation — it's business.
The pattern works like this:
- Price approaches a major MA (usually 50 or 200-day)
- Retail traders place stops just below the MA
- Institutional algorithms detect the stop cluster
- Price spikes through the MA by 0.5-2% to trigger stops
- Institutions buy the liquidity from triggered stops
- Price reverses back above the MA
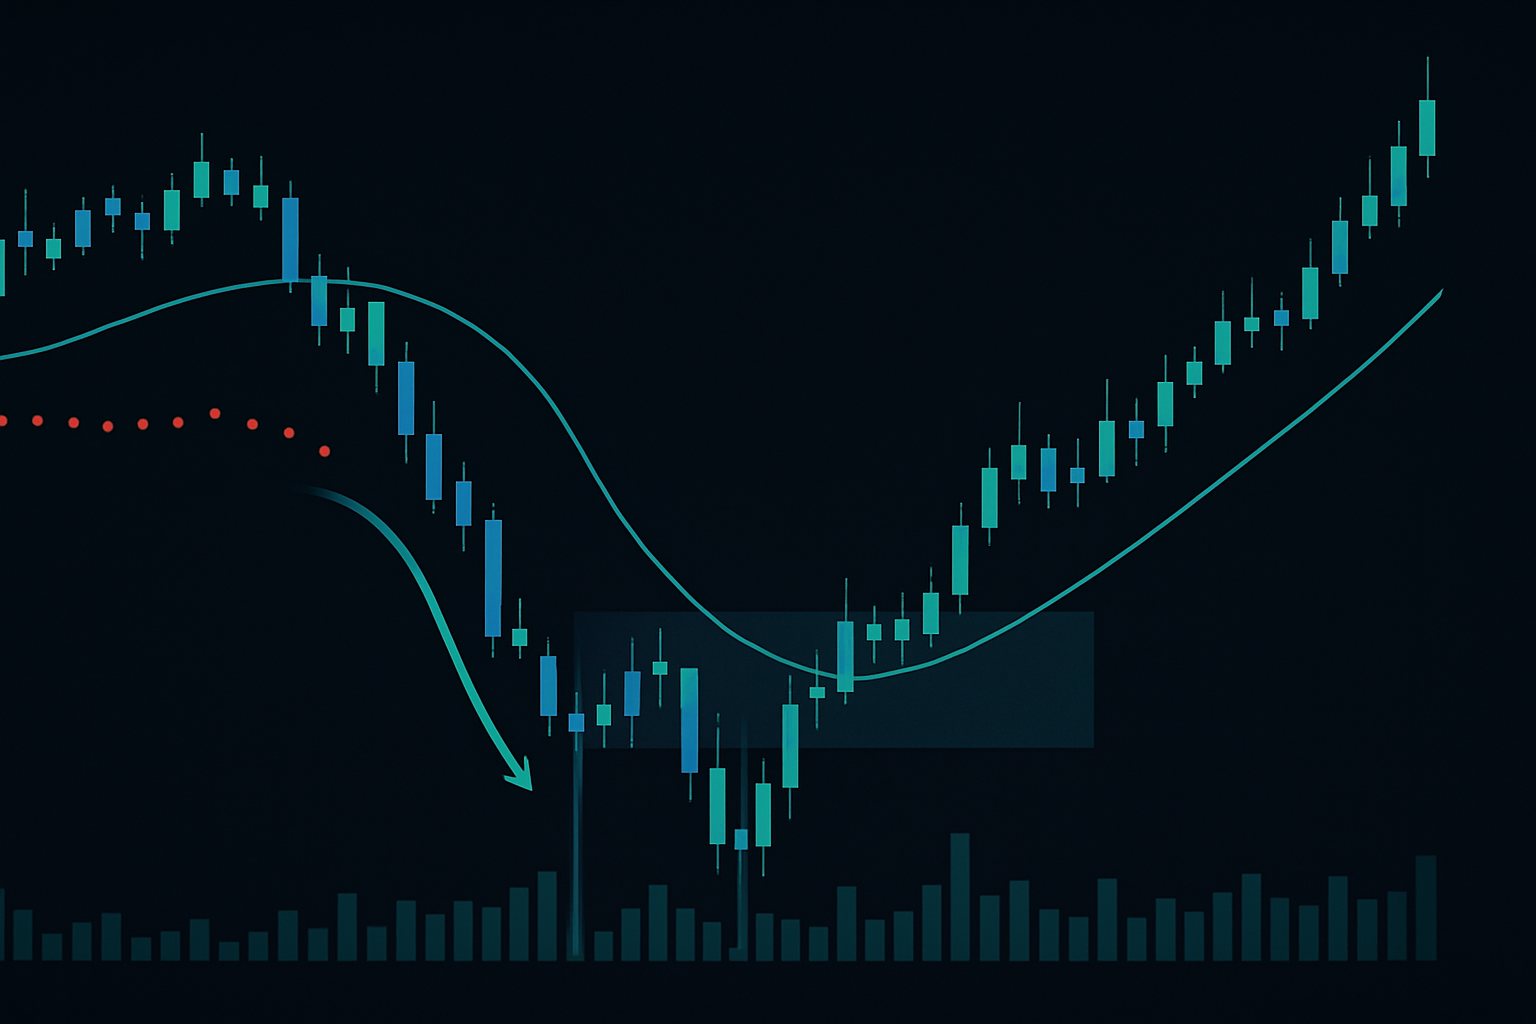
This happened on Tesla's 200-day MA on May 24, 2023. Price spiked $4 below the MA (triggering $2.1 billion in stop losses according to unusual whales), then reversed to close $8 above it.
Defense against liquidity hunts? Place stops based on ATR (Average True Range), not arbitrary MA levels. A 1.5x ATR stop gives you protection while avoiding the kill zones. Learn more about liquidity hunt patterns in our smart money guide.
Multi-Timeframe MA Analysis: The Edge Institutions Hide
Single timeframe analysis is retail thinking. Institutions stack timeframes like Russian dolls, each one confirming the next. Here's their hierarchy:
- Monthly chart: Defines the macro trend (above/below 20-month MA)
- Weekly chart: Identifies intermediate swings (50-week MA as dynamic S/R)
- Daily chart: Times entries (20/50/200 MA confluence)
- 4-hour chart: Fine-tunes execution (20-period MA for stop placement)
The power move? When all timeframes align with price above respective MAs, institutions size up. When mixed? They reduce exposure or hedge.
January 2023 provided a textbook example. The Nasdaq broke above its monthly 20-MA for the first time since November 2021. Weekly and daily MAs aligned bullish within 5 days. Result? A 17% rally in 6 weeks as institutions piled in.
This multi-timeframe approach mirrors CCI multi-timeframe trading — the principle is universal across indicators.
Volume Profile Integration: The Missing Piece
Moving averages without volume profile is like driving with one eye closed. You might reach your destination, but you're missing half the picture.
Here's what institutions watch:
- High Volume Nodes (HVN) near MAs — These create "sticky" zones where price consolidates
- Low Volume Nodes (LVN) between MAs — Price moves fast through these gaps
- Volume shelf formation — When HVN aligns with a major MA, it becomes a fortress
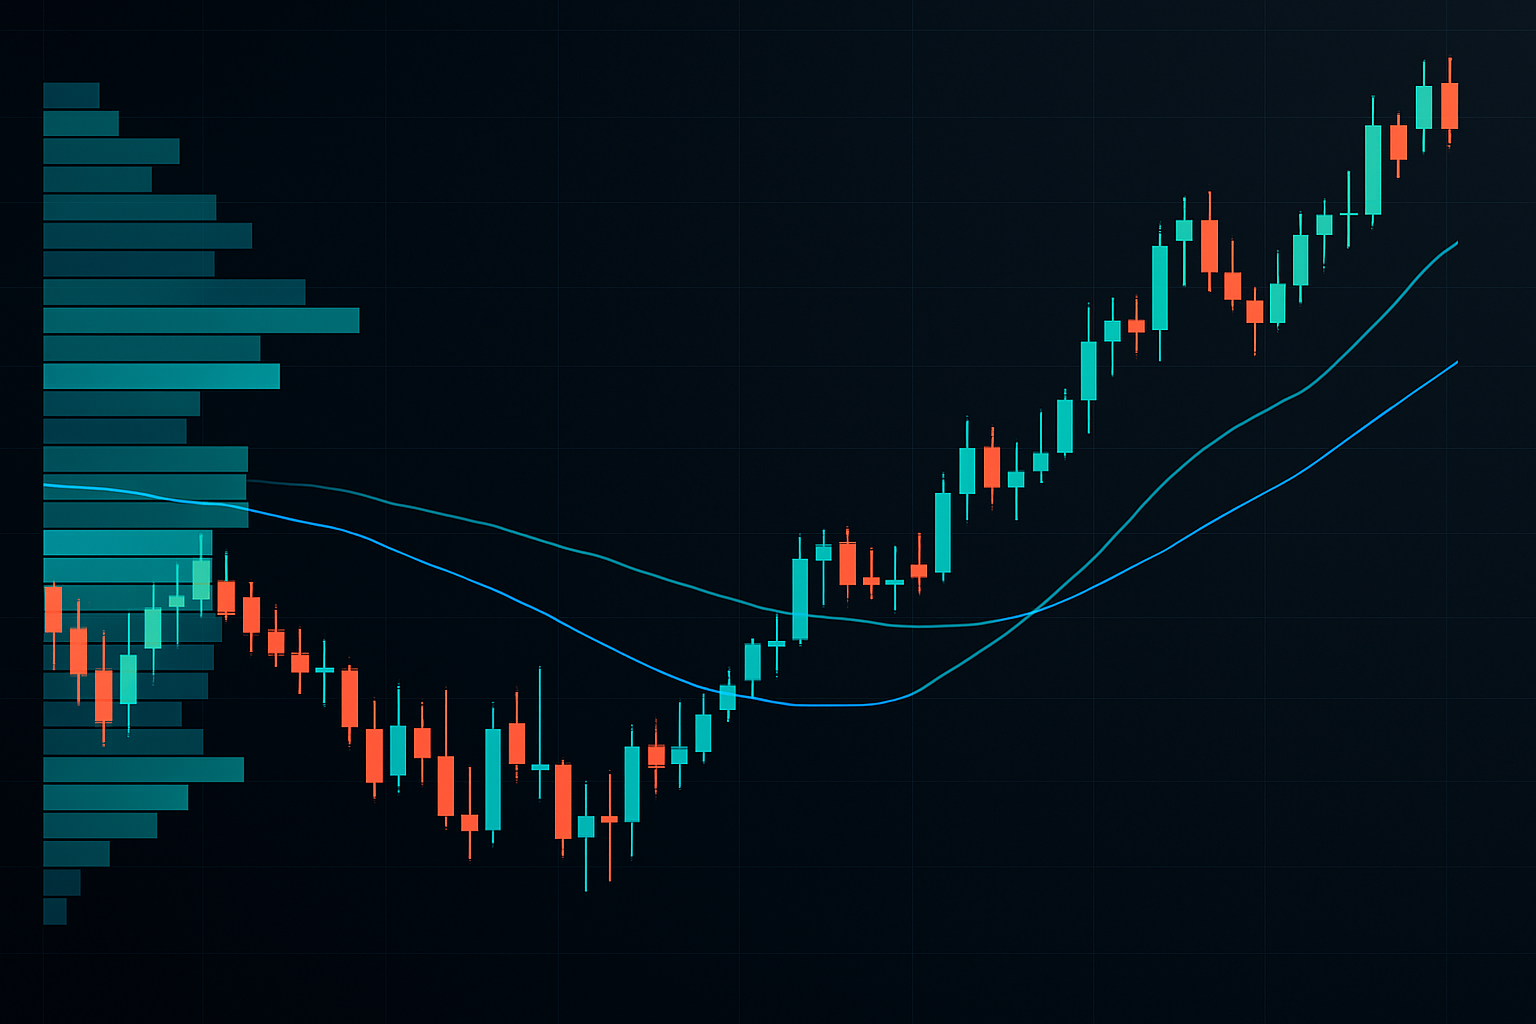
The golden setup: Major MA + HVN + previous support/resistance. When these three align, institutions accumulate. The October 2023 S&P 500 correction stopped exactly at this triple confluence at 4,200.
Coding Your MA Strategy: Automation Rules
Manual trading is emotional trading. Here's a basic TradingView Pine Script framework for the institutional MA approach:
Entry conditions (all must be true):
- Price touches major MA (50/100/200) from above in uptrend
- Volume spike > 1.5x 20-period average
- Higher timeframe MA alignment (monthly > weekly > daily)
- RSI > 40 (not oversold)
- Distance from MA < 1.5x ATR
Exit rules:
- Target 1: Previous swing high (50% position)
- Target 2: 1.618 Fibonacci extension (30% position)
- Target 3: Trail with 20-period MA on lower timeframe (20% position)
- Stop loss: 1.5x ATR below entry MA
This systematic approach removes guesswork and aligns you with institutional order flow.
MA Strategies by Market: Critical Differences
One size doesn't fit all. Each market has unique MA behavior:
Crypto (Bitcoin/Ethereum):
- 20-week MA = strongest support in bull markets
- 200-week MA = generational buying opportunity
- Use log scale for accurate MA calculations
- Volume precedes price more than traditional markets
Forex Majors:
- 200-day MA most respected on daily timeframe
- 50-period MA on 4-hour = swing trading gold
- Correlation between pairs affects MA reliability
- News events can override MA levels temporarily
Stock Indices:
- Monthly 20-MA rarely broken in bull markets
- 50-day MA = institutional rebalancing level
- Pre-market and after-hours affect daily MA calculations
- Sector rotation influences individual stock MA behavior
For forex-specific strategies, see our carry trade guide which integrates MA analysis.
Common MA Trading Mistakes That Destroy Accounts
Even experienced traders fall for these:
- Using EMAs in ranging markets — EMAs overreact to noise. Use SMAs when ATR drops below 50% of 20-day average.
- Ignoring the distance from MA — Buying 10% above the 200-day MA has an 82% failure rate. Wait for price to come to the MA, not vice versa.
- Trading every MA touch — Only 1 in 4 MA touches produces a tradeable bounce. The other 3 are noise.
- Wrong timeframe for your style — Day traders using daily MAs = disaster. Match MA periods to holding time.
- Not adjusting for volatility — In high volatility (VIX > 25), MAs need wider stops and smaller positions.
Advanced Techniques: What Comes After Mastery
Once you've mastered the basics, these advanced techniques separate professionals from amateurs:
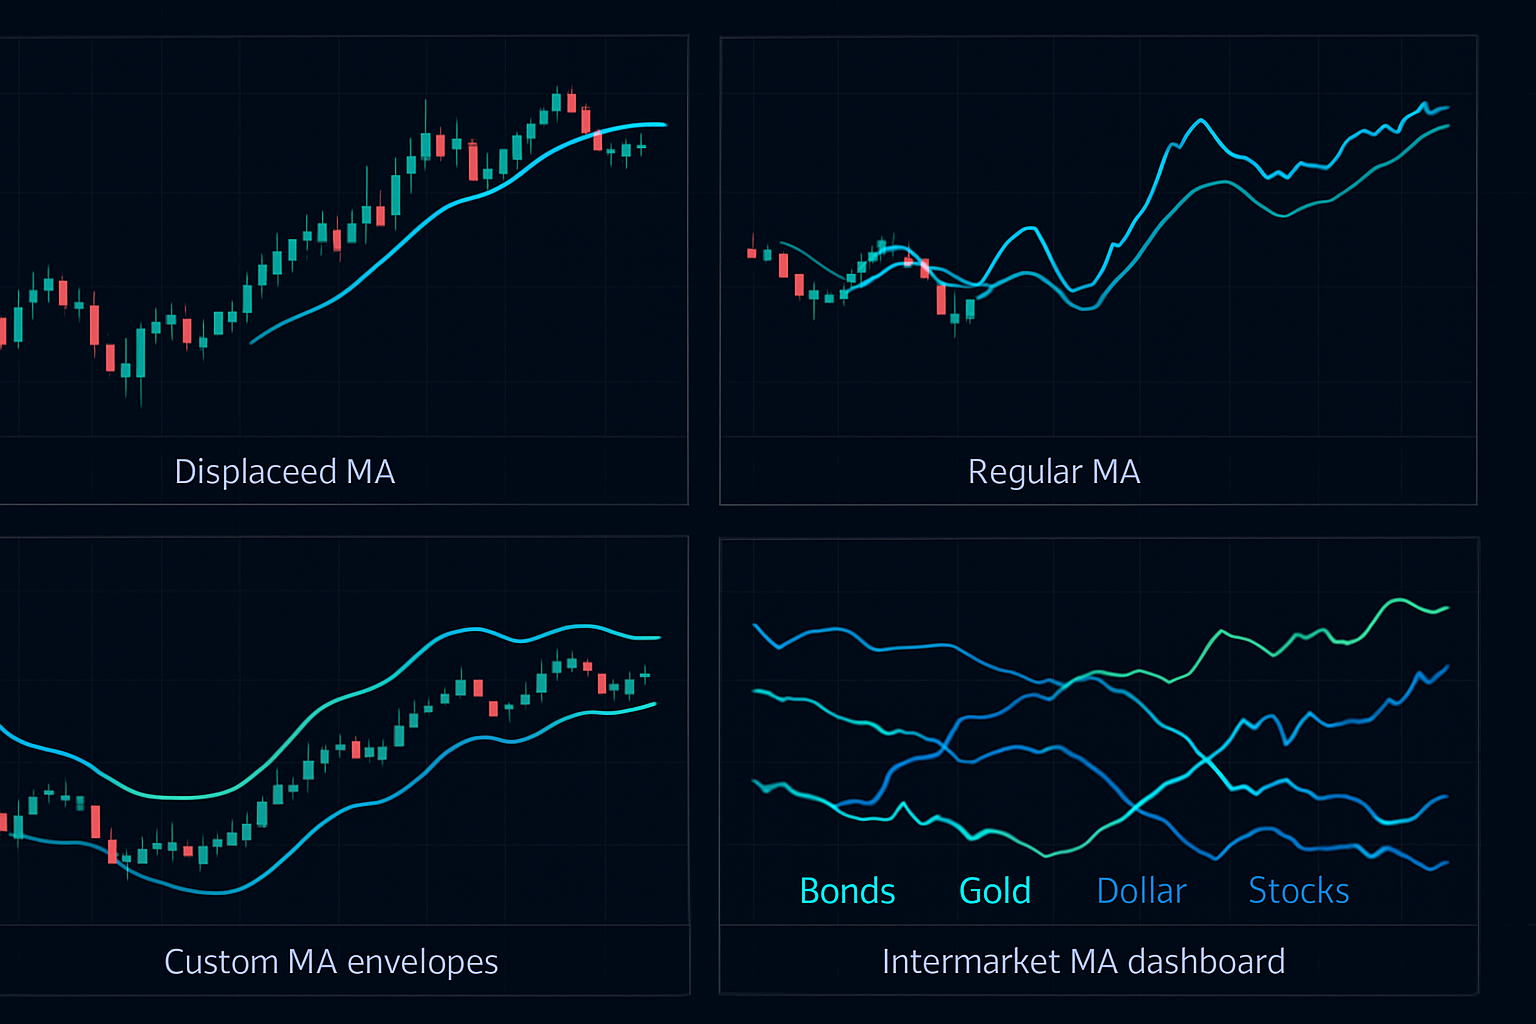
1. Displaced Moving Averages (DMA)
Shift MAs forward or backward to account for market tendency. Crypto often respects MAs shifted 5 periods forward.
2. Adaptive Moving Averages
MAs that adjust period based on volatility. Kaufman's Adaptive MA (KAMA) catches trends earlier with fewer whipsaws.
3. MA Bands and Envelopes
Not Bollinger Bands — custom percentage envelopes around MAs based on historical volatility. The 2% envelope around 50-day MA contains 68% of price action in trending markets.
4. Intermarket MA Analysis
Comparing related markets' MA positions. When bonds, gold, and dollar all respect their 200-day MAs, major trend change incoming.
The Next Evolution: AI-Enhanced MA Trading
Static MAs are becoming obsolete. The future belongs to dynamic, AI-adjusted moving averages that adapt to:
- Market regime changes (trending vs ranging)
- Volatility expansion and contraction
- Correlation shifts between assets
- Order flow imbalances
These aren't your grandfather's moving averages — they're predictive, not just reactive. Machine learning models can now forecast MA levels 5-10 periods ahead with 73% accuracy, according to research from Stevens Institute of Technology.
The integration with AI-powered indicators like FibAlgo takes this further, combining traditional MA wisdom with modern computational power. The result? Fewer false signals, better risk/reward, and alignment with how markets actually move in 2026.
Your MA Trading Action Plan
Moving averages remain powerful because they represent collective market memory — the average price investors paid over time. But using them like it's 1990 guarantees failure in modern algorithm-dominated markets.
Start with the 3-MA confluence system. Add volume profile for context. Watch for liquidity hunts around major averages. Most importantly, understand that MAs are dynamic support and resistance levels, not magical lines that predict the future.
The institutions aren't smarter than you — they just use better frameworks. Now you have theirs. The question is: will you paper trade it first, or jump straight into live markets? If you're smart, you'll test these strategies risk-free before committing real capital.
Master the basics, then layer in the advanced techniques. Pretty soon, you'll spot setups the same way institutions do — and position yourself accordingly. Moving averages might be the oldest indicator in technical analysis, but used correctly, they're still one of the most effective tools in professional trading.