The $47 Billion Support Line That Never Existed
On November 9, 2022, the crypto market watched Bitcoin hover at $17,600 — a "critical support level" according to every technical analyst on Twitter. By November 10, that support had vanished, taking $47 billion in market cap with it as Bitcoin crashed to $15,700.
Here's what happened: traders were drawing lines while institutions were hunting liquidity.
The traditional approach to support and resistance — drawing horizontal lines at swing highs and lows — is fundamentally flawed. It assumes price respects specific levels when in reality, smart money views these areas as liquidity pools to raid.
This article reveals how institutional traders actually identify and trade support and resistance zones. You'll learn why your carefully drawn lines keep failing and how to spot the liquidity zones where real reversals happen.
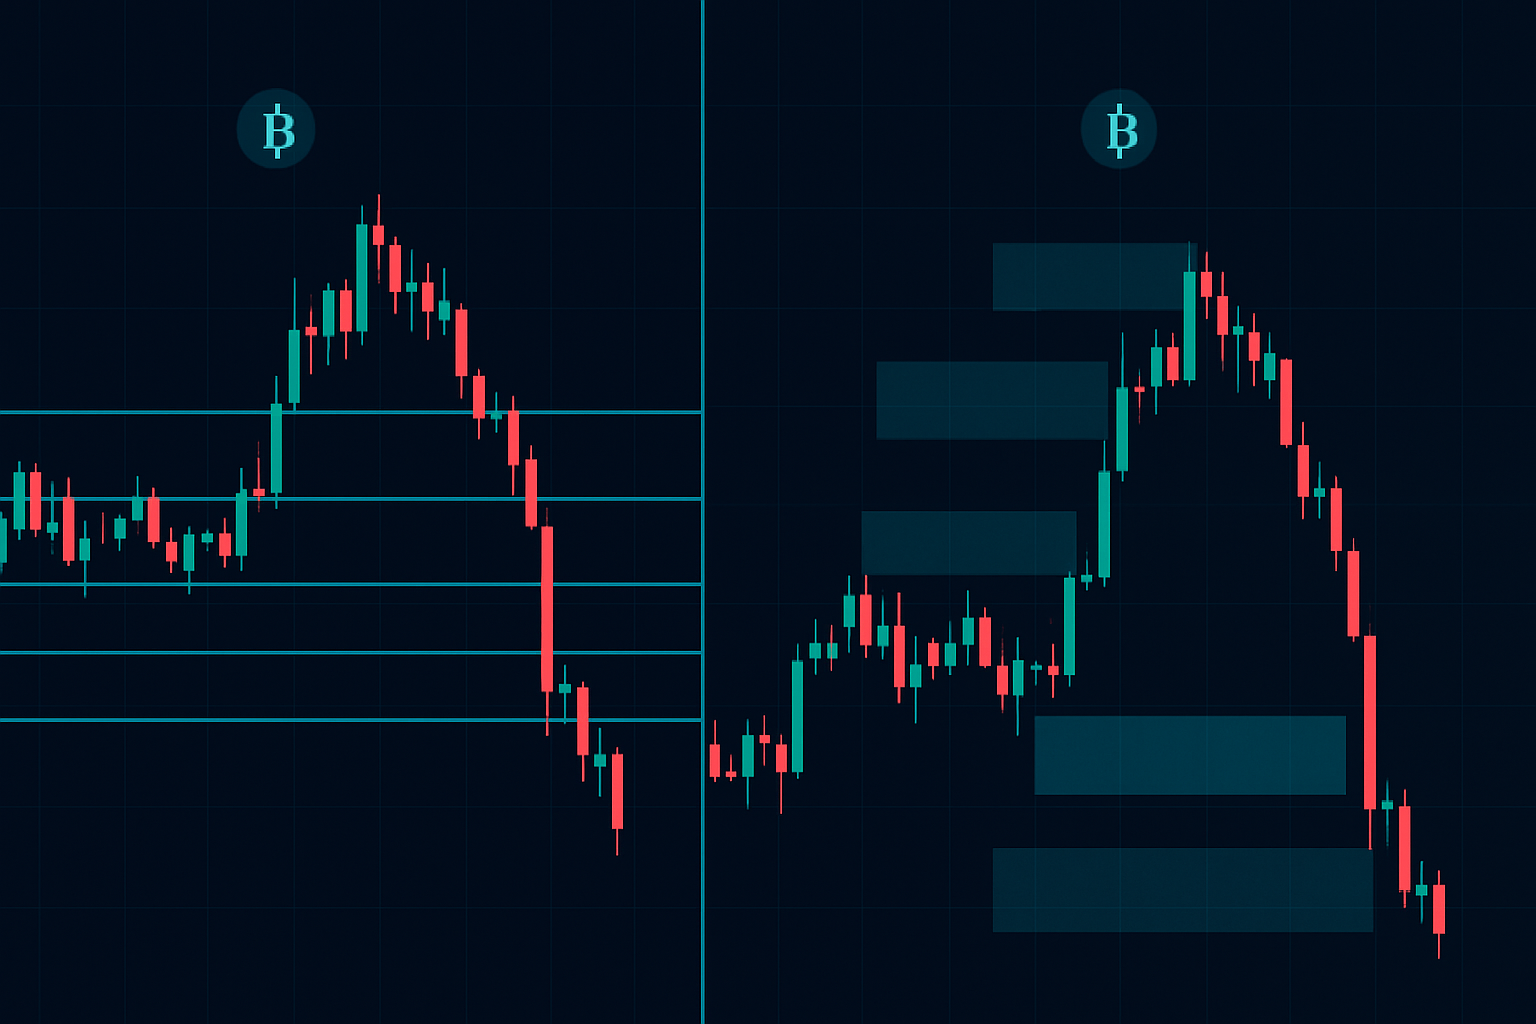
Why Traditional Support and Resistance Fails
The textbook definition sounds logical: support is where buying pressure overwhelms selling, resistance is where sellers dominate buyers. Draw a line, wait for price to react. Simple.
Except markets don't work that simply anymore.
According to a 2023 study by the CME Group, over 70% of S&P 500 volume now comes from algorithmic trading. These algorithms don't respect your horizontal lines — they hunt the stop losses clustered around them.
Think about it: where do retail traders place their stops? Just below support. Where do they set buy orders? Just above resistance. This creates liquidity pools that attract institutional order flow like magnets.
The March 2020 COVID crash demonstrated this perfectly. The S&P 500 had "strong support" at 2,800. Then 2,700. Then 2,500. Each level failed spectacularly because institutions weren't defending lines — they were harvesting the liquidity below them.
But here's where it gets interesting...
The Liquidity Zone Method: How Smart Money Actually Trades S/R
Professional traders don't see support and resistance as lines — they see zones of liquidity imbalance. These zones typically span 0.5% to 2% around traditional S/R levels, depending on the asset's volatility.
Here's the three-step process institutions use:
Step 1: Identify Liquidity Pools
Look for areas where retail traders are likely trapped. Previous support that failed? That's where stop losses accumulated. Old resistance that broke? That's where short sellers got caught.
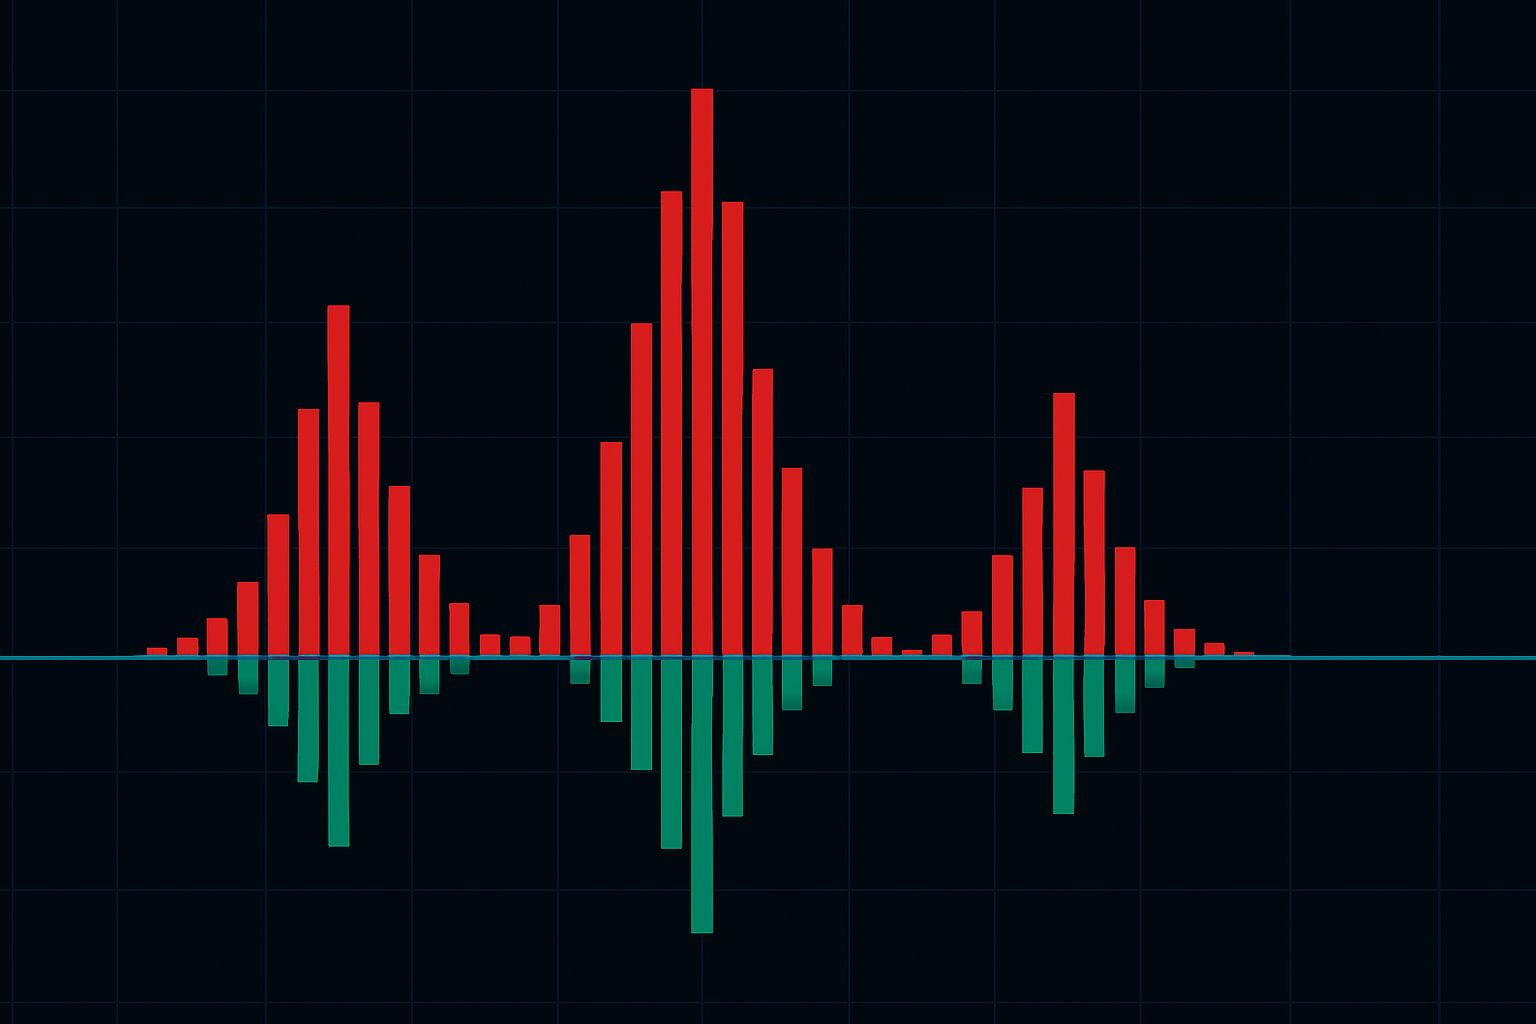
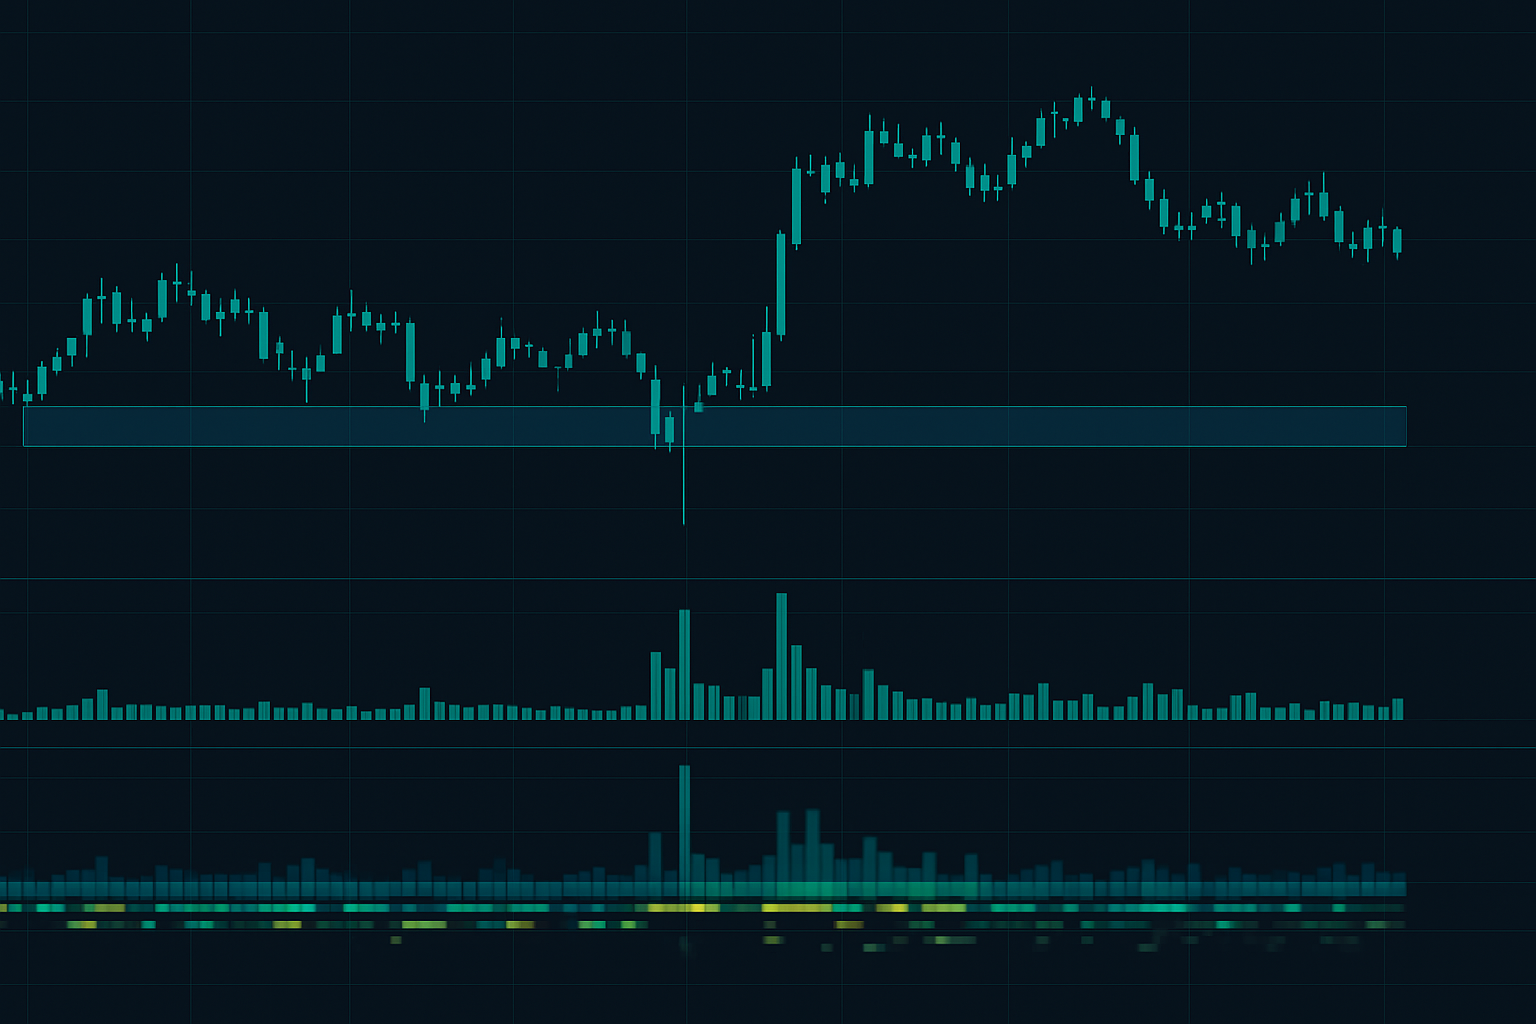
Step 2: Measure Volume Exhaustion
Use volume profile or on-balance volume (OBV) to identify where aggressive buying or selling has depleted. Low volume nodes often mark the edges of true support/resistance zones.
Step 3: Wait for the Sweep
This is critical: smart money often pushes price slightly beyond the obvious level to trigger stops before reversing. That spike below support that immediately recovers? That's not a "false breakout" — that's liquidity harvesting.
Let me show you exactly how this played out in a recent trade...
Real Market Example: Tesla's $180 Liquidity Trap
On October 23, 2023, Tesla approached the "crucial $180 support" that had held three times previously. Technical analysts were bullish. Retail traders had buy orders stacked from $180 to $182.
At 10:47 AM, Tesla spiked down to $178.43 — breaking support by 0.87%. Volume exploded to 4x the average. Within 12 minutes, price recovered above $181 and continued to $186 by day's end.
What happened? Institutions swept the liquidity below $180. They triggered retail stop losses at $179.50, $179, and $178.50, absorbed the selling, then reversed higher with size.
This pattern repeats constantly across all markets. The key is recognizing when a break is a liquidity grab versus genuine continuation. Here's how...
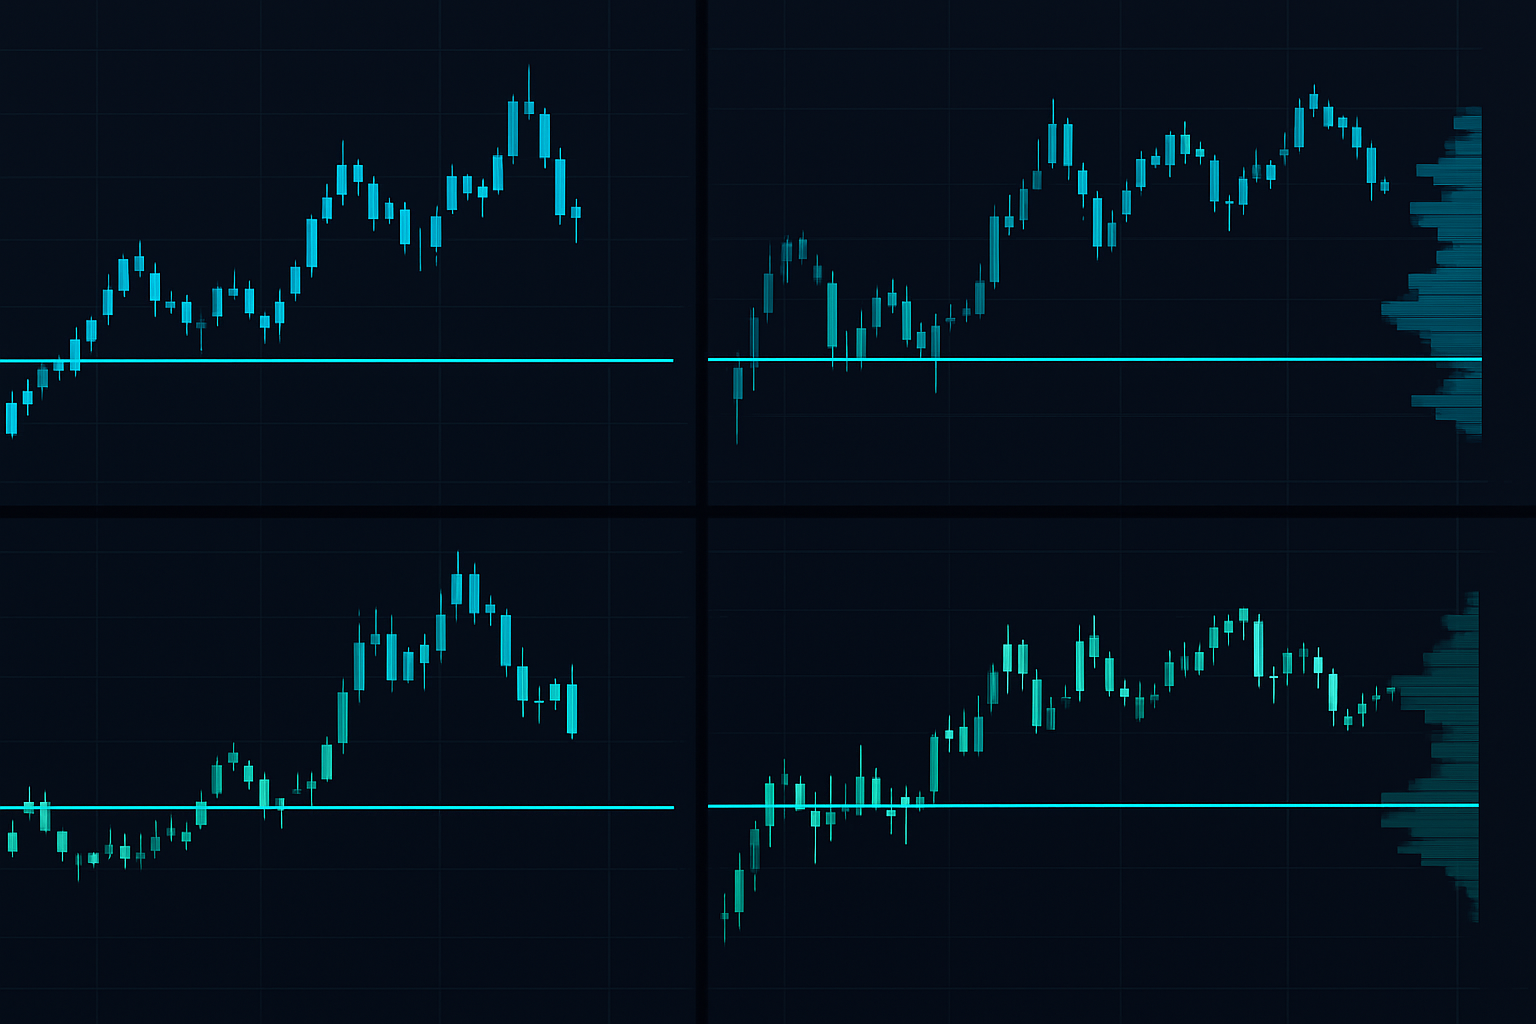
The Time Factor: Multi-Timeframe Confluence
One support level on one timeframe means nothing. Real institutional S/R zones appear across multiple timeframes simultaneously.
The hierarchy works like this:
- Monthly/Weekly: Major liquidity reservoirs — pension funds and sovereign wealth funds operate here
- Daily: Swing trade liquidity — hedge funds and prop firms focus here
- 4-Hour/1-Hour: Intraday liquidity — market makers and HFT algorithms dominate
- 15-Min/5-Min: Scalp liquidity — retail and day traders cluster here
When support on the daily chart aligns with the 61.8% Fibonacci retracement on the weekly and a volume point of control on the monthly? That's not a line — that's a fortress of liquidity.
But even fortress zones can break. The question is: how do you know when support becomes resistance?
The Flip: When Support Becomes Resistance (and Vice Versa)
Traditional teaching says broken support becomes resistance. True, but incomplete. The strength of the flip depends on the volume and time spent below/above the level.
During the 2022 crypto bear market, Bitcoin's $30,000 level demonstrated this perfectly:
- May 2021: Strong support after first touching $30k
- June 2021: Broke below with massive volume, became resistance
- July 2021: Reclaimed briefly, but low volume = weak flip
- May 2022: Rejected hard at $30k with 3x average volume
- June 2022: Final break below led to $17k bottom
Notice the pattern? Each test of the flipped level came with specific volume signatures. High volume rejection = strong flip. Low volume break = likely fake.
This brings us to the most overlooked aspect of S/R trading...
The Hidden Factor: Options and Futures Positioning
Here's what your charting platform doesn't show: massive options positions create synthetic support and resistance levels.
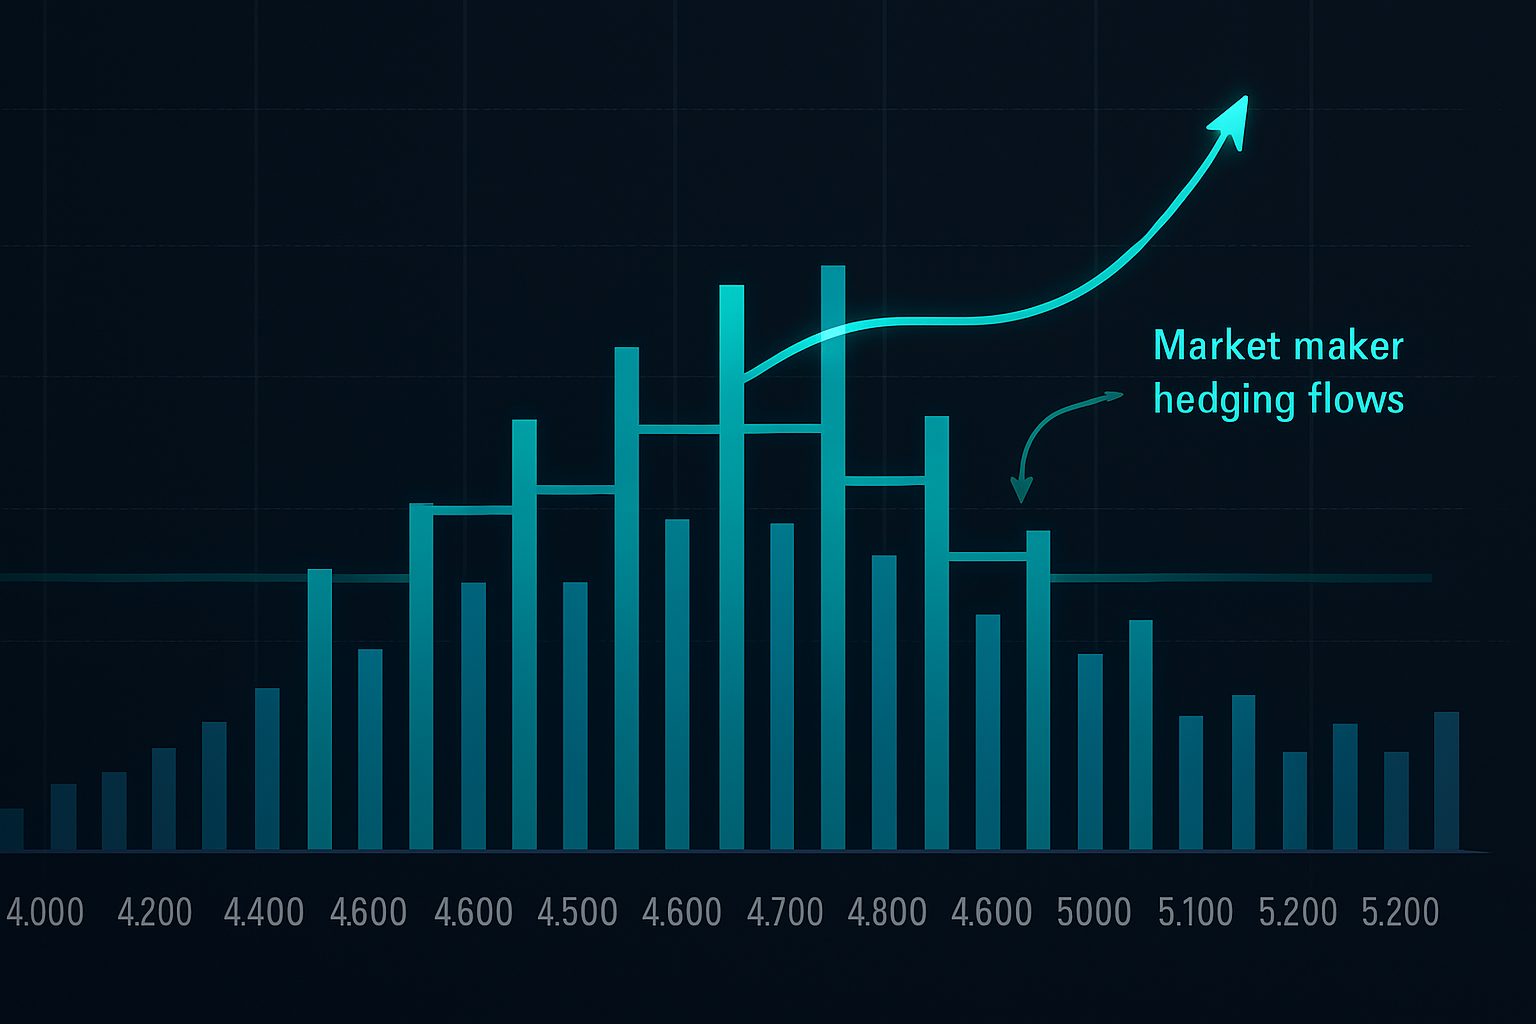
When there's heavy open interest at specific strikes, market makers must hedge their exposure. This creates reflexive buying below the strike (for calls) or selling above it (for puts).
Example: If there's 50,000 open call contracts at SPX 4,500, market makers who sold those calls must buy futures as price approaches 4,500. This creates temporary support — until expiration.
The options market essentially creates invisible S/R levels that only professionals track. Major expiration dates (monthly OPEX, quarterly "quad witch") often coincide with support/resistance breaks for this reason.
Practical Application: The Complete S/R Trading System
Let's put it all together into a systematic approach:
1. Zone Identification (Not Lines)
- Mark areas 0.5-2% around obvious S/R levels
- Wider zones for volatile assets (crypto, growth stocks)
- Tighter zones for stable assets (forex majors, index ETFs)
2. Liquidity Analysis
- Where are obvious stop losses clustered?
- What's the volume profile within the zone?
- Any major options strikes nearby?
3. Multi-Timeframe Confirmation
- Does the zone appear on at least 2 higher timeframes?
- Any Fibonacci confluences?
- Check the CCI indicator for momentum divergence
4. Entry Execution
- Wait for liquidity sweep (spike beyond the level)
- Confirm with volume surge
- Enter on reclaim of the zone, not the first touch
5. Risk Management
- Stop beyond the liquidity sweep low/high
- Size down in low-volume markets
- Trail stops using the next lower timeframe's structure
This system forces you to think like smart money: where is liquidity trapped, and how can I position myself on the right side of its release?
Common Pitfalls and How to Avoid Them
Even with the liquidity zone method, traders make predictable errors:
Pitfall 1: Trading Every Zone
Not all S/R zones are equal. Focus on those with multi-timeframe confluence and clear liquidity imbalances. Quality over quantity.
Pitfall 2: Ignoring Context
A support zone in a strong downtrend is just a pause. Check the broader market structure before expecting major reversals.
Pitfall 3: Fixed Zones
Liquidity zones evolve. As volume accumulates at new levels, old zones lose relevance. Update your analysis regularly.
Pitfall 4: Emotional Attachment
Just because you bought at support doesn't mean it must hold. If the liquidity structure changes, adapt or exit.
The biggest pitfall? Thinking like retail when institutions are playing a different game entirely.
Advanced Concepts: Smart Money Footprints
Once you master basic liquidity zones, watch for these institutional tells:
The Accumulation Shelf: Price consolidates just above support while volume gradually increases. Smart money is absorbing supply before the next leg up.
The Distribution Ledge: Resistance holds multiple times but with decreasing volume each test. Institutions are unloading positions to eager retail buyers.
The Spring Pattern: A sharp break below support on high volume, followed by immediate recovery. This is textbook Wyckoff accumulation.
The Upthrust: The opposite — a spike above resistance that fails. Distribution is complete, markdown follows.
These patterns reveal institutional intent beyond simple support and resistance lines.
Conclusion: Think Zones, Not Lines
The era of drawing horizontal lines and hoping for the best is over. Modern markets require understanding liquidity dynamics, multi-timeframe confluence, and institutional behavior.
Support and resistance still matter — but as zones of liquidity imbalance, not magical lines. The traders who adapt to this reality profit from the liquidity that trapped traders provide.
Next time you see price approaching a key level, ask yourself: Where are traders trapped? Where are their stops? What would smart money do here?
The answer to those questions is worth more than a thousand perfectly drawn lines.
For traders ready to level up their technical analysis with institutional-grade tools, About FibAlgo offers AI-powered indicators that automatically identify high-probability liquidity zones and smart money positioning. Join our FibAlgo trading community where thousands of traders share their S/R zone analysis and learn together.
Want to dive deeper into advanced trading concepts? Explore more trading articles covering everything from market psychology to quantitative strategies.