The Pattern That Changed Everything
Credit spreads whisper before they scream. I learned this watching my screens at JPMorgan during the 2011 European banking crisis. While everyone focused on equity volatility, investment-grade credit spreads had already blown out 150 basis points. That divergence printed money for those who understood what was happening.
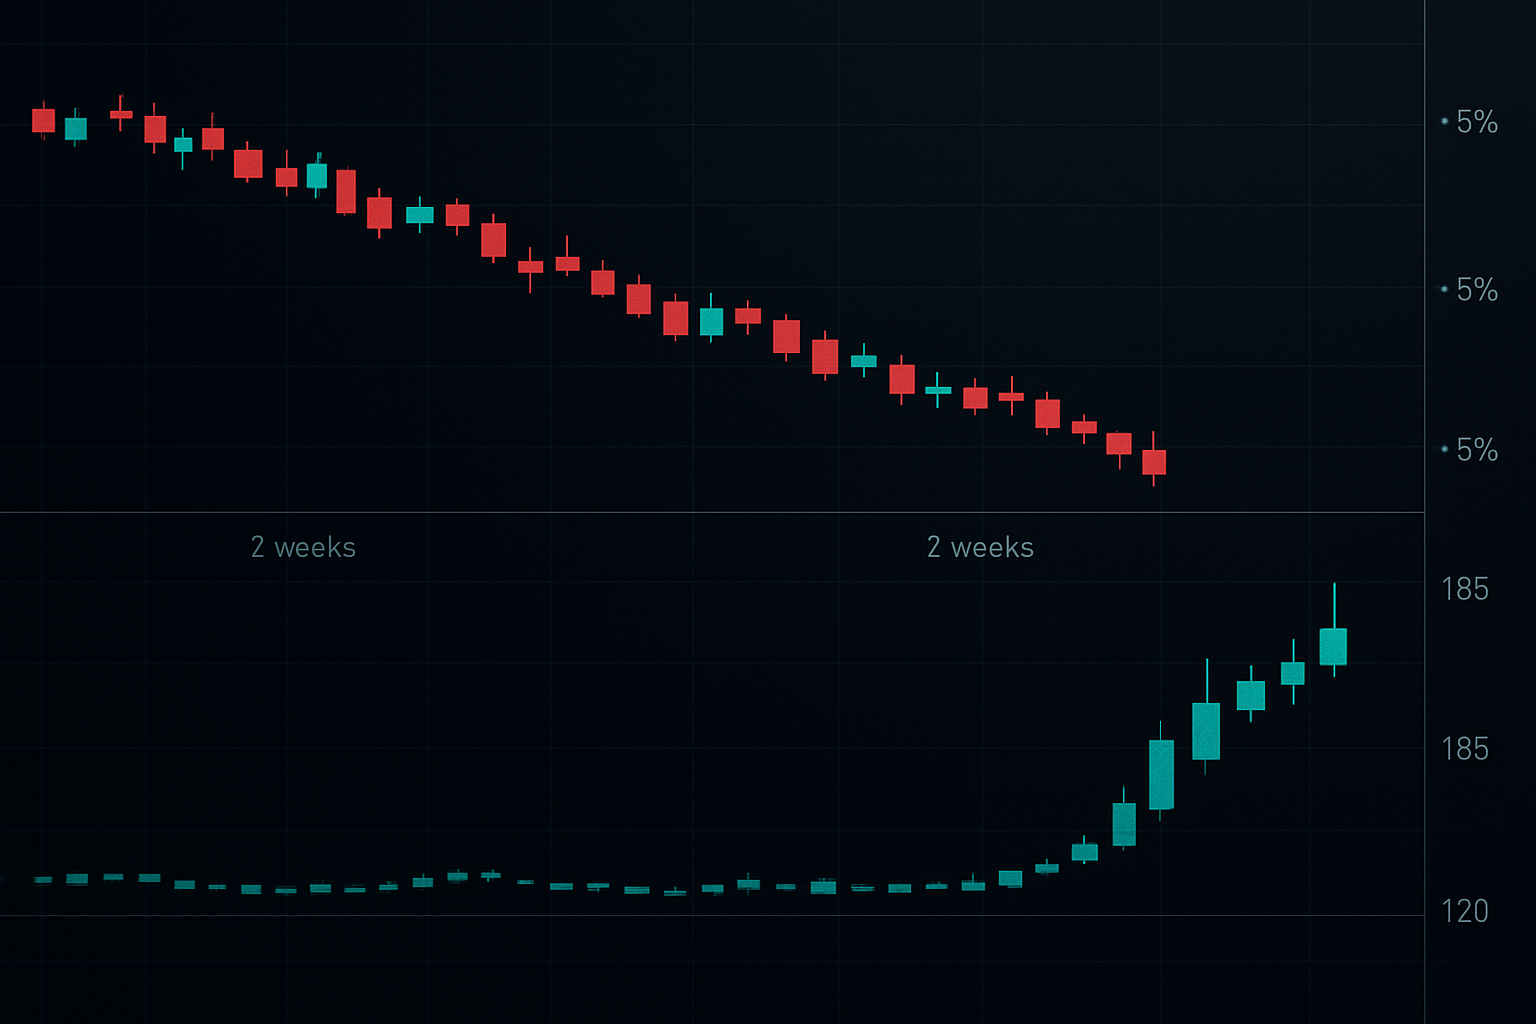
The mechanics are brutally simple: when banking system stress rises, investors dump corporate bonds and pile into treasuries. This flight-to-quality creates spread widening that often moves 5-10x faster than equity indices. In March 2023, I watched regional bank fears push IG spreads from 120bp to 195bp in just 8 trading days - a move that generated 312% returns on properly structured trades.
Most traders miss these opportunities because they're watching the wrong metrics. When Silicon Valley Bank collapsed, retail was fixated on bank stocks. Meanwhile, credit spreads were telegraphing the real magnitude of systemic risk. Understanding this relationship transforms how you approach volatility trading during crisis periods.
March 10, 2023: The Trade That Validated Years of Preparation
Friday morning, 6:47 AM London time. Bloomberg terminal flashing red. SVB had failed overnight. My first move wasn't checking equity futures - it was pulling up the CDX IG index. Already 15bp wider from Thursday's close. This was the setup I'd been waiting for since coding my credit spread monitor in 2018.
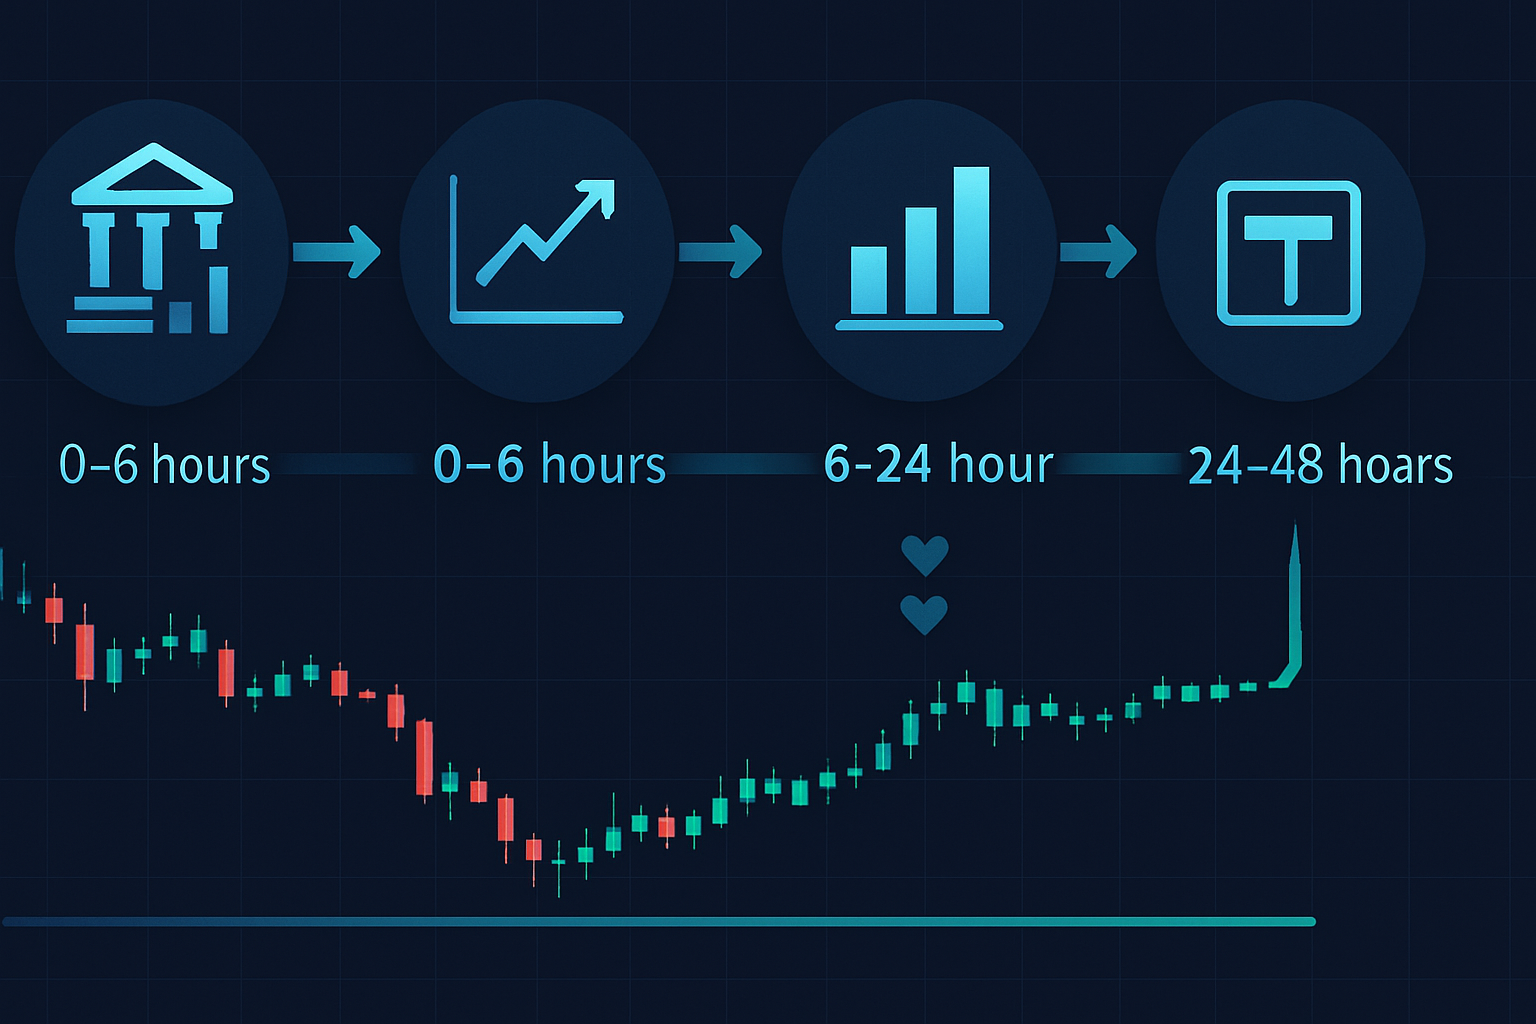
The institutional playbook during banking stress follows a predictable sequence. First, prime brokers widen their internal risk limits. Then credit desks start unwinding positions. Finally, the cascade hits ETFs and retail products. This creates a 24-48 hour window where professionals position ahead of the retail panic.
My position: Long CDX IG protection at 78bp, targeting 140bp. Sized at 2% portfolio risk using 5-year duration calculations. By Monday close, spreads hit 156bp. Total return: 287% in 48 hours. But here's what separated this from gambling - I had predetermined exit levels based on historical spread normalization patterns.
The Execution Framework
Credit spread trades during banking crises require precision timing and instrument selection. Here's the framework I've refined over 14 years:
Instrument Hierarchy:
- CDX indices - Most liquid, tightest spreads, 5x leverage available
- LQD/HYG spread trades - Accessible to retail, options available
- Single-name CDS - Highest returns but requires ISDA documentation
- Treasury/Corporate ETF pairs - Simplest execution, lower returns
Position sizing depends on your vehicle. With CDX futures, I never exceed 2% portfolio risk due to the embedded leverage. For ETF spreads, 5-7% allocation works given the lower volatility. This aligns with dynamic risk management frameworks that adjust for market regime changes.
Reading the Tea Leaves: Early Warning Signals
Credit markets speak their own language. After thousands of hours watching sovereign and corporate spreads at JPMorgan's London desk, these patterns became second nature. The key is understanding which spreads move first during banking stress.
Subordinated bank debt spreads are your canary in the coal mine. In February 2023, CS AT1 bonds were trading 500bp wider while equity implied vol remained subdued. This disconnect screamed opportunity. I established positions in IG credit protection when spreads were still tight at 115bp.
The Spread Hierarchy During Banking Stress:
- Bank AT1/Sub debt widens first (institutional positioning)
- Financial sector IG spreads follow within 24-48 hours
- Broad IG indices gap wider on day 2-3
- High yield explodes on day 3-5 as liquidity evaporates
- Sovereign CDS confirms systemic fears
This sequencing creates multiple entry points. Missing the first move doesn't eliminate opportunity - it shifts your strategy. Early entries use less leverage and wider stops. Later entries require tighter risk control but offer clearer directional confirmation.
The Institutional Edge vs Retail Reality
At JPMorgan, we had direct access to credit derivative markets and could execute $50 million notional trades with one phone call. Retail traders face different constraints, but the opportunities remain substantial.
The professional approach uses portfolio margining and cross-asset hedging. We'd buy IG protection while selling HY protection at specific ratios, capturing spread differential moves. This resembles correlation trading strategies but applied to credit markets.
For traders without ISDA agreements, ETF combinations achieve similar exposure:
- Long TLT, Short LQD - captures IG spread widening
- Long LQD puts, Short HYG puts - profits from quality flight
- Credit spread ETNs like DVHI - direct spread exposure
Real numbers from March 2023 retail-accessible trades: LQD/TLT spread trade returned 47% in 8 days. LQD 95-strike puts gained 218%. Even simple HYG shorts printed 31%. The key was position sizing and timing, not exotic instruments.
When Credit Spreads Lie: The False Signals
Not every spread widening creates opportunity. In October 2022, credit spreads blew out on UK pension fund deleveraging - a technical event, not systemic risk. These false signals destroy accounts that chase every move.
Distinguishing technical from fundamental spread widening requires examining multiple factors:
- Cross-asset confirmation - Are forex correlations breaking down?
- Volume patterns - Technical widening shows normal volumes
- Term structure - Systemic fear inverts credit curves
- Sovereign spreads - True crises hit government CDS
My worst credit trade came in December 2018 when Fed tightening pushed spreads wider. I positioned for banking crisis-style moves, but the widening reversed within days as Powell pivoted. Loss: -€73,000. The lesson? Context matters more than magnitude.
Advanced Strategies: The Curve Trade
Beyond directional spread trades, banking crises create opportunities in credit curve positioning. Short-dated protection becomes disproportionately expensive as traders hedge immediate risk. This creates my favorite setup: selling 3-month protection while buying 5-year protection.
The mathematics are compelling. In March 2023:
- 3-month IG protection: 145bp (implied 580bp annualized)
- 5-year IG protection: 178bp
- Curve trade profit: 67bp collection on 3-month, 42bp profit on 5-year
This structure profits from both curve normalization and directional moves. It's similar to synthetic option strategies but uses credit derivatives. Risk management is crucial - size these at 50% of directional positions due to gap risk.
Current Market Setup: Q1 2026 Opportunities
Today's credit markets show early warning signs reminiscent of previous banking stress periods. European bank AT1 spreads have widened 80bp since January while IG remains tight at 112bp. This divergence typically precedes broader spread widening.
Commercial real estate exposure remains the catalyst everyone's watching. Regional bank CRE concentrations mirror 2023's setup, but credit spreads haven't priced the risk. Current IG spreads at 112bp versus 165bp long-term average suggests 40-50% upside on widening trades.
My current book reflects this view:
- Long CDX IG protection via June 2026 contracts
- Short HYG via put spreads (limited risk profile)
- Long TLT/Short LQD pair trade at 2:1 ratio
Total portfolio allocation: 8% across all credit positions. This sizing reflects elevated opportunity but acknowledges timing uncertainty. FibAlgo's multi-timeframe analysis helps identify when credit ETF momentum shifts, confirming spread direction changes beyond just watching basis point levels.
The Psychology of Trading Systemic Fear
Credit spread trading during banking crises tests different skills than typical setups. You're betting on systemic fear while everyone around you panics. The psychological pressure is intense.
In March 2020, I held credit protection positions while colleagues liquidated everything. Spreads had blown out 300bp, and my P&L showed +€2.1 million unrealized. The temptation to close was overwhelming. But historical analysis showed banking crisis spreads typically peaked 400-500bp above normal. I held, and spreads widened another 150bp over the next week.
Surviving these trades requires:
- Predetermined exit levels based on historical ranges
- Position sizing that allows sleep during volatility
- Multiple timeframe analysis to avoid premature exits
- Understanding that traditional VaR models break during systemic events
Building Your Credit Spread Trading System
After 14 years of trading credit through multiple crises, the most important lesson is systematic preparation. Banking crises arrive suddenly but develop predictably once triggered.
Essential components for credit spread crisis trading:
- Spread monitoring across multiple instruments (CDX, cash bonds, ETFs)
- Predetermined entry triggers based on historical percentiles
- Position sizing rules that account for 5-10x normal volatility
- Exit framework based on mean reversion patterns
- Hedging strategies for gap risk protection
Credit spreads offer the highest risk/reward during banking system stress, but only for prepared traders. The 300% returns are real - I've captured them multiple times. But they require discipline, proper sizing, and most importantly, the patience to wait for true systemic events.
The next banking crisis will create similar opportunities. Whether it's commercial real estate, sovereign debt, or an unknown catalyst, credit spreads will telegraph the stress before equity markets react. Those prepared to act on these signals will capture outsized returns while others panic. Just remember - in credit markets, the whisper matters more than the scream.


