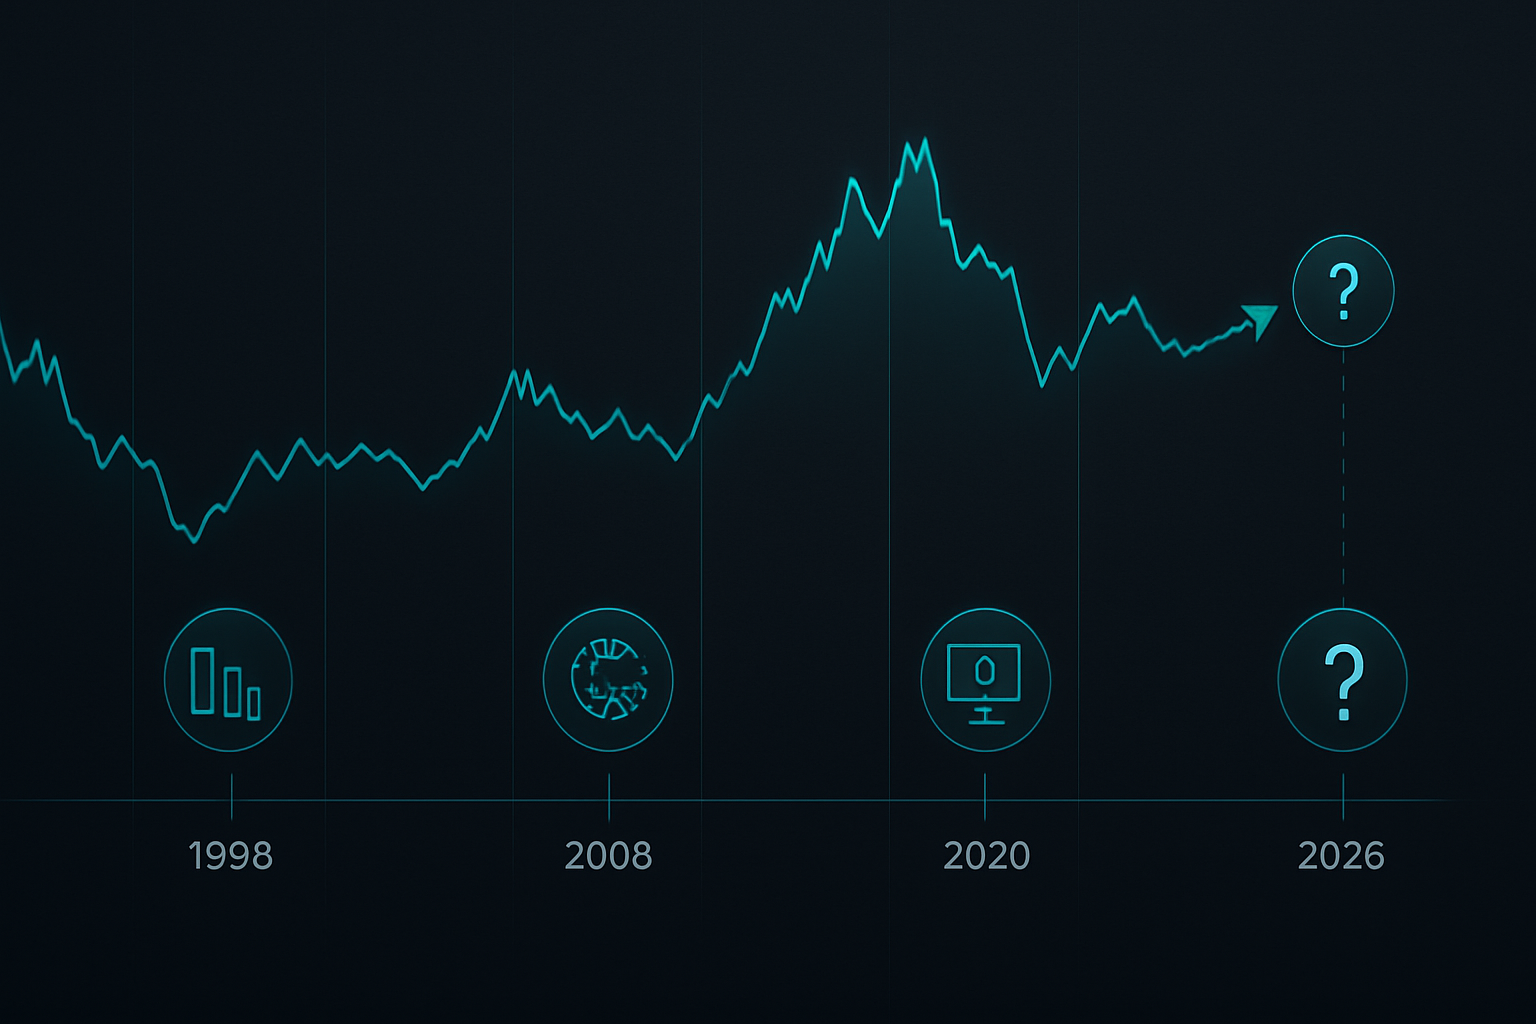
September 15, 2008: When Lehman Fell, So Did My Trading System
I was three years into my FX trading career at JPMorgan when Lehman Brothers collapsed. My mean reversion system had printed money for 18 months straight — until that Monday morning. By noon, I'd blown through six months of profits. Not because the strategy was wrong, but because I'd never stress tested it against a true liquidity crisis.
That day changed how I approach trading strategy stress testing. Over the next 14 years, I'd live through COVID's circuit breakers and Silicon Valley Bank's overnight implosion. Each crisis exposed different fatal flaws that no amount of normal backtesting would have caught.
Here's what those three crises taught me about the hidden weaknesses in every trading system — and the stress testing framework that's kept me profitable through each one.
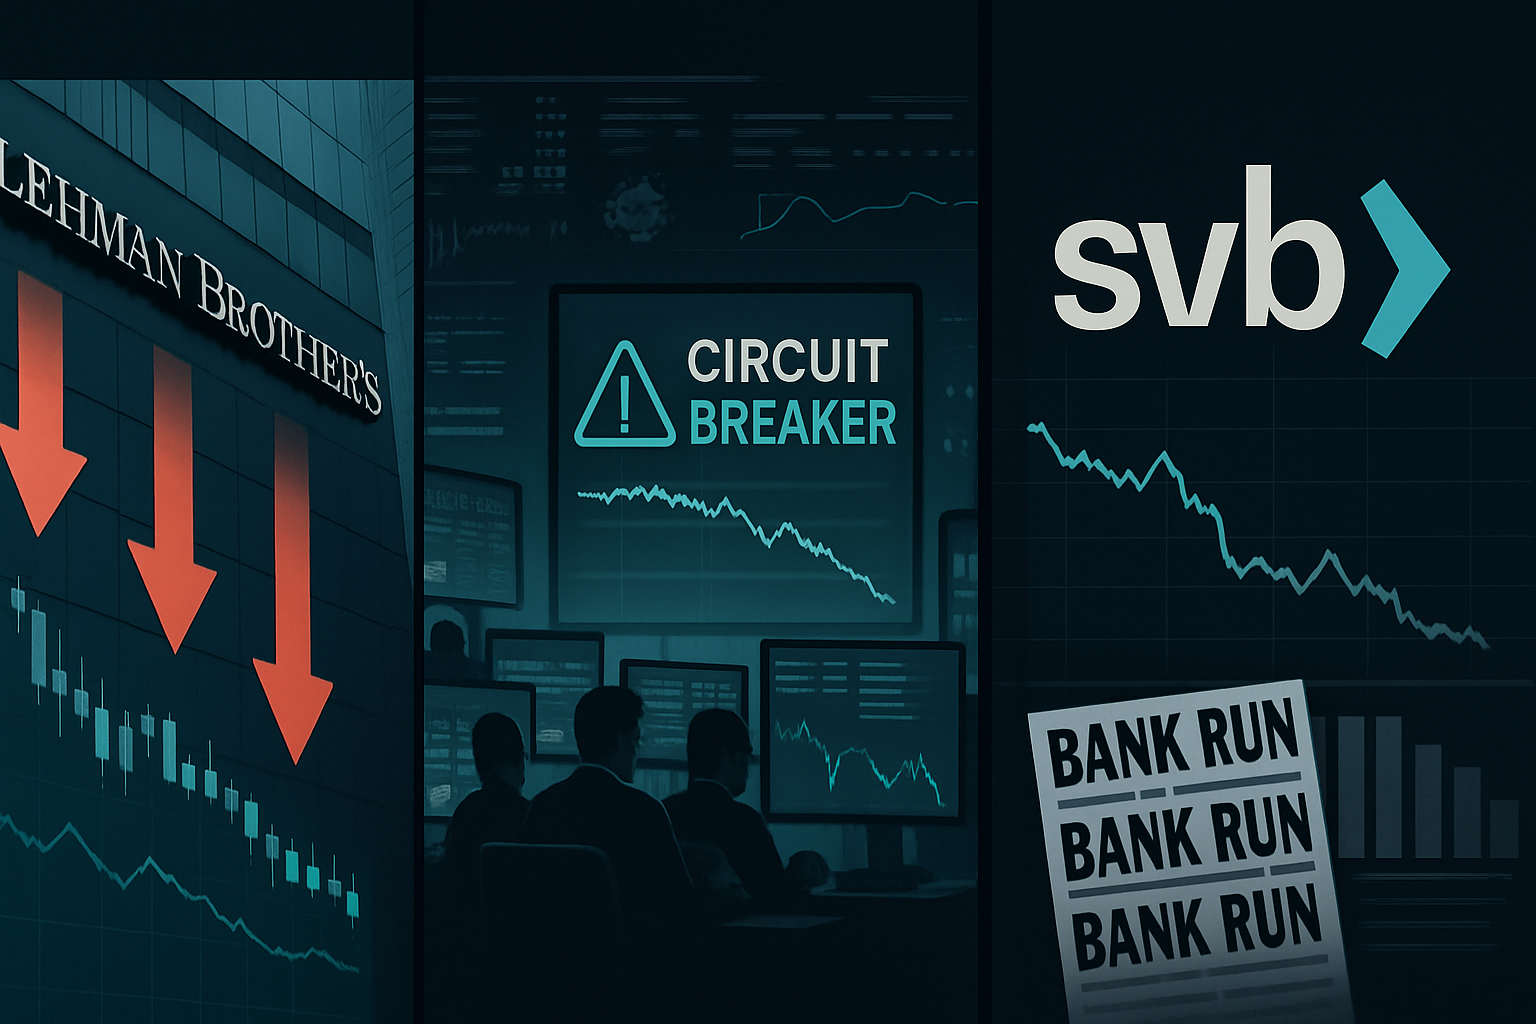
Crisis #1: The 2008 Correlation Breakdown That Nobody Saw Coming
My EUR/USD mean reversion system was elegantly simple: fade moves beyond 2 standard deviations when correlated pairs confirmed. It worked brilliantly — until correlations went to 1.0 across the board during Lehman week.
The fatal flaw? My system assumed historical correlations would hold during stress. When every currency pair started moving in lockstep (USD strength across the board), my hedged positions became directional disasters.
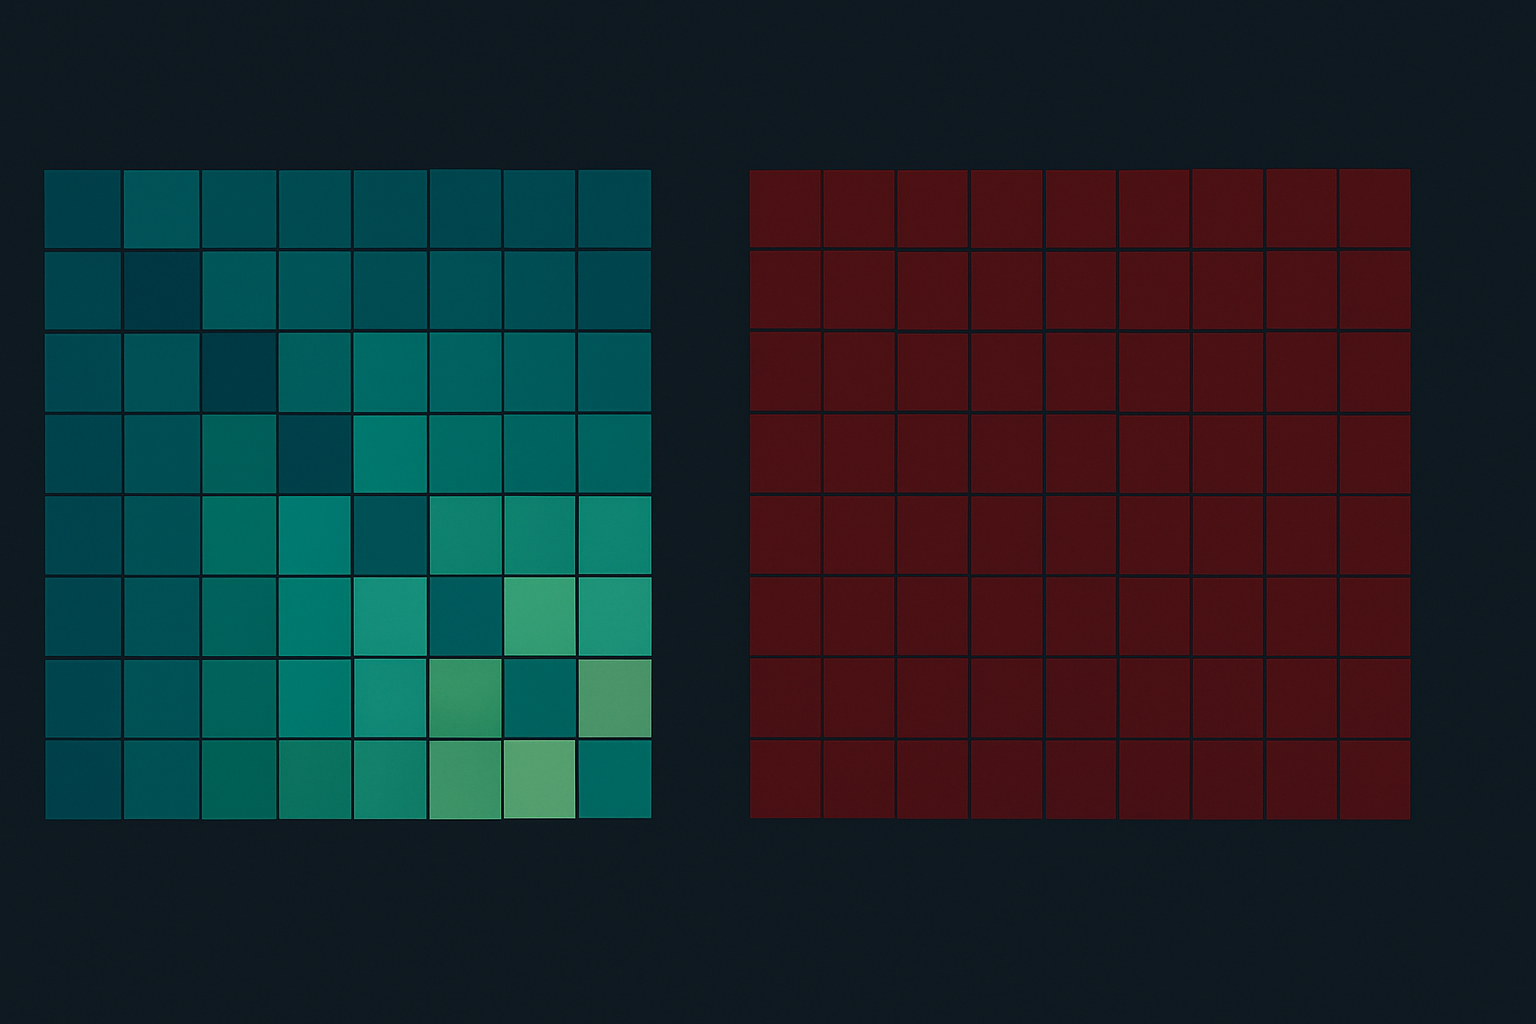
Here's what the correlation matrix looked like:
- Pre-crisis: EUR/USD vs GBP/USD correlation = 0.72
- September 15-19: Correlation = 0.94
- EUR/JPY vs USD/JPY: From 0.45 to 0.89
The lesson hit hard when I analyzed my correlation trading assumptions. Systems built on stable relationships will implode when fear makes everything move together.
What saved my career was implementing dynamic correlation monitoring. Instead of using 90-day correlations, I now track 5-day, 20-day, and 90-day simultaneously. When short-term correlations spike above 0.85 across multiple pairs, I cut position sizes by 70%.
Crisis #2: COVID's Liquidity Vacuum Exposed My Execution Assumptions
Fast forward to March 12, 2020. I'm now running a more sophisticated strategy incorporating volume profile analysis and multiple timeframes. The system had survived the 2008 stress test. It was about to face a completely different beast.
At 9:47 AM, S&P futures hit limit down. My system triggered a buy signal — textbook oversold bounce setup. The problem? There was literally no liquidity to execute. Spreads on EUR/USD went from 0.1 pips to 15 pips. My "guaranteed" stop losses were worthless.
The fatal flaw this time: assuming normal market microstructure during extreme volatility. My backtests used mid-prices and ignored spread widening, slippage during circuit breakers, and complete liquidity evaporation.
The numbers were sobering:
- Normal EUR/USD spread: 0.1-0.2 pips
- March 12, 2020 peak spread: 25 pips
- Slippage on a standard 100k position: $2,500 vs expected $20
Now I stress test with what I call "nuclear spread scenarios":
- Multiply normal spreads by 50x during crisis periods
- Add 20-50 pip slippage to all stop losses
- Assume 30% of trades simply won't execute at limit prices
This realistic modeling would have shown my "profitable" COVID bounce trade was actually a guaranteed loss after execution costs.
Crisis #3: Silicon Valley Bank — When Sector Contagion Breaks Everything
March 10, 2023, taught me the newest lesson. My systems had evolved to handle correlation breakdowns and liquidity crises. But SVB's collapse revealed a third fatal flaw: sector contagion modeling.
I was long regional bank stocks through XLF options, hedged with short positions in treasuries (betting on continued rate hikes). When SVB failed, regional banks cratered while treasuries mooned — a double loss on what should have been a hedged position.
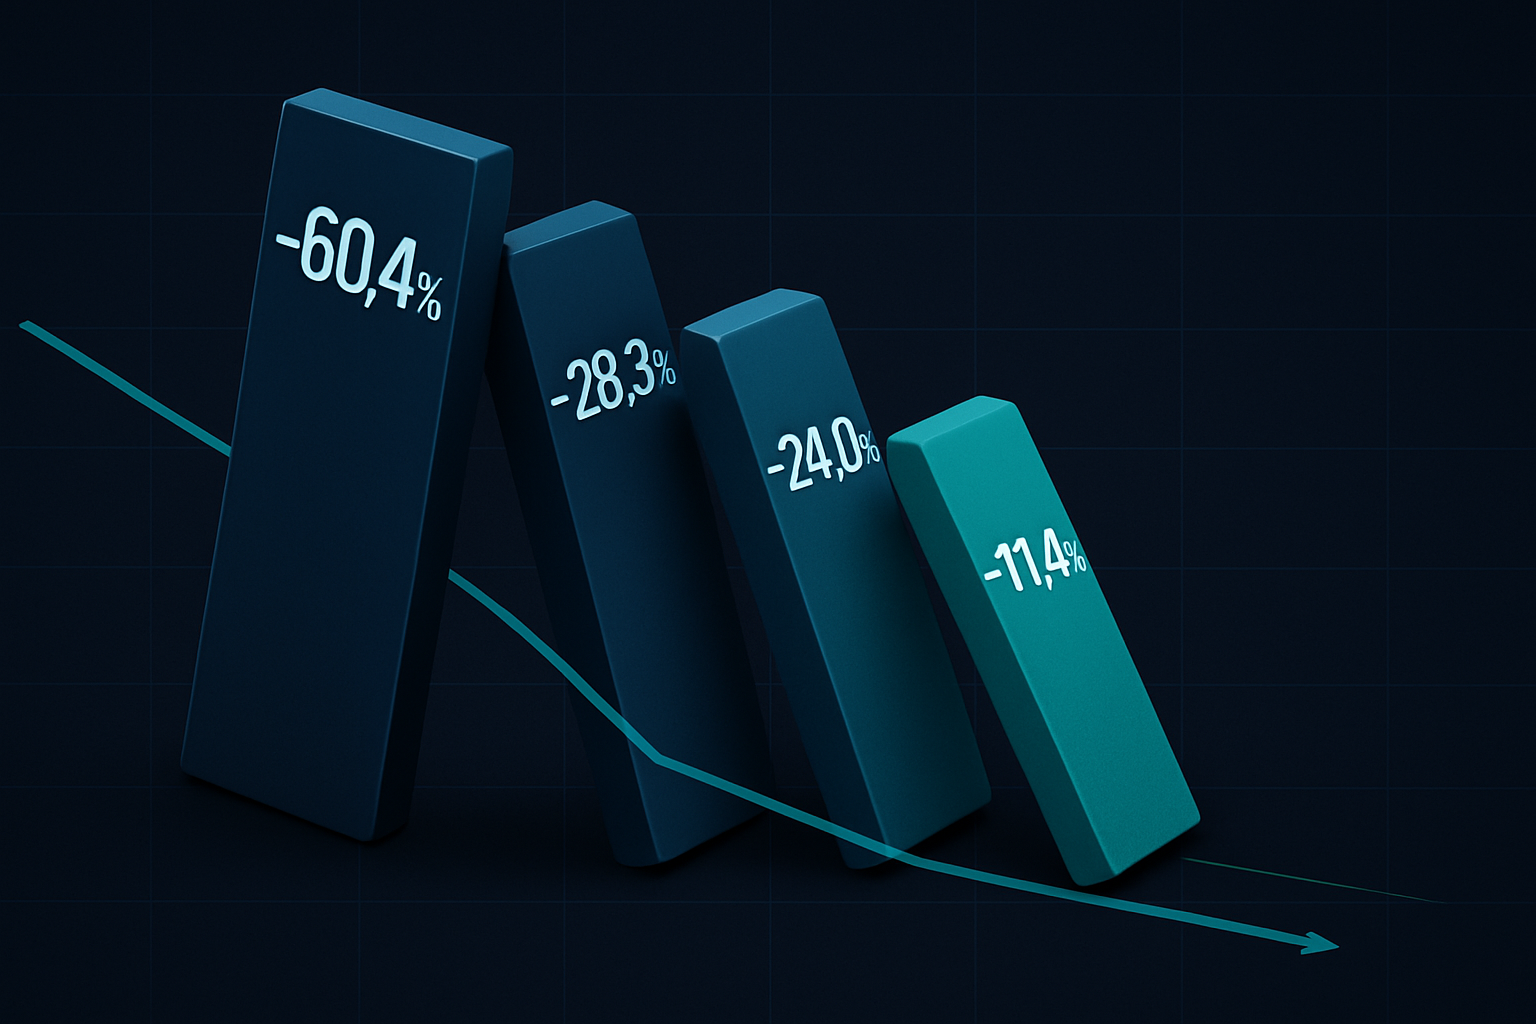
The killer was the speed of contagion:
- Day 1: SVB down 60%
- Day 2: First Republic down 50%, Western Alliance down 45%
- Day 3: Entire KRE regional bank ETF down 25%
My options flow analysis had actually caught the unusual put buying in SIVB. But my system didn't connect single-stock distress to sector-wide contagion risk.
The fix was implementing contagion scenarios in stress testing:
- If any sector component drops >40% in a day, model 20-30% declines across the sector
- Assume correlations go to 0.9+ within sectors during distress
- Factor in reflexive feedback loops (selling begets selling)
The Modern Stress Testing Framework
After living through these three crises, here's the comprehensive stress testing framework I now use quarterly:
1. Correlation Stress Scenarios
- Force all correlations to 0.9 (everything moves together)
- Force all correlations to -0.9 (relationships invert)
- Test random correlation matrix reshuffling
2. Liquidity Evaporation Modeling
- 50x spread widening on all instruments
- 30-50% position slippage on stops
- Complete inability to exit for 1-3 days
3. Contagion Cascade Testing
- Single name blow-ups spreading to sectors
- Cross-asset contagion (equities to bonds to currencies)
- Geographic contagion (US to Europe to Asia)
4. Operational Failure Scenarios
- Exchange outages (like Nasdaq during Facebook IPO)
- Broker failures (remember MF Global?)
- Technology stack failures during peak volatility
Each scenario gets tested against 20-day, 5-day, and intraday crisis periods. If the strategy can't survive with reasonable drawdowns, it doesn't trade with real money.
The Uncomfortable Truth About Backtesting
Here's what 14 years of crisis trading taught me: traditional backtesting is dangerously incomplete. It assumes:
- You can execute at historical prices (you can't during crises)
- Correlations remain stable (they don't when fear spikes)
- Your broker/exchange stays operational (often false)
- Stop losses work as advertised (20-50% slippage is common)
The risk management frameworks that look bulletproof in backtests often shatter on first contact with real crisis conditions.
Real stress testing means modeling the market microstructure breakdowns, not just price movements. It means assuming your hedges will fail precisely when you need them most. It means accepting that your 15% max drawdown might become 40% overnight.
Practical Implementation Guide
Start with these specific steps this week:
Step 1: Download crisis period data
- September 15-30, 2008 (Lehman collapse)
- March 9-23, 2020 (COVID crash)
- March 8-15, 2023 (SVB failure)
- August 24, 2015 (Flash crash)
- May 6, 2010 (Original flash crash)
Step 2: Modify your backtest engine
- Add spread widening multipliers (start with 10x, 25x, 50x)
- Implement slippage models (2%, 5%, 10% of position size)
- Code correlation override functions
- Add "no execution" scenarios for limit orders
Step 3: Run your current strategy through each crisis
- Document max drawdown with realistic execution
- Note which assumptions broke first
- Calculate recovery time from drawdowns
- Identify common failure patterns
Step 4: Implement circuit breakers
- Correlation-based position size reduction
- Volatility-based leverage limits
- Sector exposure caps
- Daily loss limits that actually stick
For automated stress testing, FibAlgo's risk analysis tools can help identify vulnerability zones in your strategy before the next crisis hits.
The Crises You Haven't Seen Yet
We've stress tested against past crises, but what about future ones? Here are scenarios I'm now modeling:
- Stablecoin systemic failure: What if USDT loses its peg during a crisis?
- AI-driven flash crash: Algorithms triggering cascading stops in milliseconds
- Cryptocurrency exchange insolvency: FTX was just the beginning
- Central bank digital currency launch: Massive FX regime changes overnight
- Cyber attack on financial infrastructure: Markets frozen for days
Each requires different stress testing parameters. The stablecoin depeg scenarios I model assume 20-40% discounts and multi-day recovery periods.
The Bottom Line on Crisis-Proof Trading
After shepherding capital through three major crises, one truth stands out: the strategy that survives isn't the most profitable one — it's the most robust one.
Every system I've built since 2008 must pass the three-crisis test:
- Can it survive correlation breakdown? (2008 test)
- Can it handle liquidity evaporation? (COVID test)
- Can it withstand sector contagion? (SVB test)
Most can't. The ones that do typically show 30-40% lower returns in normal markets. That's the price of crisis survival — and it's worth every foregone percentage point when the next black swan lands.
Remember: markets can stay irrational longer than you can stay solvent. But with proper stress testing, you can stay solvent through anything the market throws at you.
The next crisis is coming. It always is. The question is: will your trading system survive it?