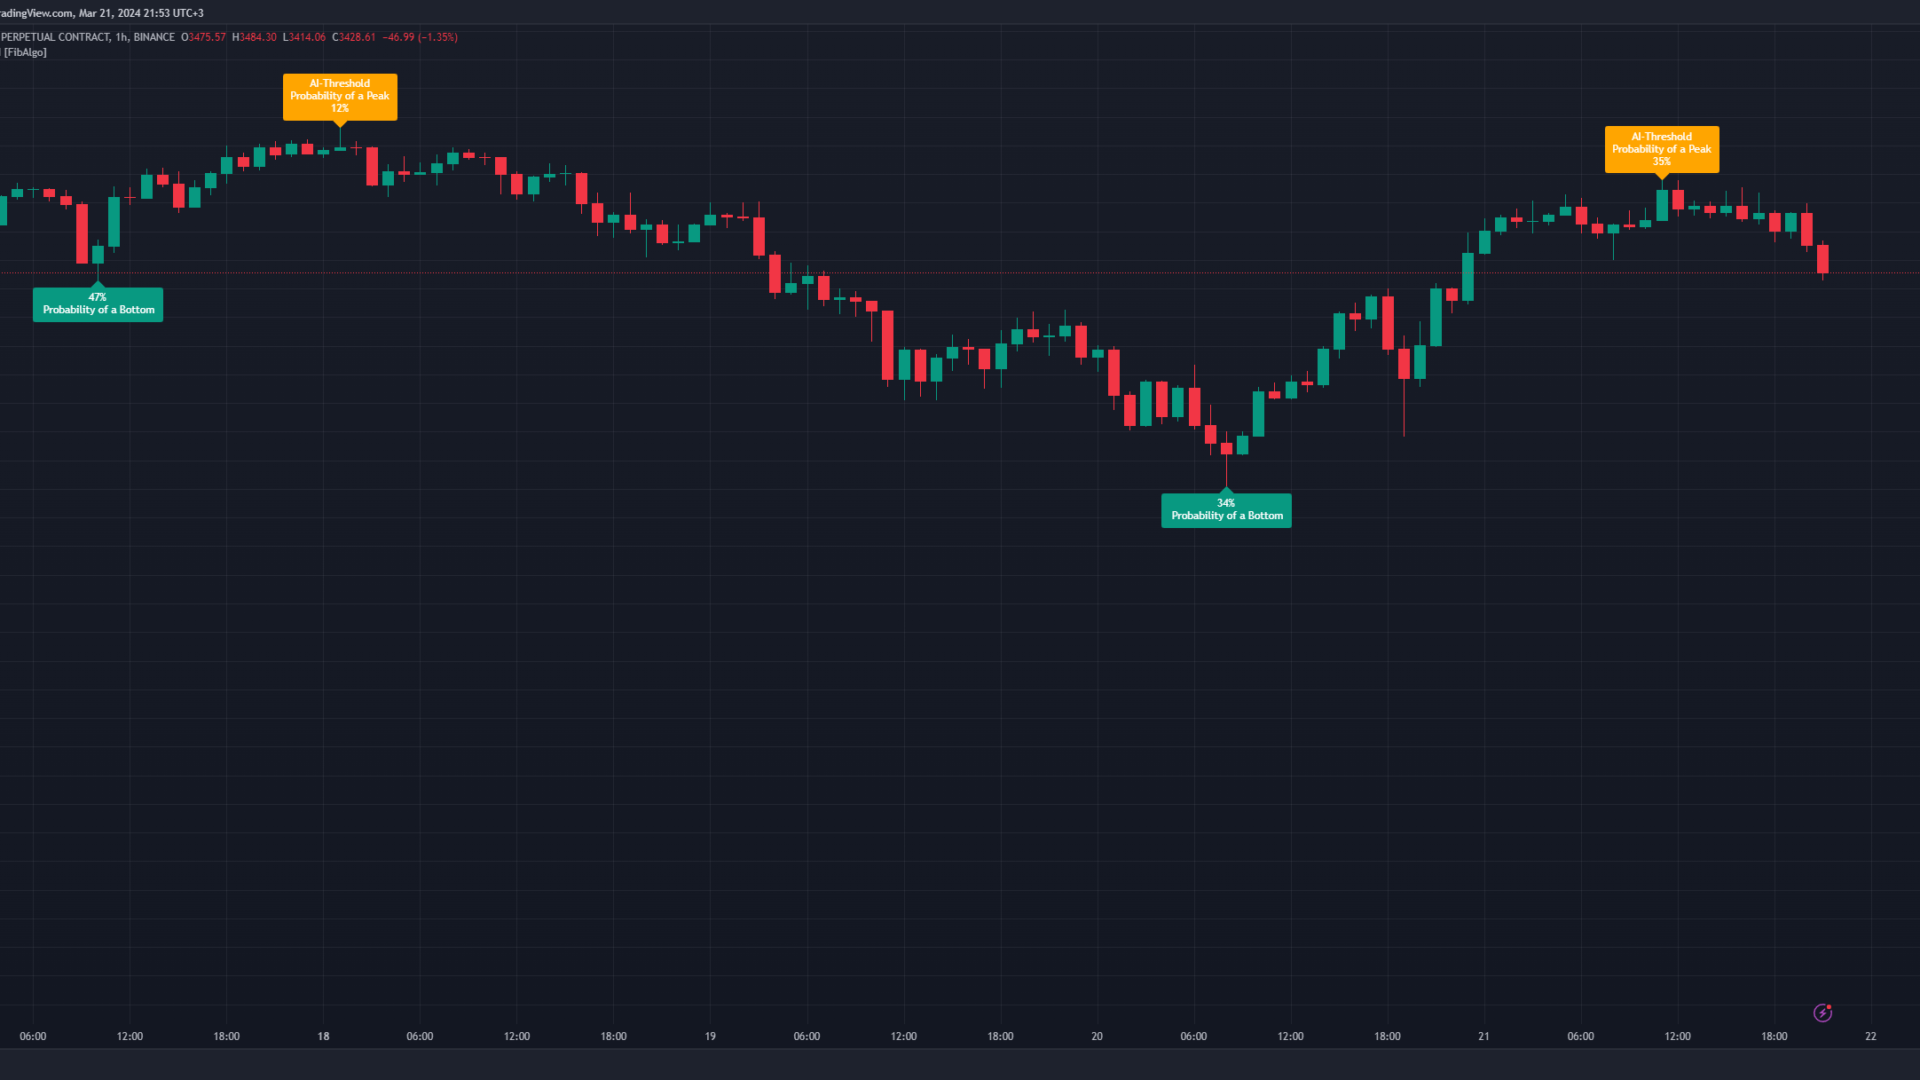
High and Low
What Is It?
- High and Low is a technical analysis indicator that combines various indicators to generate possible turn signals. Below is a simple explanation of the key components of this indicator.
How It Works?
- Utilization of Momentum Oscillators: Initially, the indicator relies on momentum oscillators. These oscillators measure the speed and change of prices, assessing the strength of an asset's trend. The most commonly used momentum oscillators include the Relative Strength Index (RSI) and the Stochastic Oscillator.
- Evaluation of Highest and Lowest Levels: The indicator analyzes the historical highest and lowest levels of an asset. These data provide crucial insights into the range in which the price of the asset may fluctuate.
- Usage of Bollinger Bands: In the analysis process, Bollinger Bands come into play. These bands establish the typical price range of an asset and assist in predicting the direction of the trend. There are three fundamental bands: the upper band, the middle band, and the lower band.
- ADX Indicator and Trend Strength: The indicator utilizes the Average Directional Index (ADX) to assess the strength of the trend. ADX is a technical indicator used to determine the strength of a trend in an asset. A high ADX value may indicate a strong trend.
- Strength of Reversal Signal:Finally, the indicator determines the strength of the reversal signal based on the strength of the trend. If the trend is very strong, the reversal signal will also be strong. This provides investors with a guide to assess the likelihood of the asset giving a potential reversal signal.
- In this manner, the indicator utilizes both momentum oscillators and Bollinger Bands to identify the trend, evaluates the strength of the trend using the ADX indicator, and provides information about the potential strength of a reversal signal.
Trade Types
Scalp Trading: Shorten the spacing of the volatility bands of the Bollinger Bands and get more precise reversal signals.
Day Trading: Changes the spacing of the volatility bands of the Bollinger Bands to normal settings and you get more probable signals.
Position Trading: Opens the spacing of the volatility bands of the Bollinger Bands and you get signals that you can think longer term.
Trend Analysis
Fast: Decreases the moving average of the momentum oscillator and you get more precise signals.
Normal: Set the moving average of the Momentum oscillator to default and get more stable signals.
Slow: Decreases the moving average of the Momentum oscillator and you get slower but possible signals.
How to use
- With "Trade Types" you can get signals according to your trading style. These signals can be amplified or refined. It allows you to see more or possible signals. It can be adjusted by timeframe.
- Trend Analysis measures momentum for you and generates reversal signals accordingly. This setting is used entirely for measuring trend and momentum.
- You can wait for the buy signal for Buy / Long.
- You can wait for the sell signal to be Sell/Short.
- You can trade for consecutive signals.
