I Used to Hunt Your Stop Losses for a Living
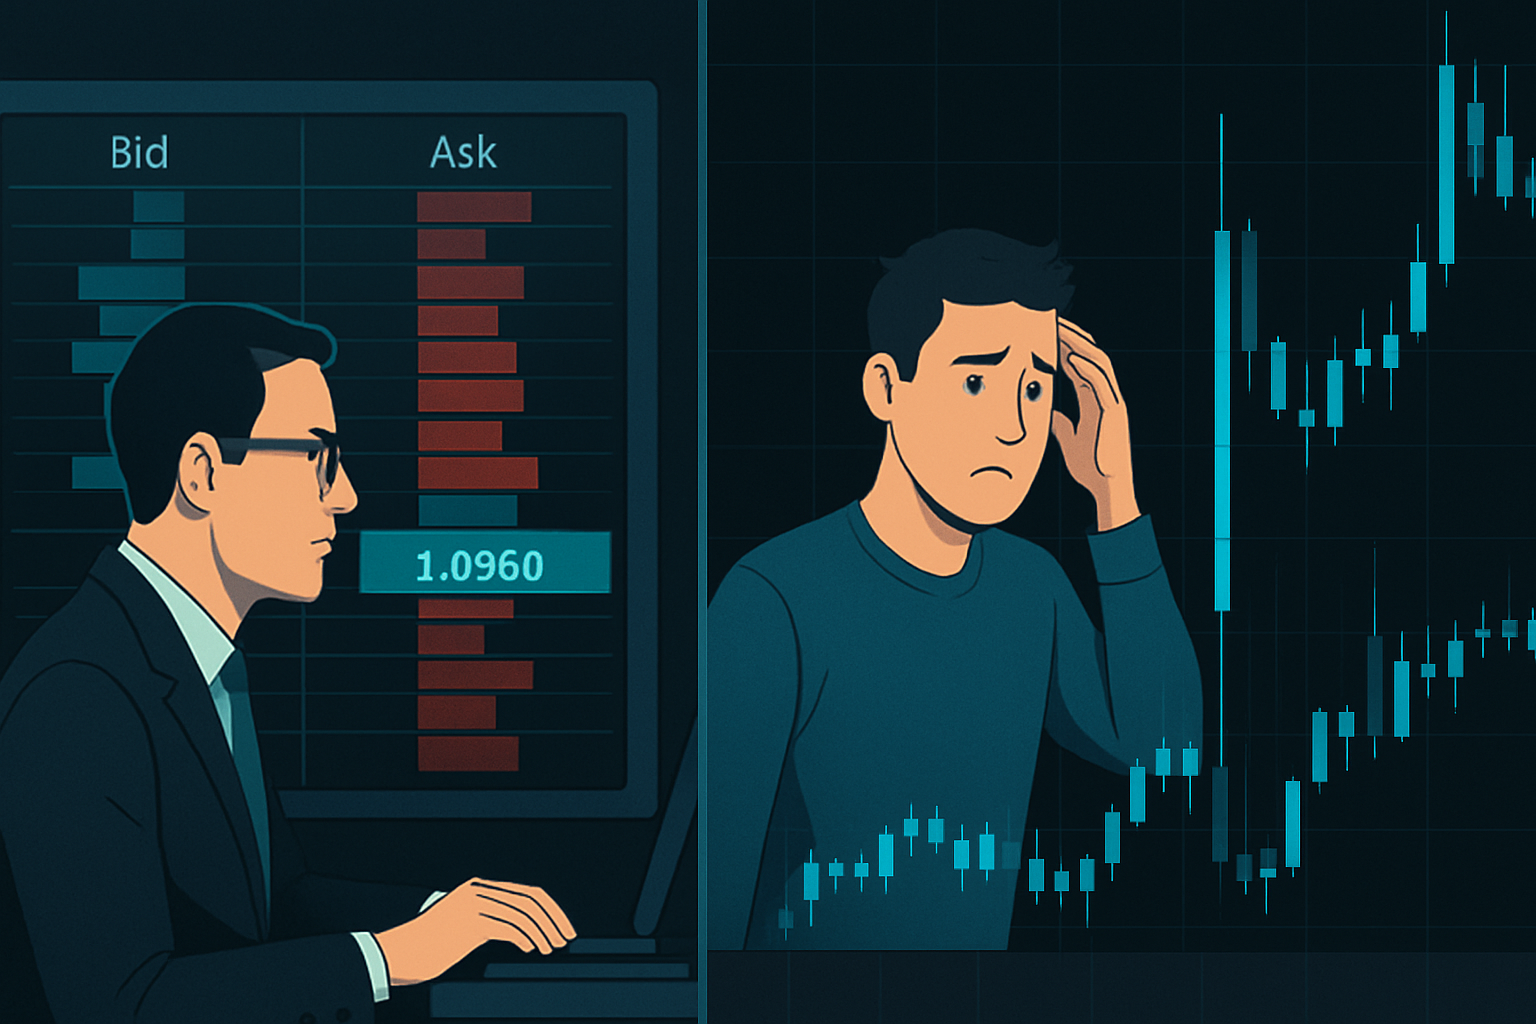
For six years on the JPMorgan FX desk, I executed trades that would make retail traders throw their monitors out the window. We called them "liquidity grabs" — you called them stop hunts. And yes, they were exactly what you think they were.
Every morning at 7:45 AM London time, I'd scan our order book. Not for trends or patterns, but for clusters of retail stop losses sitting just beyond obvious support and resistance levels. Those stops were our breakfast.
The institutional forex market moves $7.5 trillion daily, according to the Bank for International Settlements. When a hedge fund needs to fill a €500 million EUR/USD order, they can't just market buy — the slippage would destroy their entry. They need liquidity. Your stops provide that liquidity.
Here's what most retail traders don't understand: market maker manipulation patterns aren't random acts of greed. They're systematic, predictable, and — once you understand them — tradeable. After leaving the institutional side, I've spent eight years trading these same patterns from the retail side. The hunter became the hunted, but I learned to hunt alongside the hunters.
In this article, I'm breaking down the four manipulation patterns we used most frequently, how to spot them forming, and most importantly — how to position yourself on the right side of the hunt.
Pattern #1: The Classic Stop Hunt (The 20-Pip Sweep)
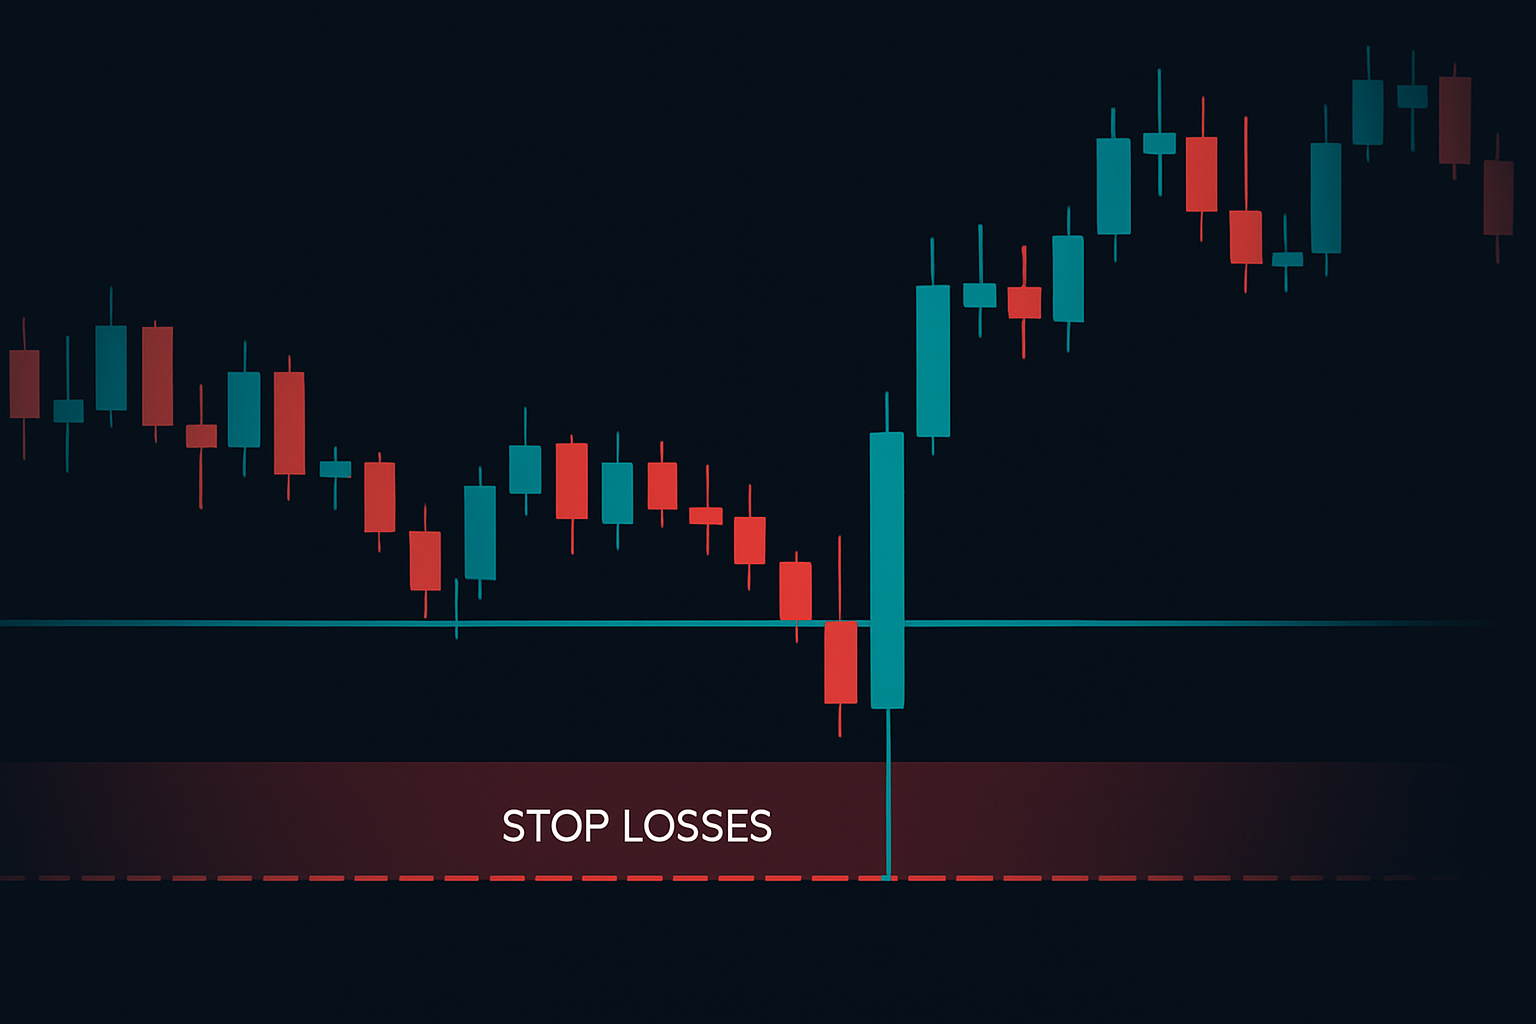
This was our bread and butter at JPMorgan. We'd identified that retail traders consistently placed stops 15-20 pips beyond obvious support and resistance levels. Like clockwork.
Here's exactly how we'd execute it on EUR/USD:
- Step 1: Identify a major support level, say 1.0950, with at least 3 touches over the past week
- Step 2: Our order book shows stop loss clusters at 1.0930-1.0935
- Step 3: During low liquidity (usually 2-4 AM EST), we'd sell aggressively to push price through support
- Step 4: Stops trigger, providing us liquidity to fill our actual buy orders
- Step 5: Price reverses violently back above 1.0950 within 5-15 minutes
The beauty of this pattern? It leaves a specific footprint on the chart. Look for these characteristics:
- Quick spike through support/resistance during low-volume periods
- Immediate reversal with increased volume
- Wick that extends 15-25 pips beyond the level
- Often occurs in the hour before London open or during the Asian session
I watched this pattern play out on GBP/USD just last Tuesday. Cable sat at 1.2600 support all day. At 2:37 AM EST, a sudden 22-pip drop to 1.2578, triggering retail stops, followed by an immediate reversal to 1.2625. Classic stop hunt.
To trade this pattern, I wait for the sweep to complete, then enter on the reversal confirmation — usually a strong rejection candle with volume. My stop goes below the hunt low, targeting the pre-hunt resistance level.
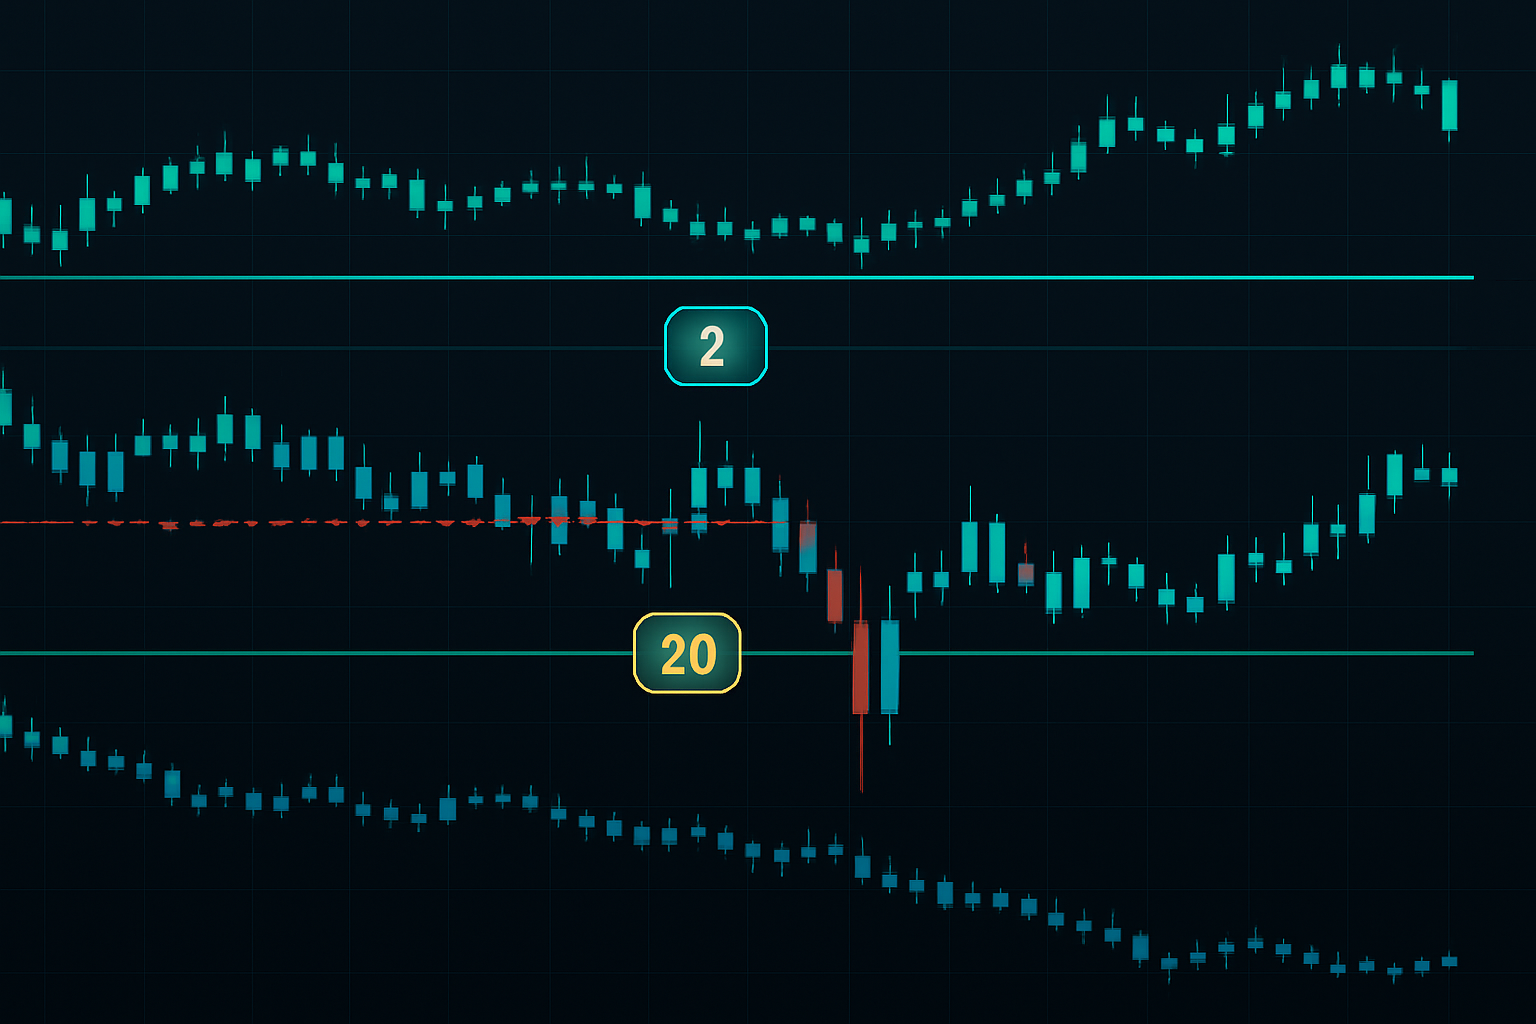
Pattern #2: The Fake Breakout Flush
This manipulation pattern preys on breakout traders — and it's devastatingly effective. At JPMorgan, we knew retail traders loved buying breakouts of ranging markets. So we gave them breakouts... temporarily.
The setup works like this: After a clear ranging market (at least 3-4 days), price approaches the range high. Retail traders have buy stops above the range, expecting a breakout. Here's where the manipulation begins.
We'd push price just beyond the range high — typically 10-15 pips — triggering those buy stops. But instead of continuing higher, we'd immediately dump our inventory into that retail buying, sending price crashing back into the range. The breakout buyers become instant bag holders.
I call this "The Flush" because it flushes out weak positions before the real move. Often, the market will consolidate for another 4-8 hours, then break out in the opposite direction.
Last month on USD/CAD, I watched this exact pattern unfold. The pair ranged between 1.3950-1.4000 for three days. On Thursday's New York open, price spiked to 1.4015, triggering breakout buyers. Within 30 minutes, it crashed back to 1.3960. The next day? Broke down through 1.3950 and ran to 1.3880.
The key tells for this pattern:
- Clear range with multiple touches of support/resistance
- Breakout occurs on lower than average volume
- No fundamental catalyst for the breakout
- Immediate selling/buying pressure after breakout
- Often happens 30-60 minutes before major sessions
My approach: I never trade the initial breakout. I wait for the flush back into the range, then position for the real move in the opposite direction. This pattern has about a 73% success rate when all conditions align.
Pattern #3: The Spread Manipulation Squeeze
This one's dirty, but it happens more than you'd think — especially in minor pairs and during news events. Market makers widen spreads to force traders out of positions or prevent them from entering at optimal levels.
During my desk days, I watched this happen repeatedly around Non-Farm Payrolls. Here's the playbook:
- T-minus 60 seconds: Spreads start widening from 1 pip to 5-10 pips
- T-minus 30 seconds: Spreads hit 15-20 pips, stops start triggering
- News release: Spreads go astronomical (30-50 pips)
- T-plus 30 seconds: Spreads normalize, but damage is done
The manipulation isn't just the wide spreads — it's what happens in that window. Price often spikes in both directions, taking out stops on both sides before settling into the real directional move.
But here's what most traders miss: The spread manipulation creates a tradeable opportunity. When spreads normalize, there's often a 20-30 pip move in the direction of the fundamental news that got obscured by the initial chaos.
I track spread widening on my platform (most professional platforms show real-time spread data). When I see abnormal widening without news, it's often preceding a significant move. The market makers are positioning themselves before something happens.
For minor pairs like EUR/NZD or GBP/CAD, spread manipulation happens during the Asian session when liquidity is thin. I've seen spreads go from 3 pips to 25 pips in seconds, stop out traders, then return to normal as if nothing happened.
Pattern #4: The Time-Based Liquidity Trap
This pattern took me years to fully understand, even from the institutional side. It's based on the fact that certain times of day have predictable order flow, and market makers exploit this.
The most obvious example is the London Fix at 4 PM GMT. Every fund manager who needs to benchmark their performance to the WM/Reuters rate has to trade around this time. Market makers know this and position accordingly.
Here's what happens:
- 3:30 PM GMT: Market makers start accumulating positions opposite to expected fix flow
- 3:45 PM GMT: Price starts moving against the expected direction, triggering retail stops
- 3:55 PM GMT: Maximum pain point — retail traders capitulate
- 4:00 PM GMT: Actual fix orders come in, price reverses violently
- 4:05 PM GMT: Market makers unwind positions into the fix flow
I've seen EUR/USD move 40 pips in the 30 minutes around the fix, only to reverse the entire move in the next 30 minutes. It's not random — it's engineered liquidity generation.
Other time-based traps occur at:
- Tokyo open (7 PM EST) — USD/JPY manipulation
- European equity open (3 AM EST) — EUR crosses
- NYSE open (9:30 AM EST) — Dollar index plays
- Options expiry (10 AM EST) — Major pairs pinning
Last week, I caught a beautiful time-based trap on AUD/USD. At 6:55 PM EST (5 minutes before Tokyo open), the pair dropped 25 pips from 0.6550 to 0.6525, stopping out longs. At exactly 7:00 PM, massive buying emerged, pushing it to 0.6580 within an hour. The pattern is like a Swiss watch.
How to Spot Manipulation Patterns in Real-Time
After years on both sides of these trades, I've developed a checklist for identifying manipulation as it happens:
- Volume Discrepancy: Big price moves on low volume = manipulation likely
- Time of Day: Off-hours moves that reverse during main sessions
- Speed of Move: Manipulation moves are violent and quick (under 5 minutes)
- Lack of Catalyst: No news or fundamental reason for the move
- Technical Level Proximity: Always happens near obvious support/resistance
- Spread Behavior: Abnormal spread widening preceding the move
I also monitor order flow tools when available. The order flow imbalances during manipulation events are extreme — often 10:1 or higher on one side, followed by an immediate reversal.
But here's the crucial part: Don't try to predict manipulation. Wait for it to happen, then trade the reaction. The money isn't in catching the manipulation move — it's in trading the reversal when real order flow returns.
Trading Alongside the Manipulation
Here's the mindset shift that transformed my trading: Stop fighting market makers and start thinking like them. They need liquidity. You can provide it — or you can wait until they've got it and trade alongside them.
My current approach focuses on three strategies:
Strategy 1: The Reversal Fade
Wait for obvious stop hunts, then enter on the reversal. I use a 2:1 reward-to-risk minimum, placing my stop beyond the hunt extreme. Win rate: approximately 67%.
Strategy 2: The Second Mouse
Let the first breakout fail (the manipulation), then enter on the second attempt. As they say, the second mouse gets the cheese. This works especially well on filtered breakout strategies.
Strategy 3: The Time Trap
Trade the predictable time-based reversals. I have alerts set for all major fixing times and session opens. Enter after the manipulation completes, ride the real flow.
Risk management is crucial when trading around manipulation. I never risk more than 0.5% per trade on these setups because occasionally, what looks like manipulation is actually genuine order flow. The key is consistency over time, not hitting home runs.
I also use wider stops than normal — typically 1.5x my usual stop distance. Manipulation moves are violent, and you need room to breathe. Nothing worse than being right about the direction but getting stopped out by the volatility.
The Technology Edge
Modern trading platforms give retail traders tools we could only dream of on the institutional desk. I use several indicators to track potential manipulation:
- Volume Profile: Shows where stops likely cluster
- Market Depth: Reveals order book imbalances
- Spread Monitor: Tracks abnormal widening
- Time-based Alerts: Notifications for manipulation-prone periods
For traders using TradingView, FibAlgo's smart money detection features can identify institutional accumulation patterns that often precede manipulation moves. When you see smart money accumulating below support, a stop hunt above that level becomes highly probable.
I also maintain a manipulation journal, separate from my regular trading journal. I track:
- Time of manipulation event
- Currency pair and direction
- Distance of stop hunt
- Reversal characteristics
- Subsequent move distance
After six months of tracking, patterns become obvious. EUR/USD loves stop hunts between 2-4 AM EST. GBP/JPY manipulation peaks around Tokyo open. USD/CAD false breakouts cluster around oil inventory reports.
Building Your Anti-Manipulation Edge
The forex market will always have manipulation — it's how large orders get filled without massive slippage. But understanding these patterns transforms them from account killers to profit opportunities.
Start with observation. For the next month, don't trade these patterns — just watch for them. Mark every suspected stop hunt, fake breakout, or time-based trap on your charts. You'll be shocked how frequent they are once you know what to look for.
Then paper trade the reversals. Wait for the manipulation to complete, enter on confirmation, and track your results. My students typically need 20-30 practice trades before the patterns become second nature.
Remember: The goal isn't to outsmart market makers — they have more information and resources than you ever will. The goal is to understand their needs and position yourself accordingly. They need liquidity; you can trade the moves that create it.
Every stop hunt creates an opportunity. Every fake breakout sets up a reversal. Every time-based trap establishes a tradeable pattern. The hunters have become predictable in their hunting.
The market makers aren't your enemy — they're just participants with different needs and capabilities. Once you understand their patterns, you can stop being the prey and start being a profitable scavenger, feeding on the opportunities their activities create.
After 14 years in this game — six hunting stops and eight avoiding them — I can tell you this: The manipulation will never stop. But your losses to it can.


